ManagementBits update (February, 2009)
Sunday, March 1st, 2009Monthly summary of my Management Bits and Tips blog including January posts:
- Dmitry Vostokov @ DumpAnalysis.org -
Monthly summary of my Management Bits and Tips blog including January posts:
- Dmitry Vostokov @ DumpAnalysis.org -
Monthly summary of my Literate Scientist blog including January reviews:
Literate Scientists and Their Books
- Dmitry Vostokov @ DumpAnalysis.org -
The first issue of Debugged! MZ/PE magazine is going to be printed on debugged paper (not to confused with common bugs-free paper used in publishing houses and printing factories). Once you open the first issue you would instantly recognize that!
- Dmitry Vostokov @ DumpAnalysis.org -
Looked this evening at Amazon and found that the book achieved #1 status (although it might not be the case at the time when you are reading this post):
| Books > Computers & Internet > Programming > Languages & Tools > Assembly Language Programming |
- Dmitry Vostokov @ DumpAnalysis.org -
Named after Bernhard Riemann, this programming language gives software defects first-class status as alternative branches of computation, comparable with multivalued functions and Riemann surfaces. Bugs become first-class constructs. It is reflected in the language syntax, semantics and pragmatics. More on this later.
- Dmitry Vostokov @ DumpAnalysis.org -
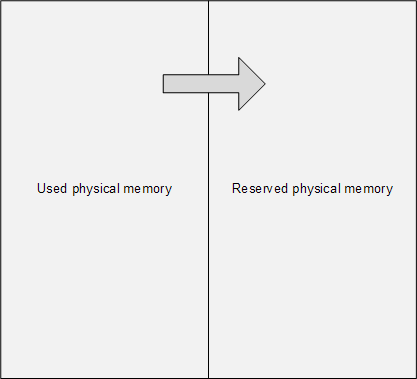
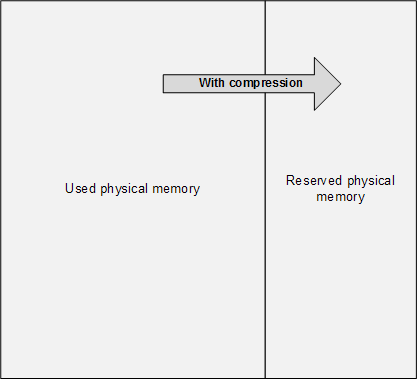
The main problem of memory dump analysis is the lack of consistent kernel virtual memory dumps saved on demand without system halt. LiveKd and Win32DD tools are physical memory dumpers only and do not save kernel memory dump files. These dumps are known to be inconsistent and I elaborated on different schemes to save memory consistently, for example, 1) to partition physical memory into 2 parts from OS boot time, 2) when memory snapshot is needed raise IRQL on all processors, 3) pump memory contents from one part to another (with compression if necessary, in such partition the reserved part of physical memory could be smaller), 4) lower IRQL on all processors to resume normal OS functions and 5) save consistent memory snapshot from reserved part of physical memory to a dump file in the background. The crucial feature of osmosis is its bipartite division and membrane. Hence the name of the project:
OSMOSIS
Optimally Saved Memory of System Internal State
Optimally Saved Memory (of) Operating System Internal State
This is, of course, for OS running on physical machines, virtual machine case is much simpler in theory because we can freeze the whole VM or save its snapshot and later run an external tool or file converter on it.
- Dmitry Vostokov @ DumpAnalysis.org -
One of the good outcomes of the previously announced restructuring: the book Crash Dump Analysis for System Administrators (Windows edition) has been prioritized to be published on 30th of November, 2009 due to the overwhelming demand. The book will soon be available for pre-orders.
- Dmitry Vostokov @ DumpAnalysis.org -
Noticed today on Amazon that my book becomes more expensive after being used:

- Dmitry Vostokov @ DumpAnalysis.org -
Most of (if not all) debugging is arithmetical. Here I would like to introduce a new kind of debugging and troubleshooting approach that interprets observables as objects in their own spaces, for example, the possible space of various GUI forms. These spaces are not necessarily rational-valued spaces of simulation output or discreet arithmetic spaces of memory locations and values.
This geometrical approach applies modeling and systems theory to debugging and troubleshooting by treating them as mappings (or functions in the case of one-to-one or many-to-one mappings) from the space of all possible software environment states (SE) to the space(s) of observables. Here we have a family of mappings to different spaces:
fi: SE → SOi
Some observables can be found fixed like the list of components and the number of mappings can be reduced (i < j):
fj: SEa,b,c,d,… → SOj
In every system and its environment we have something fixed as parameters (a, b, c, d, …) and this could be the list of components as high level ”genotype” or it could be just specific code (low-level “genotype”), specific data or hardware specification. The whole family of mappings become parametrized. If we want, we can reduce mappings even more to treat them as many-valued (one-to-many or many-to-many) if several observables belong to the same kind of space.
Let me illustrate this by an analogy with modeling of a natural system. The system to be modeled is a falling ball together with its environment (Earth). The system obviously has some internal structure (abstract space of states, E) but we don’t know it. Fortunately, we can observe some measurable values like the ball position at any time (Q). So we have these mappings for balls with different masses:
fm: E → Q
We also find that for any individual ball its mass doesn’t change so we abstract it as a parameter:
f: Em → Q
The same modeling approach can be applied to a software system be it an application or a service running inside an operating system or a software system itself running inside a hardware. The case of pure software system abstracted from hardware is simple. In such a case SE space theoretically could be the space of abstract memory dumps. Practically we deal with the space of observables (universal memory dumps) that approximate SE and spaces of software “phenotypes”, observable behaviour, like distorted GUI, for example, or measured values of memory and CPU consumption or disk I/O throughput.
- Dmitry Vostokov @ DumpAnalysis.org -
The book is available for ordering from Amazon with a significant discount:
Windows Debugging: Practical Foundations

Although listed as temporarily out of stock at the time of this writing it should appear in stock in a few days. Search Inside is also enabled.
- Dmitry Vostokov @ DumpAnalysis.org -
OpenTask, the publisher of my books, announces restructuring:
http://www.opentask.com/restructuring-2009
- Dmitry Vostokov @ DumpAnalysis.org -
Andrzej Dyjak features Linux application core dumps converted to bitmap images:
- Dmitry Vostokov @ DumpAnalysis.org -
The number of visits / month increased by 50% by the end of the year with more than 125,000 unique visitors in 2008 from 180 countries (150 in 2007) and almost 34% of them coming back. Here are the top 100 network locations out of almost 24,000:
|
Network Location |
Visits |
|
microsoft corp |
7849 |
|
insignium llc |
6206 |
|
comcast cable communications inc. |
3603 |
|
road runner holdco llc |
3260 |
|
verizon internet services inc. |
2263 |
|
comite gestor da internet no brasil |
1818 |
|
deutsche telekom ag |
1804 |
|
hewlett-packard company |
1736 |
|
network of citrix systems inc |
1667 |
|
eircom ltd |
1582 |
|
japan network information center |
1569 |
|
reliance communications ltd |
1419 |
|
videsh sanchar nigam ltd - india. |
1414 |
|
chunghwa telecom data communication business group |
1371 |
|
symantec corporation |
1228 |
|
unknown |
1167 |
|
data general corporation |
1098 |
|
microsoft european internet data centres |
1096 |
|
comcast cable communications |
1074 |
|
bellsouth.net inc. |
1048 |
|
ip pools |
1025 |
|
intel corporation |
987 |
|
charter communications |
967 |
|
nib (national internet backbone) |
960 |
|
korea telecom |
895 |
|
cncgroup beijing province network |
885 |
|
cox communications |
875 |
|
comcast cable communications holdings inc |
835 |
|
proxad / free sas |
785 |
|
uunet non-portable customer assignment |
710 |
|
shaw communications inc. |
675 |
|
citrix systems inc. |
662 |
|
xo communications |
660 |
|
cox communications inc. |
655 |
|
comcast cable communications ip services |
646 |
|
qwest communications corporation |
617 |
|
krnic |
571 |
|
rcs & rds s.a. |
566 |
|
jarvis universal purchase company |
551 |
|
chinanet guangdong province network |
545 |
|
optimum online (cablevision systems) |
541 |
|
computer associates international |
540 |
|
telstra internet |
540 |
|
dell computer corporation |
514 |
|
rogers cable communications inc. |
509 |
|
axa-tech |
506 |
|
provider local registry |
492 |
|
chinanet shanghai province network |
487 |
|
performance systems international inc. |
454 |
|
telus communications inc. |
445 |
|
kintiskton llc |
444 |
|
at&t internet services |
443 |
|
arcor ag |
434 |
|
merrill lynch and company inc. |
433 |
|
ntt communications corporation |
428 |
|
easynet ltd |
426 |
|
research in motion limited |
419 |
|
iinet limited |
399 |
|
vmware inc. |
395 |
|
abts (karnataka) |
393 |
|
symantec inc |
390 |
|
hoshin gigamedia center inc. |
389 |
|
zao mtu-intel |
389 |
|
microsoft corporation |
369 |
|
telefonica de espana |
356 |
|
internet service provider |
352 |
|
time warner telecom inc. |
351 |
|
@home network japan |
348 |
|
telekom malaysia berhad |
342 |
|
sympatico hse |
341 |
|
network of ign arch. and design gb |
327 |
|
global crossing |
322 |
|
wipro technologies |
308 |
|
xdsl access and service provider in norway |
301 |
|
chinanet fujian province network |
289 |
|
at&t global network services |
283 |
|
comcast cable communications inc |
277 |
|
neostrada plus |
274 |
|
samtel |
273 |
|
oracle datenbanksysteme gmbh |
272 |
|
provider |
266 |
|
telecom italia net |
265 |
|
sun microsystems inc |
257 |
|
tiscali uk ltd |
254 |
|
starhub cable vision ltd |
251 |
|
telecom italia s.p.a. tin easy lite |
251 |
|
tw telecom holdings inc. |
249 |
|
earthlink inc. |
247 |
|
level 3 communications inc. |
247 |
|
kddi corporation |
245 |
|
comcast business communications inc. |
242 |
|
nvidia |
242 |
|
cisco systems inc. |
240 |
|
hanaro telecom inc. |
239 |
|
chinanet jiangsu province network |
235 |
|
internet provider of donetsk region |
234 |
|
videotron ltee |
230 |
|
xs4all internet bv |
229 |
|
gesti n de direccionamiento uninet |
224 |
|
dynamic pools |
223 |
Almost 66,000 Google search keywords (more than 100% increase since 2007) pointed to the portal and this blog with 100 most frequent:
|
Keyword |
Visits |
|
kifastsystemcallret |
2483 |
|
crash dump analysis |
1933 |
|
crash dump |
1551 |
|
ntdll!kifastsystemcallret |
1072 |
|
dump analysis |
852 |
|
crash dumps |
608 |
|
windbg commands |
560 |
|
dumpanalysis.org/asmpedia |
537 |
|
vista crash dump |
537 |
|
kmode_exception_not_handled |
521 |
|
crashdump |
509 |
|
minidump |
429 |
|
win32 error 0n2 |
412 |
|
memory dump analysis anthology |
395 |
|
dynamicbase aslr |
362 |
|
symbol file could not be found |
357 |
|
system_service_exception |
316 |
|
windbg |
311 |
|
memuon |
298 |
|
windbg analyze |
292 |
|
dmitry vostokov |
289 |
|
warning: frame ip not in any known module. following frames may be wrong. |
272 |
|
kernel32!pnlsuserinfo |
267 |
|
time travel debugging |
258 |
|
crash dump vista |
251 |
|
memory dump analysis |
243 |
|
minidump analysis |
236 |
|
getcontextstate failed, 0×80070026 |
230 |
|
dumpanalysis.org |
225 |
|
dr watson vista |
218 |
|
windbg script |
206 |
|
memory intelligence analysis”" |
205 |
|
crash dump analyzer |
187 |
|
kernel_mode_exception_not_handled |
182 |
|
frame ip not in any known module |
180 |
|
windows crash dump analysis |
179 |
|
calling+kernel+functions+from+userspace |
175 |
|
minidump analyzer |
172 |
|
windows via c/c++ |
170 |
|
dumpanalysis |
169 |
|
the stored exception information can be accessed via .ecxr. |
159 |
|
warning: stack unwind information not available. following frames may be wrong. |
159 |
|
pool corruption |
158 |
|
your debugger is not using the correct symbols |
158 |
|
error: symbol file could not be found |
157 |
|
windbg scripts |
156 |
|
drwtsn32 vista |
143 |
|
windbg cheat sheet |
142 |
|
minidump analyze |
136 |
|
adplus |
134 |
|
memory dump analysis”" download |
132 |
|
www.dump |
128 |
|
ibmsprem.exe |
126 |
|
session_has_valid_views_on_exit (ba) |
125 |
|
what is a crash dump |
125 |
|
bios disassembly ninjutsu uncovered |
122 |
|
the stored exception information can be accessed via .ecxr |
122 |
|
how to use windbg |
121 |
|
memory dump |
121 |
|
trap frame |
121 |
|
gdb teb |
119 |
|
type referenced: kernel32!pnlsuserinfo |
118 |
|
windows dump analysis |
118 |
|
savedump.exe |
115 |
|
bugcheck a |
113 |
|
windbg crash dump |
113 |
|
0×80070026 |
110 |
|
dxg.sys |
110 |
|
dump analyzer |
109 |
|
windbg !analyze |
106 |
|
how to open corrupt memory dump |
105 |
|
kisystemservicecopyend |
104 |
|
exfreepoolwithtag |
103 |
|
dump |
102 |
|
windbg command |
101 |
|
obfreferenceobject |
99 |
|
analyze minidump |
96 |
|
forthcoming windows® debugging: practical foundations |
95 |
|
kiswapcontext |
95 |
|
failure_bucket_id |
93 |
|
ntdll kifastsystemcallret |
91 |
|
regionusageisvad |
91 |
|
c++ dereferencing null debug |
90 |
|
receivelotsacalls |
90 |
|
userdump |
90 |
|
debug_flr_image_timestamp |
89 |
|
kifastsystemcall |
89 |
|
bugcheck 3b |
87 |
|
your debugger is not using the correct symbols”" |
86 |
|
vista dr watson |
84 |
|
windows crash dump |
84 |
|
“flow analysis was incomplete, some code may be missing” |
83 |
|
practical foundations of debugging |
83 |
|
system_thread_exception_not_handled |
83 |
|
warning: frame ip not in any known module. following frames may be wrong |
83 |
|
windbg dump |
83 |
|
dd srvcomputername |
81 |
|
error: symbol file could not be found. |
79 |
|
windows dump analyzer |
78 |
|
crash analyzer |
77 |
Special thanks to 950 web sites that mention the portal and this blog with the first top 100:
|
google.com |
|
blogs.msdn.com |
|
windbg.dumpanalysis.org |
|
rsdn.ru |
|
jasonhaley.com |
|
dumpanalysis.com |
|
dumpanalysis.org |
|
stumbleupon.com |
|
images.google.com |
|
advancedwindowsdebugging.com |
|
nynaeve.net |
|
blog.flexilis.com |
|
blog.not-a-kernel-guy.com |
|
brianmadden.com |
|
voneinem-windbg.blogspot.com |
|
insidewindows.kr |
|
forum.sysinternals.com |
|
caloni.com.br |
|
en.wikipedia.org |
|
debuglab.com |
|
reddit.com |
|
winvistaclub.com |
|
driveronline.org |
|
127.0.0.1:12108 |
|
support.citrix.com |
|
softwareastrology.com |
|
managementbits.com |
|
hanrss.com |
|
opentask.com |
|
msuiche.net |
|
blog.naver.com |
|
bloglines.com |
|
blogs.microsoft.co.il |
|
clausbrod.de |
|
citrixblogger.org |
|
images.google.co.uk |
|
reconstructer.org |
|
advdbg.org |
|
community.citrix.com |
|
google.co.kr |
|
stackoverflow.com |
|
citrite.org |
|
mail.google.com |
|
serious-code.net |
|
shellexecute.wordpress.com |
|
experts-exchange.com |
|
google.co.uk |
|
groups.google.com |
|
wasm.ru |
|
microsoft.com |
|
images.google.co.in |
|
dogpile.com |
|
google.ca |
|
images.google.de |
|
del.icio.us |
|
thinkdigit.com |
|
google.co.in |
|
blog.gamedeff.com |
|
blogs.technet.com |
|
ttoyota.com |
|
goozydumps.wordpress.com |
|
software.rkuster.com |
|
users.livejournal.com |
|
insidekernel.net |
|
insiderim |
|
jpassing.wordpress.com |
|
10.1.12.201 |
|
d.hatena.ne.jp |
|
google.ru |
|
archut.net |
|
isisaka.com |
|
facebook.com |
|
devnote.net |
|
evilcodecave.wordpress.com |
|
google-analytics.com |
|
my.live.com |
|
shm.polar.tw |
|
64.233.183.104 |
|
technorati.com |
|
delicious.com |
|
tarasc0.blogspot.com |
|
literatescientist.com |
|
search.naver.com |
|
linkedin.com |
|
pubforum.info |
|
twitter.com |
|
nyx.cz |
|
hongyver.pe.kr |
|
cnblogs.com |
|
bishop3000.livejournal.com |
|
webmail.dumpanalysis.org |
|
fafeng.blogbus.com |
|
driverentry.com.br |
|
gp32x.com |
|
windowstips.wordpress.com |
|
vahidnasiri.blogspot.com |
|
209.85.173.104 |
|
images.google.ca |
|
kerneldebugging.com |
Top 25 visiting countries:
|
United States |
|
United Kingdom |
|
India |
|
Germany |
|
Canada |
|
China |
|
Russia |
|
Japan |
|
France |
|
South Korea |
|
Ireland |
|
Australia |
|
Taiwan |
|
Netherlands |
|
Israel |
|
Italy |
|
Sweden |
|
Brazil |
|
Singapore |
|
Spain |
|
Ukraine |
|
Romania |
|
Poland |
|
Norway |
|
Belgium |
- Dmitry Vostokov @ DumpAnalysis.org -
Listening to étude No. 1 in C major written by Frédéric Chopin (Op. 10) an idea came to me about writing 16 debugging études (ISBN: 978-1906717575). It is surprising that there are many programming études out there but there are no debugging ones. Stay tuned and be in touch with this blog.
Draft definition:
Debugging étude is a composition of software with intentional defects (bugs) of considerable difficulty to find and fix, designed to provide practice material to perfect debugging techniques and problem-solving skills.
The idea actually came to me long time ago to create some sort of debugging excersises for training purposes.
- Dmitry Vostokov @ DumpAnalysis.org -
DumpAnalysis.org announces forthcoming 2010 as The Year of Dump Analysis.
Q&A
Q. Why 2010?
A. Two reasons: 1) To do dump analysis effectively and efficiently an engineer needs some experience in debugging acquired in the previous year of debugging (perhaps after 7 debugging nights, 2009, 0×7D9); 2) 2010 is 0×7DA.
Q. What is the meaning of 7?
A. It is interpreted as Dump Analysis 7 days a week. Like what I do. Or from kernel pool tag perspective it is AD7: Analysis of Dumps 7 days a week.
Q. What about the year 2011, 2012, 2013? 0×7DB, 0×7DC and 0×7DD?
A. Hmm, sounds like WinDbg commands db, dc and dd…
- Dmitry Vostokov @ DumpAnalysis.org -
I very proud to announce that after 3 weeks of final work the book has been released in both paperback and PDF format. In a week or so it should also appear on Amazon and other booksellers around the world. The book information and how to buy it can be found on the portal:
Windows Debugging: Practical Foundations
- Dmitry Vostokov @ DumpAnalysis.org -
Draft Table of Contents is available for the forthcoming Windows Debugging: Practical Foundations book to be released next week:
- Dmitry Vostokov @ DumpAnalysis.org -
According to Hex Blog IDA v5.4 will be able to do user and kernel local and remote mode debugging on Windows automatically loading PDB files if necessary. I’m now considering to spend a portion of my book author compensation on purchasing a licence for IDA Pro ![]()
- Dmitry Vostokov @ DumpAnalysis.org -
I’ve been fascinated by Chemistry since the age of 13-14. At that time I noticed organic formulae on the blackboard of a higher school class and was curious about what they meant. So I asked my mother to bring me a book about Chemistry from a library and she brought a school textbook about Inorganic Chemistry. I read it in a few weeks and proceeded to reading a textbook about Organic Chemistry. At the same time I found in a local library 10 volumes of The Feynman Lectures on Physics (in Russian translation) and started reading the first volumes on classical mechanics and learnt about calculus. Another popular book about Quantum Chemistry raised my curiosity in Quantum Mechanics and Morris Kline’s The Loss of Certainty book (in Russian translation) made me interested in abstract mathematics and its logical and set-theoretical foundations including Gödel’s theorems and intuitionistic mathematics. All this happened before the age of 16 and in one evening when I was reading a Linear Algebra textbook an idea struck me to represent certain aspects of Inorganic Chemistry formalisms like Periodic Table and empirical formulas of chemical compounds as linear vector spaces of element vectors over the field of numbers.
Now OpenTask is going to publish its first popular science book called:
Vector Space Chemistry (ISBN: 978-1906717551)
with a preface written after 25 years since the discovery of this mathematical model and formalization of Chemistry.
A note for cautious readers: I’m aware about over-excessive application of mathematics in sciences, especially after reading these books:
Fashionable Nonsense and Social Sciences as Sorcery
My book is just a popular science book that explains some chemical and abstract mathematical concepts and provides an example of using Mathematics as a modeling and formalization tool for Chemistry.
- Dmitry Vostokov @ DumpAnalysis.org -
DumpAnalysis.org team starts working on the next generation multi-monitor memory visualization framework utilizing DirectShow, Direct2D, Direct3D and DXGI technologies. Full system architecture and sample code for memory viewers using DirectShow technology will be featured in the forthcoming Computer Memory Visualization book.
- Dmitry Vostokov @ DumpAnalysis.org -