Trace Analysis Patterns (Part 263)
A typical trace or log is a detailed narrative, and one of the first analysis tasks is to check whether the expected Basic Facts are present: user name, machine name, process, component, time, operation, resource, or other problem-description facts. If those facts are absent or inconsistent, the trace may have been collected at the wrong time, on the wrong system, or under different conditions:
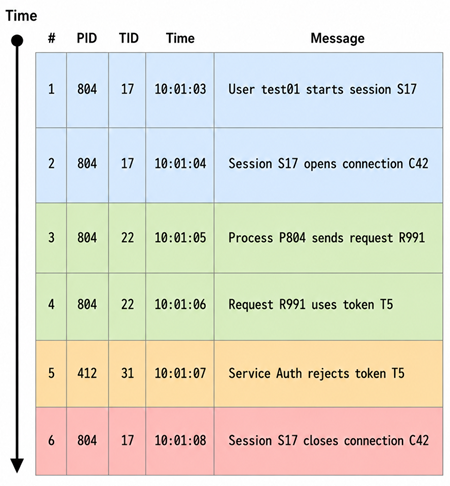
However, vocabulary alone is not enough. A trace may contain all expected words and identifiers, yet the analyst (human or AI) may still not understand what kind of things they are, how they relate, and what diagnostic roles they play. Usernames, process IDs, request IDs, sessions, endpoints, file names, transactions, queues, locks, models, agents, function and tool calls, or error messages are trace entities with roles and relationships. Trace Ontology is a trace and log analysis pattern that identifies the domain entities, classes, relations, and constraints, both explicit and implicit, in trace messages. It turns raw trace vocabulary into a practical structured diagnostic model:
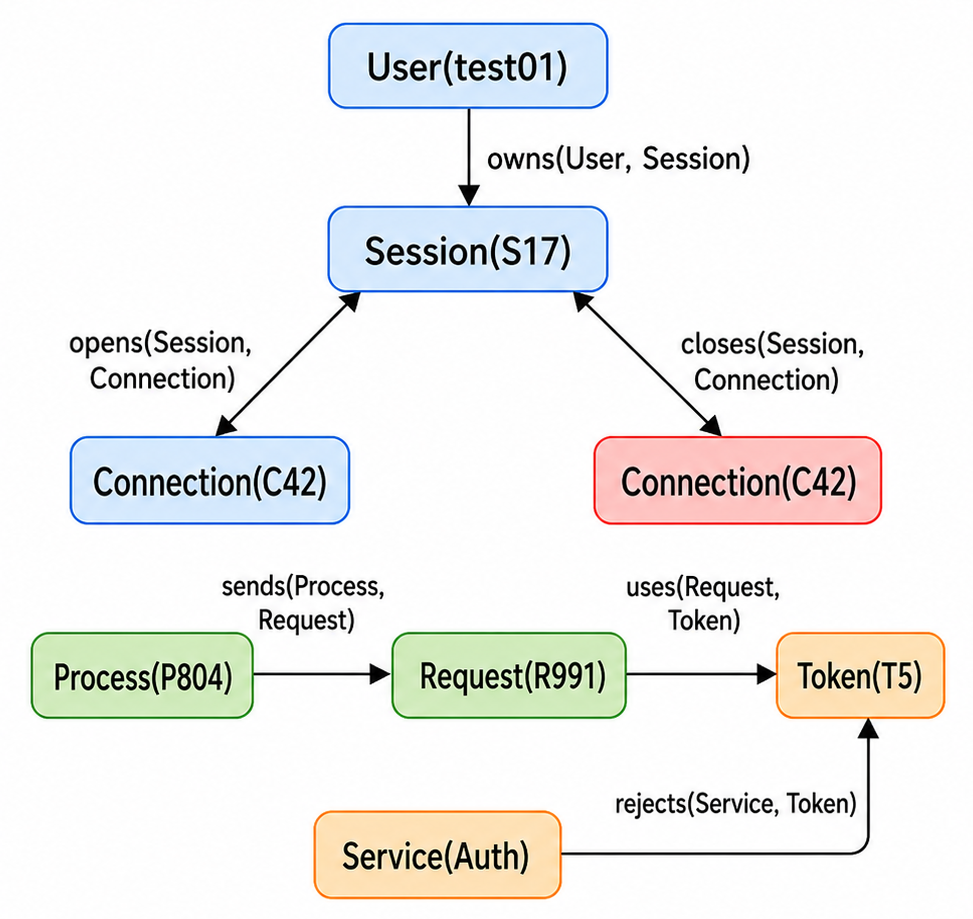
Therefore, Trace Ontology extends Basic Facts from vocabulary recognition to structured diagnostic representation. In summary, Basic Facts answer the following question: What vocabulary from the problem description is visible in the trace or log? Trace Ontology answers: What kinds of things exist in this trace, how are they related, and what can be inferred from those relations?
Also, Trace Ontology, as a representational model, can be coupled with Semantic Mapping, a presentation transformation that relabels opaque identifiers with meaningful names. Note that trace ontologies may exist before traces are collected. In such a case, they simplify the analysis.
- Dmitry Vostokov @ DumpAnalysis.org + TraceAnalysis.org -