Introducing Crash and Hang Analysis Audit Service

June 16th, 2010

Adding AI. Analysis Improvement.

After reading earlier today Windows Internals pages about system audit an idea came to my mind in the evening to provide audit services for memory dump and software trace analysis. One mind is good but two are better, especially if the second is a pattern-driven AI. Here are possible problem scenarios:

Problem: You are not satisfied with a crash report.

Problem: Your critical issue is escalated to the VP level. Engineers analyze memory dumps and software traces. No definite conclusion so far. You want to be sure that nothing has been omitted from the analysis.

Problem: You analyze a system dump or a software trace. You need a second pair of eyes but don’t want to send your memory dump due to your company security policies.

Other scenarios (use cases) will be added as soon as I see the service fit to the realities of software technical support.

I plan to make this service operational in July - August, 2010. Prices to be announced soon.

- Dmitry Vostokov @ DumpAnalysis.org + TraceAnalysis.org -

10 Common Mistakes in Memory Analysis (Part 8)

June 16th, 2010

Yet another common mistake is not looking past the first found evidence. For example, not looking further to prove or disprove a hypothesis after finding a pattern. Let me illustrate this by a complete memory dump from a frozen system. Careful analysis of wait chains revealed a thread owning a mutant and blocking other threads from many processes:

THREAD 882e8730  Cid 0f64.2ce0  Teb: 7ff76000 Win32Thread: 00000000 WAIT: (Unknown) UserMode Non-Alertable
    89a76e08  SynchronizationEvent
IRP List:
    883fbba0: (0006,0220) Flags: 00000830  Mdl: 00000000
Not impersonating
DeviceMap                 e1003880
Owning Process            89e264e8       Image:         ProcessA.exe
Attached Process          N/A            Image:         N/A
Wait Start TickCount      5090720        Ticks: 1981028 (0:08:35:53.562)
Context Switch Count      8376            
UserTime                  00:00:00.000
KernelTime                00:00:00.015
Win32 Start Address 0×010d22a3
LPC Server thread working on message Id 10d22a3
Start Address kernel32!BaseThreadStartThunk (0×77e617ec)
Stack Init b6e8b000 Current b6e8ac60 Base b6e8b000 Limit b6e88000 Call 0
Priority 10 BasePriority 10 PriorityDecrement 0
ChildEBP RetAddr 
b6e8ac78 8083d26e nt!KiSwapContext+0×26
b6e8aca4 8083dc5e nt!KiSwapThread+0×2e5
b6e8acec 8092cd88 nt!KeWaitForSingleObject+0×346
b6e8ad50 8083387f nt!NtWaitForSingleObject+0×9a
b6e8ad50 7c82860c nt!KiFastCallEntry+0xfc (TrapFrame @ b6e8ad64)
0408f910 7c827d29 ntdll!KiFastSystemCallRet
0408f914 77e61d1e ntdll!ZwWaitForSingleObject+0xc
0408f984 77e61c8d kernel32!WaitForSingleObjectEx+0xac
0408f998 027f0808 kernel32!WaitForSingleObject+0×12
0408f9bc 027588d4 DllA!DriverB_DependentFunction+0×86
[…]
0408ffec 00000000 kernel32!BaseThreadStart+0×34

So we did found a culprit component, DllA, or not? Could this blockage result from earlier problems? We search stack trace collection for any other anomalous activity (Semantic Split) and we find indeed a recurrent stack trace pattern across process landscape:

THREAD 89edadb0  Cid 09fc.1050  Teb: 7ff54000 Win32Thread: 00000000 WAIT: (Unknown) KernelMode Non-Alertable
    8a38b82c  SynchronizationEvent
IRP List:
    893a7470: (0006,0094) Flags: 00000000  Mdl: 00000000
Not impersonating
DeviceMap                 e16dc398
Owning Process            8a2ad5e0       Image:         ProcessB.exe
Attached Process          N/A            Image:         N/A
Wait Start TickCount      3704877        Ticks: 3366871 (0:14:36:47.359)
Context Switch Count      121867            
UserTime                  00:00:25.093
KernelTime                00:00:01.968
Win32 Start Address MSVCR71!_threadstartex (0×7c3494f6)
Start Address kernel32!BaseThreadStartThunk (0×77e617ec)
Stack Init f3a9c000 Current f3a9b548 Base f3a9c000 Limit f3a99000 Call 0
Priority 8 BasePriority 8 PriorityDecrement 0
ChildEBP RetAddr 
f3a9b560 8083d26e nt!KiSwapContext+0×26
f3a9b58c 8083dc5e nt!KiSwapThread+0×2e5
f3a9b5d4 f6866255 nt!KeWaitForSingleObject+0×346
f3a9b5f4 f68663e3 DriverA!Block+0×1b
f3a9b604 f5ba05f1 DriverA!BlockWithTracker+0×19
f3a9b634 f5b9ba24 DriverB!DoRequest+0xc2
f3a9b724 f5b9b702 DriverB!QueryInfo+0×392

[…]

0: kd> !irp 893a7470
Irp is active with 1 stacks 1 is current (= 0×893a74e0)
 No Mdl: No System Buffer: Thread 89edadb0:  Irp stack trace. 
     cmd  flg cl Device   File     Completion-Context
>[  e, 0]   0  1 8a216f18 8a023f70 00000000-00000000    pending
        \Driver\DriverB
   Args: 0000015c 00000024 00120003 111af32c

We know that DllA!DriverB_DependentFunction will not work if DriverB device doesn’t function (for example, remote file system access without network access). The thread 89edadb0 had been waiting for more 14 hours and the originally found thread 882e8730 was waiting for less than 9 hours. This suggests looking first into DriverB / DriverA functions first.

- Dmitry Vostokov @ DumpAnalysis.org + TraceAnalysis.org -

Icons for Memory Dump Analysis Patterns (Part 47)

June 14th, 2010

Today we introduce an icon for Coupled Processes (strong) pattern:

B/W

Color

- Dmitry Vostokov @ DumpAnalysis.org + TraceAnalysis.org -

The Extended Software Trace

June 13th, 2010

By analogy with paratext let’s introduce a software narratological concept of the extended software trace that consists of a software trace plus additional supporting information that makes troubleshooting and debugging easier. Such “paratextual” information can consists of pictures, videos, accounts of scenarios and past problem histories, customer interviews and even software trace delivery medium and format (if preformatted).

- Dmitry Vostokov @ DumpAnalysis.org + TraceAnalysis.org -

Attached Processes

June 11th, 2010

I’d always seen the empty field Attached Process in !thread command output:

1: kd> !thread fffffa802c2cfbb0 ff
THREAD fffffa802c2cfbb0  Cid 43b8.470c  Teb: 000007fffffda000 Win32Thread: 0000000000000000 WAIT: (WrQueue) UserMode Non-Alertable
    fffffa802acfc970  QueueObject
    fffffa802c2cfc68  NotificationTimer
Not impersonating
DeviceMap                 fffff88000008e00
Owning Process            fffffa802af8ac10       Image:         winlogon.exe
Attached Process          N/A            Image:         N/A
Wait Start TickCount      428658         Ticks: 3 (0:00:00:00.046)
Context Switch Count      4            
UserTime                  00:00:00.000
KernelTime                00:00:00.000
Win32 Start Address RPCRT4!ThreadStartRoutine (0×000007fefea07780)
Stack Init fffffa6029203db0 Current fffffa60292037e0
Base fffffa6029204000 Limit fffffa60291fe000 Call 0
Priority 13 BasePriority 13 PriorityDecrement 0 IoPriority 2 PagePriority 5
Child-SP          RetAddr           Call Site
fffffa60`29203820 fffff800`01a6b9fa nt!KiSwapContext+0×7f
fffffa60`29203960 fffff800`01a6ee94 nt!KiSwapThread+0×13a
fffffa60`292039d0 fffff800`01cd1cd7 nt!KeRemoveQueueEx+0×4b4
fffffa60`29203a80 fffff800`01ca8b2d nt!IoRemoveIoCompletion+0×47
fffffa60`29203b00 fffff800`01a69233 nt!NtRemoveIoCompletion+0×13d
fffffa60`29203bb0 00000000`778c6daa nt!KiSystemServiceCopyEnd+0×13 (TrapFrame @ fffffa60`29203c20)
00000000`017ff9f8 00000000`7769f65c ntdll!NtRemoveIoCompletion+0xa
00000000`017ffa00 000007fe`fea25d0d kernel32!GetQueuedCompletionStatus+0×48
00000000`017ffa60 000007fe`fea25b93 RPCRT4!COMMON_ProcessCalls+0×7d
00000000`017ffaf0 000007fe`fea07769 RPCRT4!LOADABLE_TRANSPORT::ProcessIOEvents+0×133
00000000`017ffba0 000007fe`fea07714 RPCRT4!ProcessIOEventsWrapper+0×9
00000000`017ffbd0 000007fe`fea077a4 RPCRT4!BaseCachedThreadRoutine+0×94
00000000`017ffc10 00000000`7769be3d RPCRT4!ThreadStartRoutine+0×24
00000000`017ffc40 00000000`778a6a51 kernel32!BaseThreadInitThunk+0xd
00000000`017ffc70 00000000`00000000 ntdll!RtlUserThreadStart+0×1d

Until recently I got this stack trace from winlogon.exe deep in win32k.sys. Because csrss.exe is a session-specific user-space counterpart to win32k.sys it make sense to see it attached:

1: kd> !thread fffffa802b2e6bb0 ff
THREAD fffffa802b2e6bb0  Cid 43b8.74d0  Teb: 000007fffffdc000 Win32Thread: fffff900c0016690 RUNNING on processor 1
Not impersonating
DeviceMap                 fffff88000008e00
Owning Process            fffffa802af8ac10       Image:         winlogon.exe
Attached Process          fffffa80174d7040       Image:         csrss.exe
Wait Start TickCount      428661         Ticks: 0
Context Switch Count      212                 LargeStack
UserTime                  00:00:00.000
KernelTime                00:00:00.031
Win32 Start Address 0×00000000ff860260
Stack Init fffffa60294c15f0 Current fffffa60294c0ec0
Base fffffa60294c3000 Limit fffffa60294b9000 Call fffffa60294c1840
Priority 15 BasePriority 15 PriorityDecrement 0 IoPriority 2 PagePriority 5
Child-SP          RetAddr           Call Site
fffffa60`294c0340 fffff800`01a77197 nt!MiAllocatePagedPoolPages+0×69d
fffffa60`294c0410 fffff800`01b49f07 nt!ExpAllocateBigPool+0xa7
fffffa60`294c04f0 fffff960`00082f28 nt!ExAllocatePoolWithTag+0×767
fffffa60`294c05c0 fffff960`00094863 win32k!EngAllocMem+0×3c
fffffa60`294c05f0 fffff960`00094749 win32k!ttfdOpenFontContextInternal+0xbf
fffffa60`294c0630 fffff960`000976d9 win32k!ttfdOpenFontContext+0×1d
fffffa60`294c0670 fffff960`0009762c win32k!ttfdQueryFontData+0×49
fffffa60`294c06c0 fffff960`0008c335 win32k!ttfdSemQueryFontData+0×7c
fffffa60`294c0720 fffff960`0008989a win32k!PDEVOBJ::QueryFontData+0×79
fffffa60`294c0780 fffff960`0008bacb win32k!RFONTOBJ::bGetDEVICEMETRICS+0×6a
fffffa60`294c07d0 fffff960`0004d0e1 win32k!RFONTOBJ::bRealizeFont+0×2df
fffffa60`294c08f0 fffff960`0004caa5 win32k!RFONTOBJ::vInit+0×379
fffffa60`294c0bb0 fffff960`00048fdd win32k!RFONTOBJ::vInitEUDC+0×5e5
fffffa60`294c0d80 fffff960`0008c516 win32k!RFONTOBJ::wpgdGetLinkMetricsPlus+0×33d
fffffa60`294c0e00 fffff960`0009b1b2 win32k!RFONTOBJ::bGetGlyphMetrics+0×1b6
fffffa60`294c0e80 fffff960`00082699 win32k!RFONTOBJ::bGetWidthTable+0×262
fffffa60`294c1080 fffff960`00082395 win32k!iGetPublicWidthTable+0×28d
fffffa60`294c1430 fffff800`01a69233 win32k!NtGdiSetupPublicCFONT+0×25
fffffa60`294c1460 000007fe`fe23c55a nt!KiSystemServiceCopyEnd+0×13 (TrapFrame @ fffffa60`294c1460)

1: kd> !thread fffffa802bd9f060 ff
THREAD fffffa802bd9f060  Cid 7624.28b8  Teb: 000007fffffdd000 Win32Thread: fffff900c0016690 RUNNING on processor 0
Not impersonating
DeviceMap                 fffff88000008e00
Owning Process            fffffa802b18d040       Image:         winlogon.exe
Attached Process          fffffa802ad2fc10       Image:         csrss.exe
Wait Start TickCount      428661         Ticks: 0
Context Switch Count      196                 LargeStack
UserTime                  00:00:00.000
KernelTime                00:00:00.046
Win32 Start Address 0×00000000ff860260
Stack Init fffffa60296b3db0 Current fffffa60296b1980
Base fffffa60296b4000 Limit fffffa60296aa000 Call 0
Priority 15 BasePriority 15 PriorityDecrement 0 IoPriority 2 PagePriority 5
Child-SP          RetAddr           Call Site
fffffa60`296b22b8 fffff960`0009022a win32k!itrp_CINDEX+0×4f
fffffa60`296b22c0 fffff960`00092817 win32k!itrp_InnerExecute+0×36
fffffa60`296b22f0 fffff960`0009022a win32k!itrp_CALL+0×26f
fffffa60`296b2360 fffff960`00092817 win32k!itrp_InnerExecute+0×36
fffffa60`296b2390 fffff960`0009022a win32k!itrp_CALL+0×26f
fffffa60`296b2400 fffff960`0009a6e3 win32k!itrp_InnerExecute+0×36
fffffa60`296b2430 fffff960`00099720 win32k!itrp_Execute+0×384
fffffa60`296b2540 fffff960`0009968e win32k!itrp_ExecutePrePgm+0×78
fffffa60`296b2590 fffff960`00096da6 win32k!fsg_RunPreProgram+0×222
fffffa60`296b25e0 fffff960`00096af4 win32k!fs__Contour+0×256
fffffa60`296b26a0 fffff960`0009796c win32k!bGetGlyphOutline+0×125
fffffa60`296b26d0 fffff960`000978d8 win32k!lGetGlyphBitmap+0×4c
fffffa60`296b2890 fffff960`0009762c win32k!ttfdQueryFontData+0×248
fffffa60`296b28e0 fffff960`0008c335 win32k!ttfdSemQueryFontData+0×7c
fffffa60`296b2940 fffff960`0008c213 win32k!PDEVOBJ::QueryFontData+0×79
fffffa60`296b29a0 fffff960`0008bf4f win32k!RFONTOBJ::bInitCache+0×15f
fffffa60`296b2a40 fffff960`00086337 win32k!RFONTOBJ::bRealizeFont+0×763
fffffa60`296b2b60 fffff960`0008aac8 win32k!RFONTOBJ::bInit+0×523
fffffa60`296b2c70 fffff960`00037597 win32k!GreGetTextMetricsW+0×48
fffffa60`296b2cb0 fffff960`00038a42 win32k!GetTextMetricsW+0×17
fffffa60`296b2d30 fffff960`00047951 win32k!GetCharDimensions+0×26
fffffa60`296b2db0 fffff960`00049aae win32k!xxxSetNCFonts+0×181
fffffa60`296b2e60 fffff960`0005be45 win32k!xxxSetWindowNCMetrics+0×3e
fffffa60`296b30e0 fffff960`000768bf win32k!xxxInitWindowStation+0xa1
fffffa60`296b3140 fffff960`00077daf win32k!xxxCreateWindowStation+0×1cf
fffffa60`296b3500 fffff800`01a69233 win32k!NtUserCreateWindowStation+0×4b3
fffffa60`296b3bb0 00000000`777b1a6a nt!KiSystemServiceCopyEnd+0×13 (TrapFrame @ fffffa60`296b3c20)
00000000`000ff338 00000000`00000000 USER32!NtUserCreateWindowStation+0xa

- Dmitry Vostokov @ DumpAnalysis.org + TraceAnalysis.org -

Free Verse (Debugging Slang, Part 12)

June 10th, 2010

Free Verse - Source code without rules, for example, [p=malloc(); free(p); free(p);] that results in all problems associated with freedom.

Examples: What an ugly free verse! A master of free verse. Please check out that free verse written a few months ago.

- Dmitry Vostokov @ DumpAnalysis.org + TraceAnalysis.org -

Freedom (Debugging Slang, Part 11)

June 10th, 2010

Freedom - Free•dom, a domain, realm, territory of memory allocation errors and bugs.

Examples: This process finally experienced the complete freedom! Never loose your freedom: it keeps you employed. “Freedom, run away … / That freedom sun / Will shine someday” (popular lyrics).

- Dmitry Vostokov @ DumpAnalysis.org + TraceAnalysis.org -

Trace Analysis Patterns (Part 25)

June 8th, 2010

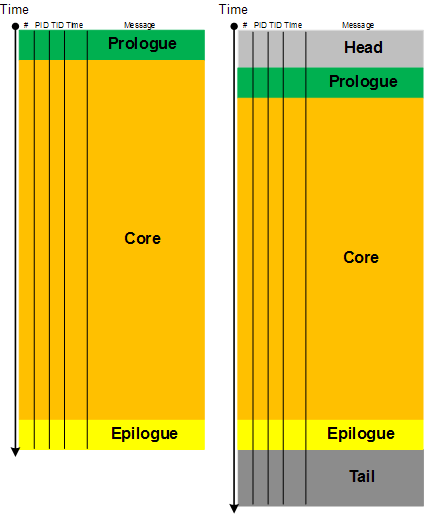
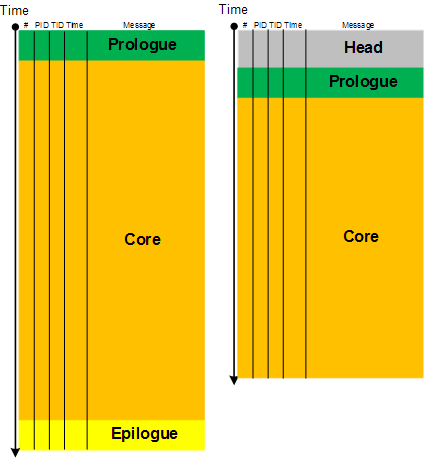
Here we introduce a software narratological partitioning of a trace into Head, Prologue, Core, Epilogue and Tail segments. This is useful for comparative software trace analysis. Suppose, a trace started just before the reproduction steps or a start marker was injected (by CDFMarker, for example) and finished just after the last repro steps or after an end marker was injected. Then its core trace messages are surrounded by prologue and epilogue statements. What is before and after are not necessary for analysis and usually distract an analyst. They are shown as grey areas on the following picture where the left trace is for working (non-working) scenario and the right trace is for non-working (working) scenario:

The size of a core segment need not be the same because environments and executed code paths might be different. However, often some traces are truncated (another pattern). Also sometimes it is difficult to establish whether the first trace is normal and the second has a tail or the first one is truncated and the second one is normal with an optional tail. Here artificial markers are important.

- Dmitry Vostokov @ DumpAnalysis.org + TraceAnalysis.org -

IRP distribution anomaly, inconsistent dump, execution residue, hardware activity, coincidental symbolic information, not my version, virtualized system: pattern cooperation

June 7th, 2010

It was reported that a system had an abnormally high number of interrupt activity visible in various monitoring tools. A complete memory dump was collected. When we open it and look at an IRP list we find statistically higher number of IRPs belonging to Disk and DriverA device drivers:

0: kd> !irpfind
Irp [ Thread ] irpStack: (Mj,Mn) DevObj [Driver] MDL Process
[…]
8a3d3008 [8b56cb10] irpStack: ( 4,34) 8b1b8030 [ \Driver\Disk] 0×00000000
8a3d3340 [8acab888] irpStack: ( 3, 0) 8b4c6030 [ \FileSystem\Npfs]
8a3d4580 [8b56cb10] irpStack: ( 4,34) 8b1b8030 [ \Driver\Disk] 0×00000000
8a403e00 [8b56cb10] irpStack: ( 4,34) 8b1b8030 [ \Driver\Disk] 0×00000000
8a4047e0 [8b56cb10] irpStack: ( 4,34) 8b1b8030 [ \Driver\Disk] 0×00000000
[…]
8aa6ab28 [00000000] irpStack: ( f, 0) 8b192030 [ \Driver\DriverA] 0×00000000
8aa6ce28 [00000000] irpStack: ( f, 0) 8b192030 [ \Driver\DriverA] 0×00000000
[…]

What we also notice is that the thread 8b56cb10 is also an active running thread so we look at its raw stack to find any executon residue providing hints to possible hardware activity.

0: kd> !stacks
Proc.Thread  .Thread  Ticks   ThreadState Blocker
                            [8b57f7a8 System]
   4.000070  8b579db0 ffffff42 Blocked    +0x1
   4.0000c0  8b5768d0 ffffff42 READY      nt!KiAdjustQuantumThread+0x109
   4.0000e4  8b56cb10 ffffff42 RUNNING    +0xf6fb2044
[…]

0: kd> !thread 8b56cb10
THREAD 8b56cb10  Cid 0004.00e4  Teb: 00000000 Win32Thread: 00000000 RUNNING on processor 0
Not impersonating
DeviceMap                 e10018b8
Owning Process            8b57f7a8       Image:         System
Attached Process          N/A            Image:         N/A
Wait Start TickCount      24437735    
Context Switch Count      33644            
UserTime                  00:00:00.000
KernelTime                00:00:07.843
Start Address nt!MiMappedPageWriter (0x80847ffe)
Stack Init f70c4000 Current f70c3468 Base f70c4000 Limit f70c1000 Call 0
Priority 17 BasePriority 8 PriorityDecrement 0
ChildEBP RetAddr  Args to Child             
f70c3470 00000000 000000be e1912bc0 e1912bc4 0xf6fb2044

However, WinDbg reports another current thread running on the same processor so we obviously have an inconsistent dump and should exercise caution:

0: kd> !thread
THREAD 8089d8c0  Cid 0000.0000  Teb: 00000000 Win32Thread: 00000000 RUNNING on processor 0
Not impersonating
Owning Process            8089db40       Image:         Idle
Attached Process          N/A            Image:         N/A
Wait Start TickCount      24437476       Ticks: 69 (0:00:00:01.078)
Context Switch Count      72194391            
UserTime                  00:00:00.000
KernelTime                4 Days 08:57:56.171
Stack Init 8089a8b0 Current 8089a5fc Base 8089a8b0 Limit 808978b0 Call 0
Priority 0 BasePriority 0 PriorityDecrement 0
ChildEBP RetAddr  Args to Child             
f3b30c5c 00000000 00000000 00000000 00000000 LiveKdD+0×1c07

0: kd> !running
[...]
Prcbs  Current   Next   
  0    ffdff120  8089d8c0            …………….
  1    f772f120  f7732090            …………….

0: kd> !thread f7732090
THREAD f7732090  Cid 0000.0000  Teb: 00000000 Win32Thread: 00000000 RUNNING on processor 1
Not impersonating
Owning Process            8089db40       Image:         Idle
Attached Process          N/A            Image:         N/A
Wait Start TickCount      0              Ticks: 24437545 (4:10:03:56.640)
Context Switch Count      75624870            
UserTime                  00:00:00.000
KernelTime                4 Days 08:56:05.125
Stack Init f78b3000 Current f78b2d4c Base f78b3000 Limit f78b0000 Call 0
Priority 0 BasePriority 0 PriorityDecrement 0
ChildEBP RetAddr  Args to Child             
f3b30c5c 00000000 00000000 00000000 00000000 LiveKdD+0×1c07

Let’s come back to the thread 8b56cb10. Its raw stack residue shows traces of SCSI activity:

0: kd> dps f70c1000 f70c4000
[...]
f70c2f38  8b20100c
f70c2f3c  f70c2f9c
f70c2f40  f72922a5 DriverA!BuildScatterGather+0×9b
f70c2f44  8b20100c
f70c2f48  8aa24dfc
[…]
f70c337c  00000000
f70c3380  00000246
f70c3384  808a6228 nt!KiProcessorBlock+0×8
f70c3388  00000002
f70c338c  00000011
f70c3390  00000246
f70c3394  f70c33a4
f70c3398  80a62a73 hal!HalRequestIpi+0×13
f70c339c  00000002
f70c33a0  000000e1
f70c33a4  f70c33dc
f70c33a8  8082e4db nt!KiIpiSend+0×27
f70c33ac  00000002
f70c33b0  f772fa7c
f70c33b4  8b56bdb0
f70c33b8  ffdff120
f70c33bc  00000000
f70c33c0  00000002
f70c33c4  00000001
f70c33c8  00000000
f70c33cc  00000002
f70c33d0  00000002
f70c33d4  f70c33e4
f70c33d8  80a61456 hal!KfLowerIrql+0×62
f70c33dc  00000001
f70c33e0  00000002
f70c33e4  f70c3494
f70c33e8  f70c3450
f70c33ec  8b56cb10
f70c33f0  8b089100
f70c33f4  8a5abe01
f70c33f8  f70c3450
f70c33fc  8b089100
f70c3400  8a5abe01
f70c3404  8b089101
f70c3408  f70c3418
f70c340c  80a61456 hal!KfLowerIrql+0×62
f70c3410  8a5abe98
f70c3414  8b089101
f70c3418  f70c3450
f70c341c  f70c3434
f70c3420  80819c10 nt!FsFilterPerformCompletionCallbacks+0×2e
f70c3424  f70c3450
f70c3428  00000000
f70c342c  00000000
f70c3430  00000000
f70c3434  f70c3584
f70c3438  f70c3584
f70c343c  80815040 nt!FsRtlReleaseFileForModWrite+0×190
f70c3440  f70c3450
f70c3444  8b56cdc4
f70c3448  00010000
f70c344c  8b56cd68
f70c3450  00000024
f70c3454  8b56cbfc
f70c3458  8abe10f0
f70c345c  8a5b4830
f70c3460  8b089100
f70c3464  80a613f4 hal!KfLowerIrql
f70c3468  00000001
f70c346c  00000246
f70c3470  f6fb2044
f70c3474  00000000
f70c3478  000000be
f70c347c  e1912bc0
f70c3480  e1912bc4
f70c3484  8a4b7db8
f70c3488  00000011
f70c348c  f70c34a4
f70c3490  8081610e nt!FsRtlLookupBaseMcbEntry+0×16
f70c3494  80887b75 nt!KiFlushTargetSingleTb+0xd
f70c3498  f70c34d0
f70c349c  8082e431 nt!KiIpiServiceRoutine+0×4d
f70c34a0  f772f121
f70c34a4  00000000
f70c34a8  e2894000
f70c34ac  00000000
f70c34b0  80872322 nt!WRITE_REGISTER_ULONG+0xa
f70c34b4  8b20100c
f70c34b8  80a6157e hal!HalEndSystemInterrupt+0×6e
f70c34bc  8b20100c
f70c34c0  f70c34d0
f70c34c4  80a5e902 hal!HalpIpiHandler+0xd2
f70c34c8  80816209 nt!FsRtlLookupLargeMcbEntry+0×4d
f70c34cc  000000e1
f70c34d0  f70c3564
f70c34d4  80872322 nt!WRITE_REGISTER_ULONG+0xa
f70c34d8  badb0d00
f70c34dc  f6fb2040
f70c34e0  8b20100c
f70c34e4  8b038fb4
f70c34e8  0000f000
f70c34ec  f70c3510
f70c34f0  8b377e10
f70c34f4  8b20100c
f70c34f8  8b038fb4
f70c34fc  00000000
f70c3500  00000000
f70c3504  8b377e64
f70c3508  00000007
f70c350c  f6fb2040
f70c3510  8b201100
f70c3514  0b377e10
f70c3518  00000005
f70c351c  ffdff120
f70c3520  ffdffa40
f70c3524  8b4eca09
f70c3528  8b20100c
f70c352c  ffdffa40
f70c3530  8b4eca09
f70c3534  ffdffa09
f70c3538  f70c3548
f70c353c  80a61456 hal!KfLowerIrql+0×62
f70c3540  8b4ecab4
f70c3544  ffdffa09
f70c3548  f70c356c
f70c354c  80829f70 nt!KeInsertQueueDpc+0×1c4
f70c3550  8b4ecaf8
f70c3554  8b038fb4
f70c3558  8b192001
f70c355c  ffdffa48
f70c3560  ffdff120
f70c3564  00000000
f70c3568  01092855
f70c356c  f70c3580
f70c3570  f727221d SCSIPORT!SpRequestCompletionDpc+0×2d
f70c3574  014ecab4
f70c3578  8b4ecab8
f70c357c  8b4ecaf8
f70c3580  8b4ecbf8
f70c3584  00000102
f70c3588  8b4eca40
f70c358c  8b4ecaf8
f70c3590  8b4ecbf8
f70c3594  8b038f02
f70c3598  f70c35a8
f70c359c  8b4ecbf8
f70c35a0  8b038f02
f70c35a4  8b4ecb02
f70c35a8  f70c35b8
f70c35ac  80a61456 hal!KfLowerIrql+0×62
f70c35b0  8b038f02
f70c35b4  8b4ecb02
f70c35b8  f70c35d8
f70c35bc  80a5f44b hal!KfReleaseSpinLock+0xb
f70c35c0  f72737ae SCSIPORT!SpReceiveScatterGather+0×33b
f70c35c4  8b56bb94
f70c35c8  00000000
f70c35cc  0cd8e000
f70c35d0  0000000f
f70c35d4  0000000f
f70c35d8  f70c3604
f70c35dc  80a60147 hal!HalBuildScatterGatherList+0×1c7
f70c35e0  8b4eca40
f70c35e4  8a5acd20
f70c35e8  8ab7aa98
f70c35ec  8ab7aa30
f70c35f0  8a5acd20
f70c35f4  8b4ecaf8
f70c35f8  8b038fb4
f70c35fc  00804001
f70c3600  00000000
f70c3604  f70c3650
f70c3608  f72733a6 SCSIPORT!ScsiPortStartIo+0×36a
f70c360c  8ab7aa98
f70c3610  8b4eca40
f70c3614  8b56bb38
f70c3618  00000000
f70c361c  00010000
f70c3620  f72736b4 SCSIPORT!SpReceiveScatterGather
f70c3624  8ab7aa30
f70c3628  00000000
f70c362c  8b4eca40
f70c3630  8a5acd20
f70c3634  00000002
f70c3638  8b4eca40
f70c363c  f70c39e0
f70c3640  f70c3658
f70c3644  00000000
f70c3648  80a611ae hal!HalpDispatchSoftwareInterrupt+0×5e
f70c364c  00000000
f70c3650  8a5acd00
f70c3654  00000202
f70c3658  f70c3674
f70c365c  80a613d9 hal!HalpCheckForSoftwareInterrupt+0×81
f70c3660  8b4ecb02
f70c3664  00000000
f70c3668  8b1920e8
f70c366c  8a5acd00
f70c3670  8b4ecb02
f70c3674  f70c3684
f70c3678  80a61456 hal!KfLowerIrql+0×62
f70c367c  8a5acd20
f70c3680  8b4ecb00
f70c3684  f70c36a8
f70c3688  f7273638 SCSIPORT!ScsiPortFdoDispatch+0×279
f70c368c  8b4ecaf8
f70c3690  8b41a228
f70c3694  8a5acd20
f70c3698  f70c36d0
f70c369c  f70c36ac
f70c36a0  8ab7aa30
f70c36a4  8b1920e8
f70c36a8  f70c36c4
f70c36ac  f7273146 SCSIPORT!SpDispatchRequest+0×68
f70c36b0  8b4eca40
f70c36b4  005acdb4
f70c36b8  8b038fb4
f70c36bc  8b1920e8
f70c36c0  8a5acd20
f70c36c4  f70c36e0
f70c36c8  f7272dc3 SCSIPORT!ScsiPortPdoScsi+0×129
f70c36cc  8b1920e8
f70c36d0  8a5acd20
f70c36d4  8a581008
f70c36d8  8a5acd20
f70c36dc  8b192030
f70c36e0  f70c36f4
f70c36e4  f7272299 SCSIPORT!ScsiPortGlobalDispatch+0×1d
f70c36e8  8b192030
f70c36ec  8a5acd20
f70c36f0  8b5441c8
f70c36f4  f70c3708
f70c36f8  8081df85 nt!IofCallDriver+0×45
f70c36fc  8b192030
f70c3700  8a5acd20
f70c3704  8b038f08
f70c3708  f70c3718
f70c370c  f725f607 CLASSPNP!SubmitTransferPacket+0xbb
f70c3710  8b038f08
f70c3714  00000000
f70c3718  f70c374c
f70c371c  f725f2b2 CLASSPNP!ServiceTransferRequest+0×1e4
f70c3720  8b038f08
f70c3724  8b1b80e8
f70c3728  8a581150
f70c372c  8a581008
f70c3730  24052000
f70c3734  00000001
f70c3738  00000001
f70c373c  00011000
f70c3740  00010000
f70c3744  00000000
f70c3748  00000001
f70c374c  f70c3770
f70c3750  f725f533 CLASSPNP!ClassReadWrite+0×159
f70c3754  00000103
f70c3758  00000000
f70c375c  8a581008
f70c3760  8b57e218
f70c3764  8b055790
f70c3768  8b192030
f70c376c  00010000
f70c3770  f70c3784
f70c3774  8081df85 nt!IofCallDriver+0×45
f70c3778  8b1b8030
f70c377c  00000103
f70c3780  8b51d1c8
f70c3784  f70c3794
f70c3788  f74c80cf PartMgr!PmReadWrite+0×95
f70c378c  8b467e00
f70c3790  8a581174
f70c3794  f70c37a8
f70c3798  8081df85 nt!IofCallDriver+0×45
f70c379c  8b0556d8
f70c37a0  8a581008
f70c37a4  8a581198
f70c37a8  f70c37c4
f70c37ac  f7317053 ftdisk!FtDiskReadWrite+0×1a9
f70c37b0  8a5811b4
f70c37b4  8b5570c8
f70c37b8  8b201c40
f70c37bc  24032000
f70c37c0  8b467d48
f70c37c4  f70c37d8
f70c37c8  8081df85 nt!IofCallDriver+0×45
f70c37cc  8b467d48
f70c37d0  8a581008
f70c37d4  8a5811d8
f70c37d8  f70c37f8
f70c37dc  f72c0537 volsnap!VolSnapWrite+0×46f
f70c37e0  8a581008
f70c37e4  8b5851c8
f70c37e8  e25b3668
f70c37ec  fd800000
f70c37f0  8b201c40
f70c37f4  00000002
f70c37f8  f70c380c
f70c37fc  8081df85 nt!IofCallDriver+0×45
f70c3800  8b201b88
f70c3804  8a581008
[…]

There’s past DPC insertion activity but no pending DPCs:

0: kd> ub 80829f70
nt!KeInsertQueueDpc+0x1a9:
80829f55 6a02            push    2
80829f57 5a              pop     edx
80829f58 e857450000      call    nt!KiIpiSend (8082e4b4)
80829f5d eb08            jmp     nt!KeInsertQueueDpc+0x1bb (80829f67)
80829f5f b102            mov     cl,2
80829f61 ff1598108080    call    dword ptr [nt!_imp_HalRequestSoftwareInterrupt (80801098)]
80829f67 8a4dfe          mov     cl,byte ptr [ebp-2]
80829f6a ff1508118080    call    dword ptr [nt!_imp_KfLowerIrql (80801108)]

0: kd> !dpcs
CPU Type      KDPC       Function

dpcs: no pending DPCs found

We notice DriverA and see it also attached to Disk driver device:

0: kd> !irp 8a3d3008
Irp is active with 11 stacks 7 is current (= 0x8a3d3150)
 Mdl=8b56b6a0: No System Buffer: Thread 8b56cb10:  Irp stack trace. 
     cmd  flg cl Device   File     Completion-Context
 [  0, 0]   0  0 00000000 00000000 00000000-00000000   
   Args: 00000000 00000000 00000000 00000000
 [  0, 0]   0  0 00000000 00000000 00000000-00000000   
   Args: 00000000 00000000 00000000 00000000
 [  0, 0]   0  0 00000000 00000000 00000000-00000000   
   Args: 00000000 00000000 00000000 00000000
 [  0, 0]   0  0 00000000 00000000 00000000-00000000   
   Args: 00000000 00000000 00000000 00000000
 [  0, 0]   0  0 00000000 00000000 00000000-00000000   
   Args: 00000000 00000000 00000000 00000000
 [  0, 0]   0  0 00000000 00000000 00000000-00000000   
   Args: 00000000 00000000 00000000 00000000
>[  4,34]   0 e0 8b1b8030 00000000 f74c857e-8b0556d8 Success Error Cancel
        \Driver\Disk PartMgr!PmIoCompletion
   Args: 00010000 00000000 f457e000 00000002
 [  4, 0]   0 e1 8b0556d8 00000000 f7316558-8b467e00 Success Error Cancel pending
        \Driver\PartMgr ftdisk!FtpRefCountCompletionRoutine
   Args: 7274c6df 0002b74c f457e000 00000002
 [  4, 0]   0 e1 8b467d48 00000000 f72bf638-8b201c40 Success Error Cancel pending
        \Driver\Ftdisk volsnap!VspRefCountCompletionRoutine
   Args: 7274c5f4 0002b74c f456e000 00000002
 [  4, 0]   0 e1 8b201b88 00000000 f71814e8-8b206238 Success Error Cancel pending
        \Driver\VolSnap Ntfs!NtfsSingleAsyncCompletionRoutine
   Args: 00010000 00000000 f456e000 00000002
 [  4, 0]   0  0 8b36b020 8a5b4830 00000000-00000000   
        \FileSystem\Ntfs
   Args: 00010000 00000000 08710000 00000000

0: kd> !devobj 8b1b8030
Device object (8b1b8030) is for:
 DR0 \Driver\Disk DriverObject 8b57e218
Current Irp 00000000 RefCount 0 Type 00000007 Flags 00000050
Vpb 8b52f080 Dacl e13e397c DevExt 8b1b80e8 DevObjExt 8b1b8548 Dope 8b467828
ExtensionFlags (0000000000) 
AttachedDevice (Upper) 8b0556d8 \Driver\PartMgr
AttachedTo (Lower) 8b192030 \Driver\DriverA
Device queue is not busy.

0: kd> !devstack 8b1b8030
  !DevObj   !DrvObj            !DevExt   ObjectName
  8b0556d8  \Driver\PartMgr    8b055790 
> 8b1b8030  \Driver\Disk       8b1b80e8  DR0
  8b192030  \Driver\DriverA    8b1920e8  DriverA1Port1Path0Target0Lun0
!DevNode 8b56f5d0 :
  DeviceInst is “SCSI\Disk&Ven_A&Prod_Virtual_disk&Rev_1.0\4&1588251b&0&000″
  ServiceName is “disk” 

Additionally we look at raw stack data of running threads 8089d8c0 and f7732090. We find the same hardware activity there and plus some network driver activity too. We also see “double fault” symbols:

[...]
8089a554 ffdffec0
8089a558 80a6157e hal!HalEndSystemInterrupt+0x6e
8089a55c ffdffec0
8089a560 8089a570 nt!KiDoubleFaultStack+0×2cc0
8089a564 80a5e902 hal!HalpIpiHandler+0xd2
8089a568 00000002
8089a56c 000000e1
8089a570 8089a600 nt!KiDoubleFaultStack+0×2d50
8089a574 f7549ca2 intelppm!AcpiC1Idle+0×12
8089a578 badb0d00
8089a57c 0002b74b
8089a580 00000000
8089a584 f7298da0 DriverA!DevScsiTimer
8089a588 00000000
8089a58c 00000000
8089a590 0005d373
8089a594 00000000
8089a598 8b4ecaf8
8089a59c 00000000
8089a5a0 8a4b1e20
8089a5a4 00000000
8089a5a8 8089a600 nt!KiDoubleFaultStack+0×2d50
8089a5ac 0002b74b
8089a5b0 ffdffee0
[…]

But they seem to be coincidental:

0: kd> ub 8089a570
^ Unable to find valid previous instruction for 'ub 8089a570'

0: kd> u 8089a570
nt!KiDoubleFaultStack+0x2cc0:
8089a570 00a68980a29c add byte ptr [esi-635D7F77h],ah
8089a576 54 push esp
8089a577 f7000ddbba4b test dword ptr [eax],4BBADB0Dh
8089a57d b702 mov bh,2
8089a57f 0000 add byte ptr [eax],al
8089a581 0000 add byte ptr [eax],al
8089a583 00a08d29f700 add byte ptr [eax+0F7298Dh],ah
8089a589 0000 add byte ptr [eax],al

0: kd> ub 8089a600
                 ^ Unable to find valid previous instruction for 'ub 8089a600'

0: kd> u 8089a600
nt!KiDoubleFaultStack+0x2d50:
8089a600 0100            add     dword ptr [eax],eax
8089a602 0000            add     byte ptr [eax],al
8089a604 ebde            jmp     nt!KiDoubleFaultStack+0x2d34 (8089a5e4)
8089a606 888000000000    mov     byte ptr [eax],al
8089a60c 0e              push    cs
8089a60d 0000            add     byte ptr [eax],al
8089a60f 0000            add     byte ptr [eax],al
8089a611 0000            add     byte ptr [eax],al 

We find the system virtualized:

0: kd> !sysinfo machineid
[...]
SystemManufacturer = Virtualization Vendor A
[...]

Looking at DriverA timestamp we notice it is much older than expected and Google search points to similar cases (but not for virtualized systems) where it was recommended to update that driver.

- Dmitry Vostokov @ DumpAnalysis.org + TraceAnalysis.org -

Crash Dump Analysis AntiPatterns (Part 14)

June 4th, 2010

An exercise in de-analysis

This anti-pattern is called Wild Explanation. This is a free floating explanation based on loose associations. Its extreme version uses Gödel incompleteness theorems (undecidable crashes and hangs), quantum mechanics (in small time delta any bug can appear and disappear without being caught) or hydrodynamics (code fluidity, turbulence around processor cores) for abnormal software behaviour explanation (similar to Fashionable Nonsense in philosophy, humanities and social sciences). Its milder version is slightly modified original analysis monologue I found when searching Google for stack traces (I provide my comments below):

“Two hints make me assume this can be a physical memory problem:”

PAGE_FAULT_IN_NONPAGED_AREA (50)
Invalid system memory was referenced.  This cannot be protected by try-except,
it must be protected by a Probe.  Typically the address is just plain bad or it
is pointing at freed memory.
Arguments:
Arg1: e37cc20e, memory referenced.
Arg2: 00000001, value 0 = read operation, 1 = write operation.
Arg3: 8083fe2c, If non-zero, the instruction address which referenced the bad memory
     address.
Arg4: 00000000, (reserved)

EXCEPTION_CODE: (NTSTATUS) 0xc0000005 - The instruction at “0x%08lx” referenced memory at “0x%08lx”. The memory could not be “%s”.

I wouldn’t be so quick. Check Hardware Error pattern post and comments there. So let’s de-analyze the analysis.

“c0000005 is Access Denied where C is virtual memory, meaning usually disk cache”

c is just STATUS_SEVERITY_ERROR (0×3 or 0y11) 11000000000000000000000000000101 and doesn’t have any connection to cache or crash beyond a mere coincidence. See NTSTATUS bit descriptions: http://msdn.microsoft.com/en-us/library/cc231200(PROT.10).aspx

“It could be RAM and/or it could be savrt.sys if you’re using something like an antivirus.
Check to see if you need updates for them, Norton, Symantec, McCaffee.”

Of course, it is either RAM or antivirus, what else? What about a virus? All household names.

EXCEPTION_CODE: (NTSTATUS) 0xc0000005 - The instruction at “0x%08lx” referenced memory at “0x%08lx”.  ”The memory could not be “%s”.” means there is something wrong with the debugger itself; those should be addresses, not percent signs and alphanumeric garbage.”

Now even a debugger is corrupt. RAM again? It is not a garbage, they’re format codes (like for printf C function) to print actual addresses.

“8083fe2c” this address called a pointer, that referenced “e37cc20e” again, that “e” has specific meaning, some virtual device or another, probably CD ROM, trying to transfer data to RAM.  This implies either SCSI or PCI buss or DMA buss timing problems.”

RAM again… Evidence mounts stronger and stronger. Its all about timing. A bus buzzes.

“Which is usually caused by a bad driver, not RAM, but sometimes replacing the RAM “masks” out the failure.”

You never know… A bit of doubt?

“This normally happens with 64-bit machines that take advantage of the 64-bit superfast address access and indexing, known as Vector Indirect Addressing, which is, apparently, too fast for even recent Operating System code.”

I always suspected these machines run x64 times faster… I can only imagine horrors when Vector Indirect Addressing hits an old Operating System code. However, the crash under discussion is x86…

“A write to the “e” device; so, is it some kind of CDR or DVDR or other storage device?”

I guess that was a rhetorical question… or let me finish this thread of thought to connect dots, e-devices, virtual memory, disk cache and CD ROM. What if a page file was configured on a DVD-R?

- Dmitry Vostokov @ DumpAnalysis.org + TraceAnalysis.org -

Icons for Memory Dump Analysis Patterns (Part 46)

June 4th, 2010

Today we introduce an icon for Stack Trace Collection pattern:

B/W

Color

- Dmitry Vostokov @ DumpAnalysis.org + TraceAnalysis.org -

Succession of Patterns (Part 2)

June 3rd, 2010

Now I resume previously introduced memory analysis succession patterns post series. In this part I introduce a case study where Wait Chains (executive resources) and Swarm of Shared Locks were probably resulted from a Spiking Thread. We have these resource locks:

0: kd> !locks
**** DUMP OF ALL RESOURCE OBJECTS ****

Resource @ 0x808a6860    Shared 9 owning threads
     Threads: 8e739b40-01<*> 8e07db58-01<*> 8e455d18-01<*> 8df72958-01<*>
              8e356620-01<*> 8d7e9700-01<*> 8e73a660-01<*> 8dbb0af0-01<*>
              8e01c9b8-01<*>

Resource @ 0xf7b6d5b0    Shared 2 owning threads
    Contention Count = 1
     Threads: 8e741898-01<*> 8e73fb40-01<*>

Resource @ 0x8e5a1534    Shared 12 owning threads
    Contention Count = 76
    NumberOfSharedWaiters = 7
    NumberOfExclusiveWaiters = 1
     Threads: 8e73fb40-01    8d80fc70-01<*> 8dc226c0-01<*> 8dc84db0-01<*>
              8e416458-01<*> 8dbf1630-01<*> 8e740db0-01<*> 8d7e9700-01<*>
              8d818420-01<*> 8e7413b8-01<*> 8e739020-01    8d80ac70-01<*>
              8e30ec88-01<*> 8e7408d0-01    8dd022a8-01    8e59a2f8-01   
              8dc4d300-01    8dc36278-01<*> 8e060078-01   
     Threads Waiting On Exclusive Access:
              8d818870

Resource @ 0x8e5a1368    Shared 3 owning threads
    Contention Count = 132
    NumberOfExclusiveWaiters = 9
     Threads: 8d7c5370-01<*> 8e416458-01<*> 8e72f480-01<*>
     Threads Waiting On Exclusive Access:
              8d7e9700       8d80ac70       8e741b08       8dc84db0      
              8df72958       8e73e8d0       8dbe0388       8e7413b8      
              8e741898      

Resource @ 0x8e74a3b0    Exclusively owned
    Contention Count = 11
    NumberOfSharedWaiters = 2
    NumberOfExclusiveWaiters = 1
     Threads: 8dbe0388-01<*> 8e73e660-01    8e740020-01   
     Threads Waiting On Exclusive Access:
              8d80fc70      

Resource @ 0x8e54f810    Exclusively owned
    Contention Count = 118
    NumberOfSharedWaiters = 1
    NumberOfExclusiveWaiters = 2
     Threads: 8e72f480-01<*> 8e73f8d0-01   
     Threads Waiting On Exclusive Access:
              8d7c5370       8e416458      

Resource @ 0x8e6db008    Shared 1 owning threads
     Threads: 8e73f8d0-01<*>

Resource @ 0x8e75e3c0    Exclusively owned
     Threads: 8d7e9700-01<*>

Resource @ 0x8e6f14b0    Exclusively owned
    Contention Count = 7
    NumberOfSharedWaiters = 2
     Threads: 8d80fc70-01<*> 8dbf1630-01    8e73f3f0-01   

Resource @ 0x8e707618    Exclusively owned
     Threads: 8dc84db0-01<*>

Resource @ 0x8e6c1780    Shared 1 owning threads
    Contention Count = 3
    NumberOfSharedWaiters = 1
    NumberOfExclusiveWaiters = 1
     Threads: 8e741b08-01<*> 8e73fdb0-01   
     Threads Waiting On Exclusive Access:
              8dc36278      

Resource @ 0x8e1fa370    Exclusively owned
     Threads: 8df72958-01<*>

Resource @ 0x8e290b38    Exclusively owned
     Threads: 8df72958-01<*>

Resource @ 0x8e692be0    Shared 1 owning threads
    Contention Count = 12
     Threads: 8df72958-01<*>

Resource @ 0x8e3a03e0    Exclusively owned
    Contention Count = 4
    NumberOfSharedWaiters = 1
    NumberOfExclusiveWaiters = 1
     Threads: 8dbe0388-01<*> 8e740660-01   
     Threads Waiting On Exclusive Access:
              8e30ec88      

Resource @ 0x8e33d6a8    Exclusively owned
    Contention Count = 1
     Threads: 8dc36278-01<*>

Resource @ 0x8e33d640    Exclusively owned
    Contention Count = 1
     Threads: 8dc36278-01<*>

Resource @ 0x8e17f890    Exclusively owned
    Contention Count = 2
    NumberOfExclusiveWaiters = 1
     Threads: 8dc84db0-01<*>
     Threads Waiting On Exclusive Access:
              8e740db0      

Resource @ 0x8e17f828    Exclusively owned
     Threads: 8dc84db0-01<*>

Resource @ 0x8e09fc40    Exclusively owned
    Contention Count = 3
    NumberOfSharedWaiters = 2
     Threads: 8e416458-01<*> 8e076770-01    8dbf5b70-01   

Resource @ 0x8e09fbd8    Exclusively owned
     Threads: 8e416458-01<*>

Resource @ 0x8df021a0    Exclusively owned
     Threads: 8d7e9700-01<*>

Resource @ 0x8dffce50    Exclusively owned
    Contention Count = 2
    NumberOfExclusiveWaiters = 1
     Threads: 8dbf1630-01<*>
     Threads Waiting On Exclusive Access:
              8dc226c0      

Resource @ 0x8df147f8    Exclusively owned
    Contention Count = 4
    NumberOfSharedWaiters = 1
     Threads: 8dbf1630-01<*> 8e7403f0-01   

Resource @ 0x8e599de8    Exclusively owned
     Threads: 8d7c5370-01<*>

Resource @ 0x8e324ee8    Shared 1 owning threads
    Contention Count = 1
     Threads: 8d7c5370-01<*>

Resource @ 0x8e21bc60    Exclusively owned
     Threads: 8dbe0388-01<*>

Resource @ 0x8e446f18    Exclusively owned
     Threads: 8d80fc70-01<*>

Resource @ 0x8df65570    Shared 1 owning threads
    Contention Count = 3
     Threads: 8dc5f698-01<*>

Resource @ 0x8e085100    Exclusively owned
    Contention Count = 1
     Threads: 8e73e8d0-01<*>

Resource @ 0x8dbe51b8    Exclusively owned
     Threads: 8dbe0388-01<*>

Resource @ 0x8df458c8    Exclusively owned
    Contention Count = 1
    NumberOfExclusiveWaiters = 1
     Threads: 8d80ac70-01<*>
     Threads Waiting On Exclusive Access:
              8d818420      

Resource @ 0x8dfb9168    Shared 2 owning threads
     Threads: 8e7413b8-01<*> 8d862630-01<*>

Resource @ 0x8dfb9128    Exclusively owned
    Contention Count = 1
     Threads: 8e7413b8-01<*>

Resource @ 0x8df86150    Shared 1 owning threads
     Threads: 8dba25d8-01<*>

Resource @ 0x8df86110    Exclusively owned
     Threads: 8e741b08-01<*>

Resource @ 0x8e3f17d0    Shared 1 owning threads
     Threads: 8dc84db0-01<*>

Resource @ 0x8dc9c008    Exclusively owned
     Threads: 8e72f480-01<*>

Resource @ 0x8dc9c1a8    Shared 1 owning threads
     Threads: 8e72f480-01<*>

Resource @ 0x8e3ec7a0    Shared 1 owning threads
     Threads: 8e7413b8-01<*>

Resource @ 0x8d85a218    Exclusively owned
     Threads: 8d80fc70-01<*>

Resource @ 0x8e2d1988    Shared 1 owning threads
     Threads: 8d7c5370-01<*>

Resource @ 0x8e3f1ac0    Shared 1 owning threads
     Threads: 8e416458-01<*>

Resource @ 0x8dc11798    Exclusively owned
    Contention Count = 1
     Threads: 8e73f8d0-01<*>

Resource @ 0x8dc93298    Exclusively owned
     Threads: 8e73f8d0-01<*>

Resource @ 0x8e2bb198    Shared 1 owning threads
    Contention Count = 1
     Threads: 8d80ac70-01<*>

Resource @ 0x8e06e6f8    Shared 1 owning threads
     Threads: 8e72f480-01<*>

4346 total locks, 47 locks currently held

We don’t see High Contention (executive resources) pattern. What we actually see is a runaway system thread:

0: kd> !running

System Processors f (affinity mask)
  Idle Processors d

Prcbs  Current   Next   
  1    f772f120  8e72f480            …………….

0: kd> !thread 8e72f480
THREAD 8e72f480  Cid 0004.00e4  Teb: 00000000 Win32Thread: 00000000 RUNNING on processor 1
Not impersonating
DeviceMap                 d66018c0
Owning Process            8e7437a8       Image:         System
Attached Process          N/A            Image:         N/A
Wait Start TickCount      78418          Ticks: 919192 (0:03:59:22.375)
Context Switch Count      240            
UserTime                  00:00:00.000
KernelTime                03:59:29.203
Start Address 0×80848dbc
Stack Init b2f94000 Current b2f93584 Base b2f94000 Limit b2f91000 Call 0
Priority 17 BasePriority 8 PriorityDecrement 0
ChildEBP RetAddr  Args to Child             
[..]
b2f93a14 f7b4dae0 8d802108 d78220d0 b2f93be8 ModuleA!bar+0×2a0
b2f93c14 f7b527d0 8d802108 8e28d218 8e574860 ModuleA!foo+0×1e27
[…]
b2f93ddc 8088fa7e 80848dbc 00000000 00000000 nt!PspSystemThreadStartup+0×2e
00000000 00000000 00000000 00000000 00000000 nt!KiThreadStartup+0×16

I highlighted in red this thread in the output of !locks command above. Many wait chains terminate at this thread (an example one is highlighted in blue above, 8d818870 -> 8d80fc70 -> 8dbe0388 -> 8e72f480). Stack trace collection shows ModuleA on top of stack traces of many threads (!stacks 0 ModuleA! filter command) but I don’t include its output here.

- Dmitry Vostokov @ DumpAnalysis.org + TraceAnalysis.org -

Ana-Trace-Log-Lyzer and Closed Session

June 2nd, 2010

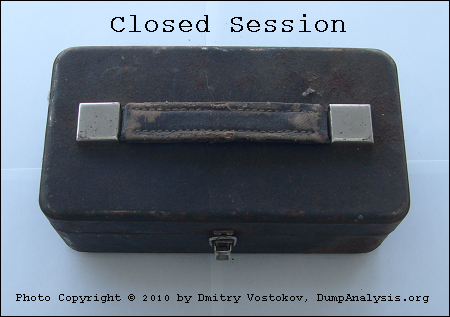
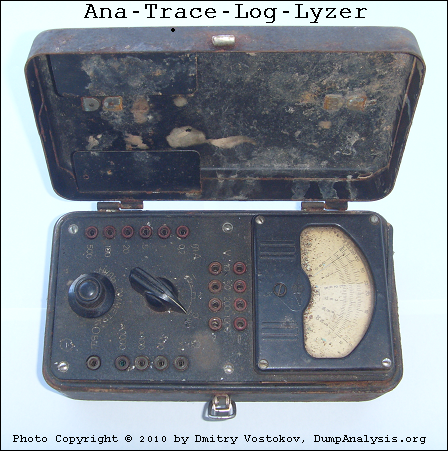
This paleodebugging tool was excavated from Central Russia (thanks to Mr. Kutuzov) and generously provided for a photo session by its owner Mr. Mansour:


It also inspired this sequence of strcat: Analog -> Anatrace -> Analyzer -> Tracelyzer -> Loglyzer.

… enough tracing. It’s time to close our session:

… what is left? If you are curious, look at this conceptual picture:

Component Trace

If you wonder what electricity has to do with tracing (at a metaphorical level) look at this trace analysis pattern:

Statement Density and Current

- Dmitry Vostokov @ DumpAnalysis.org + TraceAnalysis.org -

Trace Analysis Patterns (Part 24)

June 2nd, 2010

The limit of Discontinuity pattern is No Activity. The absence of activity can be seen at a thread level or at a process level where it is similar to Missing Component pattern. The difference from the latter pattern is that we know for certain that we selected our process modules for tracing but don’t see any trace messages. Consider this example:

#  Source        PID  TID  Time         Function     Message
1  TraceSettings 1480 8692 08:04:20.682              **** Start Trace Session 
[... TraceSettings messages 2-11 show that we selected AppA for tracing ...]
12 ModuleB       3124 4816 08:04:37.049 WorkerThread Worker thread running
13 TraceSettings 1480 8692 08:04:41.966              **** Trace Session was stopped

Only modules from AppA process and modules from a coupled process (for example, ModuleB) were selected. However, we only see a reminder message from the coupled process (3124.4816:ModuleB!WorkerThread) and no messages for 21 seconds. Fortunately, AppA process memory dump was saved during the tracing session:

Debug session time: Fri May 21 08:04:31.000 2010 (GMT+0)

We see 2 threads waiting for a critical section:

0:000> ~*kL

  14  Id: 640.8b8 Suspend: 1 Teb: 7ffa7000 Unfrozen
ChildEBP RetAddr 
0248f8c0 7c827d29 ntdll!KiFastSystemCallRet
0248f8c4 7c83d266 ntdll!ZwWaitForSingleObject+0xc
0248f900 7c83d2b1 ntdll!RtlpWaitOnCriticalSection+0x1a3
0248f920 0040dea8 ntdll!RtlEnterCriticalSection+0xa8
[…]
0248f9a4 77ce78aa rpcrt4!Invoke+0×30
0248f9c0 77ce7a94 rpcrt4!NdrCallServerManager+0×17
0248fcb8 77ce7b7c rpcrt4!NdrStubCall+0×1d6
0248fcd0 77c7ff7a rpcrt4!NdrServerCall+0×15
0248fd04 77c8042d rpcrt4!DispatchToStubInCNoAvrf+0×38
0248fd58 77c80353 rpcrt4!RPC_INTERFACE::DispatchToStubWorker+0×11f
0248fd7c 77c7e0d4 rpcrt4!RPC_INTERFACE::DispatchToStub+0xa3
0248fdbc 77c7e080 rpcrt4!RPC_INTERFACE::DispatchToStubWithObject+0xc0
0248fdfc 77c812f0 rpcrt4!LRPC_SCALL::DealWithRequestMessage+0×41e
0248fe20 77c88678 rpcrt4!LRPC_ADDRESS::DealWithLRPCRequest+0×127
0248ff84 77c88792 rpcrt4!LRPC_ADDRESS::ReceiveLotsaCalls+0×430
0248ff8c 77c8872d rpcrt4!RecvLotsaCallsWrapper+0xd
0248ffac 77c7b110 rpcrt4!BaseCachedThreadRoutine+0×9d

  15  Id: 640.18c0 Suspend: 1 Teb: 7ffdb000 Unfrozen
ChildEBP RetAddr 
01b8ff40 7c827d29 ntdll!KiFastSystemCallRet
01b8ff44 7c83d266 ntdll!ZwWaitForSingleObject+0xc
01b8ff80 7c83d2b1 ntdll!RtlpWaitOnCriticalSection+0x1a3
01b8ffa0 0040dba7 ntdll!RtlEnterCriticalSection+0xa8
[…]
01b8ffec 00000000 kernel32!BaseThreadStart+0×34

Unfortunately it belongs to a missing thread and blocked threads wait forever:

0:000> !cs -l -o -s
-----------------------------------------
DebugInfo          = 0x01facdd0
Critical section   = 0x01da19c0 (+0x1DA19C0)
LOCKED
LockCount          = 0×2
WaiterWoken        = No
OwningThread       = 0×00001384
RecursionCount     = 0×1
LockSemaphore      = 0×578
SpinCount          = 0×00000000
ntdll!RtlpStackTraceDataBase is NULL. Probably the stack traces are not enabled

0:000> ~~[1384]
              ^ Illegal thread error in ‘~~[1384]’

Apparently AppA process was hanging and it explains why we don’t see any activity in the trace. We suggested to enable user mode stack trace database using this article as an example: CTX106970 and get a new dump.

- Dmitry Vostokov @ DumpAnalysis.org + TraceAnalysis.org -
Icons for Memory Dump Analysis Patterns (Part 45)

June 1st, 2010

Today we introduce an icon for Virtualized Process (WOW64) pattern:

B/W

Color

- Dmitry Vostokov @ DumpAnalysis.org + TraceAnalysis.org -
Reading Notebook: 31-May-10

May 31st, 2010

Comments in italics are mine and express my own views, thoughts and opinions

Windows Internals by M. Russinovich, D. Solomon and A. Ionescu:

Objects vs. account attributes, privilege vs. account right (p. 501)

NtRaiseHardError requires SeShutdownPrivilege (p. 508)

firmware environment variables (p. 508) - some more info: http://msdn.microsoft.com/en-us/library/ms724325(VS.85).aspx

Implication of Bypass Traverse Checking (SeNotifyPrivilege) (p. 509)

Elevated priviliges don’t extend past machine boundaries (p. 510)

Forthcoming Webinars: Complete Debugging and Crash Analysis for Windows

May 30th, 2010

Finally, after careful consideration, I’ve come up with the topic that has been neglected so far but at the same time important for both camps (kernel space and user space, including managed space): complete memory dump and software trace analysis. I plan to publish the first webinar agenda early in July and deliver the webinar in August (the date should be finalized by mid July).

PS. Sailing memory spaces under an RGB flag :-)

- Dmitry Vostokov @ DumpAnalysis.org + TraceAnalysis.org -

Crash Dump Analysis Patterns (Part 99a)

May 29th, 2010

Most of the time Incorrect Symbolic Information is associated with function names and offsets, for example, module!foo vs. module!foo+100. In some cases the module name is incorrect itself or absent altogether. This can happen in complete memory dumps when we forget to reload user space symbols after changing the process context, for example:

; previous process context of firefox.exe
; switching to winlogon.exe context

kd> .process fffffadfe718c040
Implicit process is now fffffadf`e718c040

kd> !process fffffadfe718c040
PROCESS fffffadfe718c040
    SessionId: 0  Cid: 017c    Peb: 7fffffd9000  ParentCid: 0130
    DirBase: 01916000  ObjectTable: fffffa800099a890  HandleCount: 754.
    Image: winlogon.exe
    VadRoot fffffadfe75e91f0 Vads 190 Clone 0 Private 2905. Modified 10047. Locked 0.
    DeviceMap fffffa8000004950
    Token                             fffffa800122a060
    ElapsedTime                       77 Days 02:14:26.109
    UserTime                          00:00:04.156
    KernelTime                        00:00:02.359
    QuotaPoolUsage[PagedPool]         143128
    QuotaPoolUsage[NonPagedPool]      191072
    Working Set Sizes (now,min,max)  (541, 50, 345) (2164KB, 200KB, 1380KB)
    PeakWorkingSetSize                6323
    VirtualSize                       108 Mb
    PeakVirtualSize                   118 Mb
    PageFaultCount                    212547
    MemoryPriority                    BACKGROUND
    BasePriority                      13
    CommitCharge                      3733

[...]

THREAD fffffadfe68f2040  Cid 017c.0198  Teb: 000007fffffd7000 Win32Thread: fffff97ff4a09010 WAIT: (Unknown) UserMode Non-Alertable
    fffffadfe7133160  Semaphore Limit 0x7fffffff
    fffffadfe68f20f8  NotificationTimer
Not impersonating
DeviceMap                 fffffa8000004950
Owning Process            fffffadfe718c040       Image:         winlogon.exe
Attached Process          N/A            Image:         N/A
Wait Start TickCount      426298731      Ticks: 51 (0:00:00:00.796)
Context Switch Count      2215076                 LargeStack
UserTime                  00:00:00.187
KernelTime                00:00:00.468
Start Address 0×0000000077d6b6e0
Stack Init fffffadfe4481e00 Current fffffadfe4481860
Base fffffadfe4482000 Limit fffffadfe447a000 Call 0
Priority 14 BasePriority 13 PriorityDecrement 0
Child-SP          RetAddr           Call Site
fffffadf`e44818a0 fffff800`0103b093 nt!KiSwapContext+0×85
fffffadf`e4481a20 fffff800`0103c433 nt!KiSwapThread+0xc3
fffffadf`e4481a60 fffff800`012d25ae nt!KeWaitForSingleObject+0×528
fffffadf`e4481af0 fffff800`0104113d nt!NtReplyWaitReceivePortEx+0×8c8
fffffadf`e4481c00 00000000`77ef0caa nt!KiSystemServiceCopyEnd+0×3 (TrapFrame @ fffffadf`e4481c70)
00000000`00bcfb98 000007ff`7fd6ff61 ntdll!NtReplyWaitReceivePortEx+0xa
00000000`00bcfba0 00000000`000d2340 0×7ff`7fd6ff61
00000000`00bcfba8 00000000`00bcfde0 0xd2340
00000000`00bcfbb0 00000000`014cd220 0xbcfde0
00000000`00bcfbb8 00000000`000c1d30 0×14cd220
00000000`00bcfbc0 00000000`00bcfe18 0xc1d30
00000000`00bcfbc8 0000ffff`00001f80 0xbcfe18
00000000`00bcfbd0 00000000`006c0044 0xffff`00001f80
00000000`00bcfbd8 00000000`000006ec firefox+0×2c0044
00000000`00bcfbe0 00000000`000007b0 0×6ec
00000000`00bcfbe8 00000000`419b8385 0×7b0
00000000`00bcfbf0 00000000`00000000 0×419b8385

kd> lmu m firefox
start             end                 module name
00000000`00400000 00000000`00b67000   firefox  T (no symbols)

We have the return address 00000000`006c0044 which is just firefox+0×2c0044 (00000000`00400000 + 2c0044). We correct that by reloading user space symbols.

kd> .reload /user

kd> !process fffffadfe718c040
[...]
THREAD fffffadfe68f2040  Cid 017c.0198  Teb: 000007fffffd7000 Win32Thread: fffff97ff4a09010 WAIT: (Unknown) UserMode Non-Alertable
    fffffadfe7133160  Semaphore Limit 0x7fffffff
    fffffadfe68f20f8  NotificationTimer
Not impersonating
DeviceMap                 fffffa8000004950
Owning Process            fffffadfe718c040       Image:         winlogon.exe
Attached Process          N/A            Image:         N/A
Wait Start TickCount      426298731      Ticks: 51 (0:00:00:00.796)
Context Switch Count      2215076                 LargeStack
UserTime                  00:00:00.187
KernelTime                00:00:00.468
Start Address kernel32!BaseThreadStart (0x0000000077d6b6e0)
Stack Init fffffadfe4481e00 Current fffffadfe4481860
Base fffffadfe4482000 Limit fffffadfe447a000 Call 0
Priority 14 BasePriority 13 PriorityDecrement 0
Child-SP          RetAddr           Call Site
fffffadf`e44818a0 fffff800`0103b093 nt!KiSwapContext+0x85
fffffadf`e4481a20 fffff800`0103c433 nt!KiSwapThread+0xc3
fffffadf`e4481a60 fffff800`012d25ae nt!KeWaitForSingleObject+0x528
fffffadf`e4481af0 fffff800`0104113d nt!NtReplyWaitReceivePortEx+0x8c8
fffffadf`e4481c00 00000000`77ef0caa nt!KiSystemServiceCopyEnd+0x3 (TrapFrame @ fffffadf`e4481c70)
00000000`00bcfb98 000007ff`7fd6ff61 ntdll!NtReplyWaitReceivePortEx+0xa
00000000`00bcfba0 000007ff`7fd45369 RPCRT4!LRPC_ADDRESS::ReceiveLotsaCalls+0x2a5
00000000`00bcfeb0 000007ff`7fd65996 RPCRT4!RecvLotsaCallsWrapper+0x9
00000000`00bcfee0 000007ff`7fd65d51 RPCRT4!BaseCachedThreadRoutine+0xde
00000000`00bcff50 00000000`77d6b71a RPCRT4!ThreadStartRoutine+0x21
00000000`00bcff80 00000000`00000000 kernel32!BaseThreadStart+0x3a

Commands like .process /r /p fffffadfe718c040 or !process fffffadfe718c040 ff do that automatically.

Another case for incorrect module names is malformed unloaded modules information. This can happen sometimes:

0:000> lmt
start    end        module name
[...]
7c800000 7c907000   kernel32  Mon Apr 16 16:53:05 2007 (46239BE1)
7c910000 7c9c7000   ntdll     Wed Aug 04 08:57:08 2004 (411096D4)
7c9d0000 7d1ef000   shell32   Tue Dec 19 21:49:37 2006 (45885E71)
7df20000 7dfc0000   urlmon    Wed Aug 22 14:13:03 2007 (46CC365F)
7e360000 7e3f0000   user32    Thu Mar 08 15:36:30 2007 (45F02D7E)
Missing image name, possible paged-out or corrupt data.

Unloaded modules:
00410053 008a00a3   Unknown_Module_00410053
    Timestamp: Tue Mar 17 20:27:26 1970 (0064002E)
    Checksum:  006C006C
00010755 007407c5   l      
    Timestamp: Wed Feb 04 21:26:01 1970 (002E0069)
    Checksum:  006C0064
00000011 411096d2   eme.dll
    Timestamp: Thu Apr 02 01:33:25 1970 (00780055)
    Checksum:  00680054
Missing image name, possible paged-out or corrupt data.
0064002e 00d0009a   Unknown_Module_0064002e
    Timestamp: unavailable (00000000)
    Checksum:  00000000

Here parts of UNICODE module names appear in checksums and timestamps as well. Such partial module names can appear on thread stacks and raw stack data, for example:

0:000> kL
ChildEBP RetAddr
[...]
0015ef3c 0366afc2 ModuleA!Validation+0x5b
WARNING: Frame IP not in any known module. Following frames may be wrong.
0015efcc 79e7c7a6 <Unloaded_ure.dll>+0x366afc1
03dc9b70 00000000 mscorwks!MethodDesc::CallDescr+0x1f

Default analysis falls victim too and suggests ure.dll you would try hard to find on your system:

MODULE_NAME: ure

IMAGE_NAME:  ure.dll

DEBUG_FLR_IMAGE_TIMESTAMP:  750063

FAILURE_BUCKET_ID:  ure.dll!Unloaded_c0000005_APPLICATION_FAULT

Timestamp is suspiciously UNICODE-like. In such cases we can even reconstruct the module name:

00000011 411096d2   eme.dll
    Timestamp: Thu Apr 02 01:33:25 1970 (00780055)
    Checksum:  00680054

0:000> .formats 00780055
Evaluate expression:
  Hex:     00000000`00780055
  Decimal: 7864405
  Octal:   0000000000000036000125
  Binary:  00000000 00000000 00000000 00000000 00000000 01111000 00000000 01010101
  Chars:   …..x.U
  Time:    Thu Apr 02 01:33:25 1970
  Float:   low 1.10204e-038 high 0
  Double:  3.88553e-317

0:000> .formats 00680054
Evaluate expression:
  Hex:     00680054
  Decimal: 6815828
  Octal:   00032000124
  Binary:  00000000 01101000 00000000 01010100
  Chars:   .h.T
  Time:    Fri Mar 20 21:17:08 1970
  Float:   low 9.55101e-039 high 0
  Double:  3.36747e-317

We concatenate UNICODE Ux and Th with eme.dll to get UxTheme.dll which is a real DLL name we can find on a system.

- Dmitry Vostokov @ DumpAnalysis.org + TraceAnalysis.org -

Icons for Memory Dump Analysis Patterns (Part 44)

May 28th, 2010

Today we introduce an icon for Stack Trace pattern:

B/W

Color

- Dmitry Vostokov @ DumpAnalysis.org + TraceAnalysis.org -
Reading Notebook: 26-May-10

May 27th, 2010

Comments in italics are mine and express my own views, thoughts and opinions

Windows Internals by M. Russinovich, D. Solomon and A. Ionescu:

Explicit ACE are ahead of inherited (p. 491)

Differences of inheritable ACE propagation AD objects (p. 491)

Ntmarta.dll: security inheritance support DLL (p. 492)

SeAccessCheck optimization: integrity check -> DACL check (p. 492)

Low and medium integrity processes can read high integrity objects (p. 493)

UIPI safe messages, shatter attacks, blocked (journal) hooks (pp. 493 - 494)

Owner Rights SID (pp. 495 - 496)

Importance of ACE ordering (pp. 497 - 498)

Security editors place Deny ACE on top, Advanced Settings and Effective Permissions (pp. 498 - 500)

AuthZ API: security model in user mode (pp. 500 - 501)