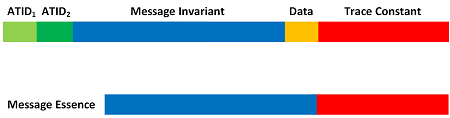
CPU Consumption Patterns

November 22nd, 2021

A page to reference all different kinds of CPU consumption analysis patterns is necessary, so I created this post:

I’ll update it as soon as I add more similar patterns.

- Dmitry Vostokov @ DumpAnalysis.org + TraceAnalysis.org -

Online Training: Accelerated Windows Memory Dump Analysis

November 22nd, 2021

I resume online training sessions. You can now register: https://www.patterndiagnostics.com/accelerated-windows-memory-dump-analysis

Crash Dump Analysis Patterns (Part 278)

November 22nd, 2021

In addition to the previous Spiking Thread and Distributed Spike CPU consumption analysis patterns we add Spiking Interrupts since they may account for perceived performance degradation such as response lags and system freezes. This pattern also includes DPC activity. We can see the times spent and the number of interrupts using this command and specify CPU number:

0: kd> !prcb 2
PRCB for Processor 2 at ffffe480b3600180:
Current IRQL — 2
Threads– Current ffffe480b360c240 Next 0000000000000000 Idle ffffe480b360c240
Processor Index 2 Number (0, 2) GroupSetMember 4
Interrupt Count — 0cadbd58
Times — Dpc 0000219c Interrupt 00002ae0

Kernel 00e7808e User 0041303b

0: kd> !whattime 0000219c + 00002ae0
19580 Ticks in Standard Time: 05:05.937s

We can also see the number of DPC requests from the structure itself:

0: kd> dt _KPRCB DPCData
nt!_KPRCB
+0×3340 DpcData : [2] _KDPC_DATA

0: kd> dt _KDPC_DATA
nt!_KDPC_DATA
+0x000 DpcList : _KDPC_LIST
+0x010 DpcLock : Uint8B
+0x018 DpcQueueDepth : Int4B
+0x01c DpcCount : Uint4B
+0x020 ActiveDpc : Ptr64 _KDPC
+0x028 LongDpcPresent : Uint4B
+0×02c Padding : Uint4B

0: kd> dt _KDPC_DATA ffffe480b3600180+0×3340
nt!_KDPC_DATA
+0×000 DpcList : _KDPC_LIST
+0×010 DpcLock : 0
+0×018 DpcQueueDepth : 0n1
+0×01c DpcCount : 0×74d9e0
+0×020 ActiveDpc : 0xffffa30f`e8f1f230 _KDPC
+0×028 LongDpcPresent : 0
+0×02c Padding : 0

0: kd> dt _KDPC_DATA ffffe480b3600180+0×3340+30
nt!_KDPC_DATA
+0×000 DpcList : _KDPC_LIST
+0×010 DpcLock : 0
+0×018 DpcQueueDepth : 0n0
+0×01c DpcCount : 0xd39
+0×020 ActiveDpc : (null)
+0×028 LongDpcPresent : 0
+0×02c Padding : 0

Since these numbers are high and depend on the system age, it is important to compare them with the normal system.

We should be aware that Windows 11 has DPC delegate threads (in addition to Idle threads) that are always shown as running even if they swapped (we can also check their number of context switches and kernel time):

0: kd> !process fffff80443332b00
PROCESS fffff80443332b00
SessionId: none Cid: 0000 Peb: 00000000 ParentCid: 0000
DirBase: 001ae002 ObjectTable: ffff82869fa52800 HandleCount: 3321.
Image: Idle
VadRoot ffffce8384257f70 Vads 2 Clone 0 Private 9. Modified 2094. Locked 0.
DeviceMap 0000000000000000
Token ffff82869fa1f120
ElapsedTime 3 Days 23:10:01.662
UserTime 00:00:00.000
KernelTime 00:00:00.000
QuotaPoolUsage[PagedPool] 0
QuotaPoolUsage[NonPagedPool] 272
Working Set Sizes (now,min,max) (9, 50, 450) (36KB, 200KB, 1800KB)
PeakWorkingSetSize 2
VirtualSize 0 Mb
PeakVirtualSize 0 Mb
PageFaultCount 9
MemoryPriority BACKGROUND
BasePriority 0
CommitCharge 15

THREAD fffff80443335bc0 Cid 0000.0000 Teb: 0000000000000000 Win32Thread: 0000000000000000 RUNNING on processor 0
Not impersonating
DeviceMap ffff82869fa63c00
Owning Process fffff80443332b00 Image: Idle
Attached Process ffffce83842e6040 Image: System
Wait Start TickCount 21906707 Ticks: 20013 (0:00:05:12.703)
Context Switch Count 72626555 IdealProcessor: 0
UserTime 00:00:00.000
KernelTime 3 Days 06:22:34.281
Win32 Start Address nt!KiIdleLoop (0xfffff80442a16a20)
Stack Init fffff8043f4beb70 Current fffff8043f4beb00
Base fffff8043f4bf000 Limit fffff8043f4b8000 Call 0000000000000000
Priority 0 BasePriority 0 PriorityDecrement 0 IoPriority 0 PagePriority 5
Child-SP RetAddr Call Site
fffff804`3f4be490 fffff804`428eaa41 nt!PpmIdleGuestExecute+0x1d
fffff804`3f4be4d0 fffff804`428ea256 nt!PpmIdleExecuteTransition+0x661
fffff804`3f4be970 fffff804`42a16a74 nt!PoIdle+0x3a6
fffff804`3f4beb40 00000000`00000000 nt!KiIdleLoop+0x54

THREAD ffffe480b3519240 Cid 0000.0000 Teb: 0000000000000000 Win32Thread: 0000000000000000 RUNNING on processor 1
Not impersonating
DeviceMap ffff82869fa63c00
Owning Process fffff80443332b00 Image: Idle
Attached Process ffffce83842e6040 Image: System
Wait Start TickCount 21905854 Ticks: 20866 (0:00:05:26.031)
Context Switch Count 83248123 IdealProcessor: 1
UserTime 00:00:00.000
KernelTime 3 Days 08:20:45.812
Win32 Start Address nt!KiIdleLoop (0xfffff80442a16a20)
Stack Init ffffa30fe822fb70 Current ffffa30fe822fb00
Base ffffa30fe8230000 Limit ffffa30fe8229000 Call 0000000000000000
Priority 0 BasePriority 0 PriorityDecrement 0 IoPriority 0 PagePriority 0
Child-SP RetAddr Call Site
ffffa30f`e822f490 fffff804`428eaa41 nt!PpmIdleGuestExecute+0x1d
ffffa30f`e822f4d0 fffff804`428ea256 nt!PpmIdleExecuteTransition+0x661
ffffa30f`e822f970 fffff804`42a16a74 nt!PoIdle+0x3a6
ffffa30f`e822fb40 00000000`00000000 nt!KiIdleLoop+0x54

THREAD ffffe480b360c240 Cid 0000.0000 Teb: 0000000000000000 Win32Thread: 0000000000000000 RUNNING on processor 2
Not impersonating
DeviceMap ffff82869fa63c00
Owning Process fffff80443332b00 Image: Idle
Attached Process ffffce83842e6040 Image: System
Wait Start TickCount 21926718 Ticks: 2 (0:00:00:00.031)
Context Switch Count 90942117 IdealProcessor: 2
UserTime 00:00:00.000
KernelTime 2 Days 15:59:04.671
Win32 Start Address nt!KiIdleLoop (0xfffff80442a16a20)
Stack Init ffffa30fe823fb70 Current ffffa30fe823fb00
Base ffffa30fe8240000 Limit ffffa30fe8239000 Call 0000000000000000
Priority 0 BasePriority 0 PriorityDecrement 0 IoPriority 0 PagePriority 0
Child-SP RetAddr Call Site
ffffa30f`e823f6c8 fffff804`42b5d0f6 nt!KeBugCheckEx
ffffa30f`e823f6d0 fffff804`43068f46 nt!PnpBugcheckPowerTimeout+0x76
ffffa30f`e823f730 fffff804`428dcc74 nt!PopBuildDeviceNotifyListWatchdog+0x16
ffffa30f`e823f760 fffff804`428db264 nt!KiProcessExpiredTimerList+0x204
ffffa30f`e823f890 fffff804`42a16abe nt!KiRetireDpcList+0x714
ffffa30f`e823fb40 00000000`00000000 nt!KiIdleLoop+0x9e

THREAD ffffe480b370c240 Cid 0000.0000 Teb: 0000000000000000 Win32Thread: 0000000000000000 RUNNING on processor 3
Not impersonating
DeviceMap ffff82869fa63c00
Owning Process fffff80443332b00 Image: Idle
Attached Process ffffce83842e6040 Image: System
Wait Start TickCount 21905684 Ticks: 21036 (0:00:05:28.687)
Context Switch Count 66067949 IdealProcessor: 3
UserTime 00:00:00.000
KernelTime 3 Days 08:02:26.906
Win32 Start Address nt!KiIdleLoop (0xfffff80442a16a20)
Stack Init ffffa30fe824fb70 Current ffffa30fe824fb00
Base ffffa30fe8250000 Limit ffffa30fe8249000 Call 0000000000000000
Priority 0 BasePriority 0 PriorityDecrement 0 IoPriority 0 PagePriority 0
Child-SP RetAddr Call Site
ffffa30f`e824f490 fffff804`428eaa41 nt!PpmIdleGuestExecute+0x1d
ffffa30f`e824f4d0 fffff804`428ea256 nt!PpmIdleExecuteTransition+0x661
ffffa30f`e824f970 fffff804`42a16a74 nt!PoIdle+0x3a6
ffffa30f`e824fb40 00000000`00000000 nt!KiIdleLoop+0x54

THREAD ffffe480b380c240 Cid 0000.0000 Teb: 0000000000000000 Win32Thread: 0000000000000000 RUNNING on processor 4
Not impersonating
DeviceMap ffff82869fa63c00
Owning Process fffff80443332b00 Image: Idle
Attached Process ffffce83842e6040 Image: System
Wait Start TickCount 21905843 Ticks: 20877 (0:00:05:26.203)
Context Switch Count 91986345 IdealProcessor: 4
UserTime 00:00:00.000
KernelTime 3 Days 05:20:02.156
Win32 Start Address nt!KiIdleLoop (0xfffff80442a16a20)
Stack Init ffffa30fe825fb70 Current ffffa30fe825fb00
Base ffffa30fe8260000 Limit ffffa30fe8259000 Call 0000000000000000
Priority 0 BasePriority 0 PriorityDecrement 0 IoPriority 0 PagePriority 0
Child-SP RetAddr Call Site
ffffa30f`e825f490 fffff804`428eaa41 nt!PpmIdleGuestExecute+0x1d
ffffa30f`e825f4d0 fffff804`428ea256 nt!PpmIdleExecuteTransition+0x661
ffffa30f`e825f970 fffff804`42a16a74 nt!PoIdle+0x3a6
ffffa30f`e825fb40 00000000`00000000 nt!KiIdleLoop+0x54

THREAD ffffe480b389d240 Cid 0000.0000 Teb: 0000000000000000 Win32Thread: 0000000000000000 RUNNING on processor 5
Not impersonating
DeviceMap ffff82869fa63c00
Owning Process fffff80443332b00 Image: Idle
Attached Process ffffce83842e6040 Image: System
Wait Start TickCount 21905822 Ticks: 20898 (0:00:05:26.531)
Context Switch Count 78668897 IdealProcessor: 5
UserTime 00:00:00.000
KernelTime 3 Days 08:24:03.187
Win32 Start Address nt!KiIdleLoop (0xfffff80442a16a20)
Stack Init ffffa30fe826fb70 Current ffffa30fe826fb00
Base ffffa30fe8270000 Limit ffffa30fe8269000 Call 0000000000000000
Priority 0 BasePriority 0 PriorityDecrement 0 IoPriority 0 PagePriority 0
Child-SP RetAddr Call Site
ffffa30f`e826f490 fffff804`428eaa41 nt!PpmIdleGuestExecute+0x1d
ffffa30f`e826f4d0 fffff804`428ea256 nt!PpmIdleExecuteTransition+0x661
ffffa30f`e826f970 fffff804`42a16a74 nt!PoIdle+0x3a6
ffffa30f`e826fb40 00000000`00000000 nt!KiIdleLoop+0x54

THREAD ffffe480b39b3240 Cid 0000.0000 Teb: 0000000000000000 Win32Thread: 0000000000000000 RUNNING on processor 6
Not impersonating
DeviceMap ffff82869fa63c00
Owning Process fffff80443332b00 Image: Idle
Attached Process ffffce83842e6040 Image: System
Wait Start TickCount 21905853 Ticks: 20867 (0:00:05:26.046)
Context Switch Count 96137826 IdealProcessor: 6
UserTime 00:00:00.000
KernelTime 3 Days 06:36:10.375
Win32 Start Address nt!KiIdleLoop (0xfffff80442a16a20)
Stack Init ffffa30fe827fb70 Current ffffa30fe827fb00
Base ffffa30fe8280000 Limit ffffa30fe8279000 Call 0000000000000000
Priority 0 BasePriority 0 PriorityDecrement 0 IoPriority 0 PagePriority 0
Child-SP RetAddr Call Site
ffffa30f`e827f490 fffff804`428eaa41 nt!PpmIdleGuestExecute+0x1d
ffffa30f`e827f4d0 fffff804`428ea256 nt!PpmIdleExecuteTransition+0x661
ffffa30f`e827f970 fffff804`42a16a74 nt!PoIdle+0x3a6
ffffa30f`e827fb40 00000000`00000000 nt!KiIdleLoop+0x54

THREAD ffffe480b3b0c240 Cid 0000.0000 Teb: 0000000000000000 Win32Thread: 0000000000000000 RUNNING on processor 7
Not impersonating
DeviceMap ffff82869fa63c00
Owning Process fffff80443332b00 Image: Idle
Attached Process ffffce83842e6040 Image: System
Wait Start TickCount 21905670 Ticks: 21050 (0:00:05:28.906)
Context Switch Count 39349487 IdealProcessor: 7
UserTime 00:00:00.000
KernelTime 3 Days 06:49:50.156
Win32 Start Address nt!KiIdleLoop (0xfffff80442a16a20)
Stack Init ffffa30fe828fb70 Current ffffa30fe828fb00
Base ffffa30fe8290000 Limit ffffa30fe8289000 Call 0000000000000000
Priority 0 BasePriority 0 PriorityDecrement 0 IoPriority 0 PagePriority 0
Child-SP RetAddr Call Site
ffffa30f`e828f490 fffff804`428eaa41 nt!PpmIdleGuestExecute+0x1d
ffffa30f`e828f4d0 fffff804`428ea256 nt!PpmIdleExecuteTransition+0x661
ffffa30f`e828f970 fffff804`42a16a74 nt!PoIdle+0x3a6
ffffa30f`e828fb40 00000000`00000000 nt!KiIdleLoop+0x54

THREAD ffffce8384321140 Cid 0000.002c Teb: 0000000000000000 Win32Thread: 0000000000000000 RUNNING on processor 0
Not impersonating
DeviceMap ffff82869fa63c00
Owning Process fffff80443332b00 Image: Idle
Attached Process ffffce83842e6040 Image: System
Wait Start TickCount 21906745 Ticks: 19975 (0:00:05:12.109)
Context Switch Count 55086 IdealProcessor: 0
UserTime 00:00:00.000
KernelTime 00:00:00.234
Win32 Start Address nt!KiExecuteDpcDelegate (0xfffff804429bb820)
Stack Init ffffa30fe82bfb70 Current ffffa30fe82bf8b0
Base ffffa30fe82c0000 Limit ffffa30fe82b9000 Call 0000000000000000
Priority 63 BasePriority 0 PriorityDecrement 0 IoPriority 0 PagePriority 0
Child-SP RetAddr Call Site
ffffa30f`e82bf8f0 fffff804`4285dc17 nt!KiSwapContext+0×76
ffffa30f`e82bfa30 fffff804`429bb87c nt!KiSwapThread+0×3a7
ffffa30f`e82bfb10 fffff804`42a16c24 nt!KiExecuteDpcDelegate+0×5c
ffffa30f`e82bfb40 00000000`00000000 nt!KiStartSystemThread+0×34

THREAD ffffce8384362080 Cid 0000.0034 Teb: 0000000000000000 Win32Thread: 0000000000000000 RUNNING on processor 1
Not impersonating
DeviceMap ffff82869fa63c00
Owning Process fffff80443332b00 Image: Idle
Attached Process ffffce83842e6040 Image: System
Wait Start TickCount 16926767 Ticks: 4999953 (0:21:42:04.265)
Context Switch Count 4968 IdealProcessor: 1
UserTime 00:00:00.000
KernelTime 00:00:00.015
Win32 Start Address nt!KiExecuteDpcDelegate (0xfffff804429bb820)
Stack Init ffffa30fe82cfb70 Current ffffa30fe82cf8b0
Base ffffa30fe82d0000 Limit ffffa30fe82c9000 Call 0000000000000000
Priority 63 BasePriority 0 PriorityDecrement 0 IoPriority 0 PagePriority 0
Child-SP RetAddr Call Site
ffffa30f`e82cf8f0 fffff804`4285dc17 nt!KiSwapContext+0×76
ffffa30f`e82cfa30 fffff804`429bb87c nt!KiSwapThread+0×3a7
ffffa30f`e82cfb10 fffff804`42a16c24 nt!KiExecuteDpcDelegate+0×5c
ffffa30f`e82cfb40 00000000`00000000 nt!KiStartSystemThread+0×34

THREAD ffffce83842f7040 Cid 0000.003c Teb: 0000000000000000 Win32Thread: 0000000000000000 RUNNING on processor 2
Not impersonating
DeviceMap ffff82869fa63c00
Owning Process fffff80443332b00 Image: Idle
Attached Process ffffce83842e6040 Image: System
Wait Start TickCount 21631408 Ticks: 295312 (0:01:16:54.250)
Context Switch Count 522 IdealProcessor: 2
UserTime 00:00:00.000
KernelTime 00:00:00.000
Win32 Start Address nt!KiExecuteDpcDelegate (0xfffff804429bb820)
Stack Init ffffa30fe82dfb70 Current ffffa30fe82df8b0
Base ffffa30fe82e0000 Limit ffffa30fe82d9000 Call 0000000000000000
Priority 63 BasePriority 0 PriorityDecrement 0 IoPriority 0 PagePriority 0
Child-SP RetAddr Call Site
ffffa30f`e82df8f0 fffff804`4285dc17 nt!KiSwapContext+0×76
ffffa30f`e82dfa30 fffff804`429bb87c nt!KiSwapThread+0×3a7
ffffa30f`e82dfb10 fffff804`42a16c24 nt!KiExecuteDpcDelegate+0×5c
ffffa30f`e82dfb40 00000000`00000000 nt!KiStartSystemThread+0×34

THREAD ffffce8384367040 Cid 0000.0044 Teb: 0000000000000000 Win32Thread: 0000000000000000 RUNNING on processor 3
Not impersonating
DeviceMap ffff82869fa63c00
Owning Process fffff80443332b00 Image: Idle
Attached Process ffffce83842e6040 Image: System
Wait Start TickCount 21667748 Ticks: 258972 (0:01:07:26.437)
Context Switch Count 301 IdealProcessor: 3
UserTime 00:00:00.000
KernelTime 00:00:00.000
Win32 Start Address nt!KiExecuteDpcDelegate (0xfffff804429bb820)
Stack Init ffffa30fe82efb70 Current ffffa30fe82ef8b0
Base ffffa30fe82f0000 Limit ffffa30fe82e9000 Call 0000000000000000
Priority 63 BasePriority 0 PriorityDecrement 0 IoPriority 0 PagePriority 0
Child-SP RetAddr Call Site
ffffa30f`e82ef8f0 fffff804`4285dc17 nt!KiSwapContext+0×76
ffffa30f`e82efa30 fffff804`429bb87c nt!KiSwapThread+0×3a7
ffffa30f`e82efb10 fffff804`42a16c24 nt!KiExecuteDpcDelegate+0×5c
ffffa30f`e82efb40 00000000`00000000 nt!KiStartSystemThread+0×34

THREAD ffffce8384369040 Cid 0000.004c Teb: 0000000000000000 Win32Thread: 0000000000000000 RUNNING on processor 4
Not impersonating
DeviceMap ffff82869fa63c00
Owning Process fffff80443332b00 Image: Idle
Attached Process ffffce83842e6040 Image: System
Wait Start TickCount 20333183 Ticks: 1593537 (0:06:54:59.015)
Context Switch Count 405 IdealProcessor: 4
UserTime 00:00:00.000
KernelTime 00:00:00.000
Win32 Start Address nt!KiExecuteDpcDelegate (0xfffff804429bb820)
Stack Init ffffa30fe82ffb70 Current ffffa30fe82ff8b0
Base ffffa30fe8300000 Limit ffffa30fe82f9000 Call 0000000000000000
Priority 63 BasePriority 0 PriorityDecrement 0 IoPriority 0 PagePriority 0
Child-SP RetAddr Call Site
ffffa30f`e82ff8f0 fffff804`4285dc17 nt!KiSwapContext+0×76
ffffa30f`e82ffa30 fffff804`429bb87c nt!KiSwapThread+0×3a7
ffffa30f`e82ffb10 fffff804`42a16c24 nt!KiExecuteDpcDelegate+0×5c
ffffa30f`e82ffb40 00000000`00000000 nt!KiStartSystemThread+0×34

THREAD ffffce838436b040 Cid 0000.0054 Teb: 0000000000000000 Win32Thread: 0000000000000000 RUNNING on processor 5
Not impersonating
DeviceMap ffff82869fa63c00
Owning Process fffff80443332b00 Image: Idle
Attached Process ffffce83842e6040 Image: System
Wait Start TickCount 4760713 Ticks: 17166007 (3:02:30:18.859)
Context Switch Count 118 IdealProcessor: 5
UserTime 00:00:00.000
KernelTime 00:00:00.000
Win32 Start Address nt!KiExecuteDpcDelegate (0xfffff804429bb820)
Stack Init ffffa30fe830fb70 Current ffffa30fe830f8b0
Base ffffa30fe8310000 Limit ffffa30fe8309000 Call 0000000000000000
Priority 63 BasePriority 0 PriorityDecrement 0 IoPriority 0 PagePriority 0
Child-SP RetAddr Call Site
ffffa30f`e830f8f0 fffff804`4285dc17 nt!KiSwapContext+0×76
ffffa30f`e830fa30 fffff804`429bb87c nt!KiSwapThread+0×3a7
ffffa30f`e830fb10 fffff804`42a16c24 nt!KiExecuteDpcDelegate+0×5c
ffffa30f`e830fb40 00000000`00000000 nt!KiStartSystemThread+0×34

THREAD ffffce838436d040 Cid 0000.005c Teb: 0000000000000000 Win32Thread: 0000000000000000 RUNNING on processor 6
Not impersonating
DeviceMap ffff82869fa63c00
Owning Process fffff80443332b00 Image: Idle
Attached Process ffffce83842e6040 Image: System
Wait Start TickCount 20662898 Ticks: 1263822 (0:05:29:07.218)
Context Switch Count 249 IdealProcessor: 6
UserTime 00:00:00.000
KernelTime 00:00:00.000
Win32 Start Address nt!KiExecuteDpcDelegate (0xfffff804429bb820)
Stack Init ffffa30fe831fb70 Current ffffa30fe831f8b0
Base ffffa30fe8320000 Limit ffffa30fe8319000 Call 0000000000000000
Priority 63 BasePriority 0 PriorityDecrement 0 IoPriority 0 PagePriority 0
Child-SP RetAddr Call Site
ffffa30f`e831f8f0 fffff804`4285dc17 nt!KiSwapContext+0×76
ffffa30f`e831fa30 fffff804`429bb87c nt!KiSwapThread+0×3a7
ffffa30f`e831fb10 fffff804`42a16c24 nt!KiExecuteDpcDelegate+0×5c
ffffa30f`e831fb40 00000000`00000000 nt!KiStartSystemThread+0×34

THREAD ffffce838436f040 Cid 0000.0064 Teb: 0000000000000000 Win32Thread: 0000000000000000 RUNNING on processor 7
Not impersonating
DeviceMap ffff82869fa63c00
Owning Process fffff80443332b00 Image: Idle
Attached Process ffffce83842e6040 Image: System
Wait Start TickCount 20547550 Ticks: 1379170 (0:05:59:09.531)
Context Switch Count 196 IdealProcessor: 7
UserTime 00:00:00.000
KernelTime 00:00:00.000
Win32 Start Address nt!KiExecuteDpcDelegate (0xfffff804429bb820)
Stack Init ffffa30fe832fb70 Current ffffa30fe832f8b0
Base ffffa30fe8330000 Limit ffffa30fe8329000 Call 0000000000000000
Priority 63 BasePriority 0 PriorityDecrement 0 IoPriority 0 PagePriority 0
Child-SP RetAddr Call Site
ffffa30f`e832f8f0 fffff804`4285dc17 nt!KiSwapContext+0×76
ffffa30f`e832fa30 fffff804`429bb87c nt!KiSwapThread+0×3a7
ffffa30f`e832fb10 fffff804`42a16c24 nt!KiExecuteDpcDelegate+0×5c
ffffa30f`e832fb40 00000000`00000000 nt!KiStartSystemThread+0×34

- Dmitry Vostokov @ DumpAnalysis.org + TraceAnalysis.org -

Crash Dump Analysis Patterns (Part 36b)

October 5th, 2021

When we added Local Buffer Overflow in 2007, we only added a short WinDbg output snippet of a user space example and didn’t elaborate much on stack reconstruction (although we wrote a separate modeling example, albeit 32-bit). Instead, we referenced a book on that topic that was available at that time. When working on the new exercise for the 5th edition of Accelerated Windows Memory Dump Analysis we realized the missing kernel space example. Many other patterns have both space analysis variants separately.

In addition to Incorrect Stack Traces we may also have Truncated Stack Traces:

1: kd> kc
# Call Site
00 nt!KeBugCheckEx
01 nt!KiDispatchException
02 nt!KiExceptionDispatch
03 nt!KiPageFault

For our try to reconstruct stack trace we need the boundaries of the stack region: its base (upper address, the stack grows towards lower addresses) and the stack pointer address for the current fault. We get both from the output of !thread and .trap WinDbg commands:

1: kd> !thread
THREAD ffff9a8e065f7080 Cid 1e7c.1e80 Teb: 000000ce1b0a7000 Win32Thread: ffff9a8e064c9a60 RUNNING on processor 1
[...]
Base ffffce833784d000 Limit ffffce8337847000 Call 0000000000000000
[…]
ffffce83`3784c950 00000000`00000000 : 00000000`00000000 00000000`00000000 00000000`00000000 fffff801`7e7f5e51 : nt!KiPageFault+0×443 (TrapFrame @ ffffce83`3784c950)

1: kd> .trap ffffce83`3784c950
NOTE: The trap frame does not contain all registers.
Some register values may be zeroed or incorrect.
rax=0000000000000000 rbx=0000000000000000 rcx=fffff8017f831b7f
rdx=fffff8017f830000 rsi=0000000000000000 rdi=0000000000000000
rip=0000000000000000 rsp=ffffce833784cae0 rbp=0000000000000002
r8=0000000000000000 r9=0000000000000000 r10=ffff9a8e060b62c0
r11=0000000000000000 r12=0000000000000000 r13=0000000000000000
r14=0000000000000000 r15=0000000000000000
iopl=0 nv up ei ng nz na pe nc
00000000`00000000 ?? ???

We see that we have NULL Pointer (Code) here. We now try stack addresses from the top of Execution Residue unless we get a good stack trace:

1: kd> dps ffffce833784cae0 ffffce833784d000
ffffce83`3784cae0 00000000`00000000
ffffce83`3784cae8 00000000`00000000
ffffce83`3784caf0 00000000`00000000
ffffce83`3784caf8 fffff801`7e7f5e51 nt!ObpReferenceObjectByHandleWithTag+0×231
ffffce83`3784cb00 00000000`00000000
ffffce83`3784cb08 ffff868e`00000000
ffffce83`3784cb10 ffff86a6`83360010
ffffce83`3784cb18 ffff9a8e`05e8f990
ffffce83`3784cb20 ffff9a8e`060b62c0
ffffce83`3784cb28 00000000`00000000
ffffce83`3784cb30 ffff9a8e`06794a70
ffffce83`3784cb38 fffff801`7e48f865 nt!IofCallDriver+0×55
ffffce83`3784cb40 ffff9a8e`05e8f960
ffffce83`3784cb48 00000000`00000001
ffffce83`3784cb50 ffffce83`3784cec0
ffffce83`3784cb58 00000000`00000001
ffffce83`3784cb60 ffff9a8e`060b62c0
ffffce83`3784cb68 ffff9a8e`05e8fa78
ffffce83`3784cb70 ffff9a8e`06794a70
ffffce83`3784cb78 fffff801`7e875328 nt!IopSynchronousServiceTail+0×1a8
ffffce83`3784cb80 ffffce83`3784cec0
ffffce83`3784cb88 ffff9a8e`05e8f960
ffffce83`3784cb90 00000000`00000001
[…]

1: kd> k L=ffffce83`3784caf8
# Child-SP RetAddr Call Site
00 ffffce83`3784caf8 fffff801`7e7f5e51 0×0
01 ffffce83`3784cb00 ffff9a8e`05e8f960 nt!ObpReferenceObjectByHandleWithTag+0×231
02 ffffce83`3784cb90 00000000`00000001 0xffff9a8e`05e8f960
03 ffffce83`3784cb98 fffff801`00000000 0×1
04 ffffce83`3784cba0 00000000`00000000 0xfffff801`00000000

1: kd> k L=ffffce83`3784cb38
# Child-SP RetAddr Call Site
00 ffffce83`3784cb38 fffff801`7e48f865 0×0
01 ffffce83`3784cb40 fffff801`7e875328 nt!IofCallDriver+0×55
02 ffffce83`3784cb80 fffff801`7e874bf5 nt!IopSynchronousServiceTail+0×1a8
03 ffffce83`3784cc20 fffff801`7e8745f6 nt!IopXxxControlFile+0×5e5
04 ffffce83`3784cd60 fffff801`7e608bb5 nt!NtDeviceIoControlFile+0×56
05 ffffce83`3784cdd0 00007ffb`8dc6ce54 nt!KiSystemServiceCopyEnd+0×25
06 000000ce`1b2fea68 00000000`00000000 0×00007ffb`8dc6ce54

- Dmitry Vostokov @ DumpAnalysis.org + TraceAnalysis.org -

Crash Dump Analysis Patterns (Part 60c)

October 3rd, 2021

This part is a kernel space counterpart to unmanaged user space Execution Residue. We get the boundaries of the stack region from the output of !thread command:

THREAD ffff9a8e065f7080 Cid 1e7c.1e80 Teb: 000000ce1b0a7000 Win32Thread: ffff9a8e064c9a60 RUNNING on processor 1
IRP List:
ffff9a8e05e8f960: (0006,0118) Flags: 00060000 Mdl: 00000000
Not impersonating
DeviceMap ffffaa81e3622e30
Owning Process ffff9a8e06992080 Image: process.exe
Attached Process N/A Image: N/A
Wait Start TickCount 7953 Ticks: 1 (0:00:00:00.015)
Context Switch Count 1386 IdealProcessor: 1
UserTime 00:00:00.046
KernelTime 00:00:00.078
Win32 Start Address 0x00007ff79e985384
Stack Init ffffce833784cfd0 Current ffffce833784c690
Base ffffce833784d000 Limit ffffce8337847000 Call 0000000000000000
Priority 12 BasePriority 8 PriorityDecrement 2 IoPriority 2 PagePriority 5

0: kd> dps ffffce8337847000 ffffce833784d000
[…]
ffffce83`3784b720 ffffffff`c0000000
ffffce83`3784b728 00000000`00040000
ffffce83`3784b730 fffff801`7e6f3b90 nt!HvlGetEncryptedData
ffffce83`3784b738 fffff801`7e712bd0 nt!KiBugCheckProgress
ffffce83`3784b740 00000000`00000000
ffffce83`3784b748 00000000`00000001
ffffce83`3784b750 fffff801`860d0b70 crashdmp!Context+0×50
ffffce83`3784b758 fffff801`860c695c crashdmp!DumpWrite+0×474
ffffce83`3784b760 fffff801`860d0b70 crashdmp!Context+0×50
ffffce83`3784b768 fffff801`7e712bd0 nt!KiBugCheckProgress
ffffce83`3784b770 00000000`50404286
ffffce83`3784b778 00000000`00002000
ffffce83`3784b780 00000000`0001f900
ffffce83`3784b788 fffff801`860cc123 crashdmp!CrashdmpTelemetrySaveEnvironmentVariable+0×5f
ffffce83`3784b790 ffff785d`5e18d8e1
ffffce83`3784b798 fffff801`860c290d crashdmp!CheckContextIntegrity+0×6d
ffffce83`3784b7a0 ffffffff`c0000005
ffffce83`3784b7a8 ffff9a8e`065f7080
ffffce83`3784b7b0 fffff801`7e712bd0 nt!KiBugCheckProgress
ffffce83`3784b7b8 00000000`0000001e
ffffce83`3784b7c0 00000000`00000000
ffffce83`3784b7c8 fffff801`860c50d6 crashdmp!CrashdmpWrite+0×1f6
ffffce83`3784b7d0 00000000`00000000
ffffce83`3784b7d8 ffffce83`3784b900
ffffce83`3784b7e0 fffff801`7e712bd0 nt!KiBugCheckProgress
ffffce83`3784b7e8 00000000`00000000
ffffce83`3784b7f0 00000000`00000000
ffffce83`3784b7f8 fffff801`7e6fdf0e nt!IoWriteCrashDump+0×53e
ffffce83`3784b800 ffffce83`3784bae0
ffffce83`3784b808 ffffce83`3784b900
ffffce83`3784b810 ffffce83`3784bae0
ffffce83`3784b818 00000000`00000000
ffffce83`3784b820 0067006f`00720050
ffffce83`3784b828 00730073`00650072
ffffce83`3784b830 00540050`00450000
ffffce83`3784b838 005f004e`004f0000
ffffce83`3784b840 00000000`00000000
ffffce83`3784b848 00000000`00000000
ffffce83`3784b850 00000000`00000000
ffffce83`3784b858 00000000`00000000
ffffce83`3784b860 ffff3902`484e7864
ffffce83`3784b868 fffff801`7e5c6b1a nt!IopIsAddressRangeValid+0×3e
ffffce83`3784b870 00000000`00c33a01
ffffce83`3784b878 00000000`00000008
ffffce83`3784b880 00000000`00000000
ffffce83`3784b888 00000000`00140000
ffffce83`3784b890 ffff9a8e`00f04038
ffffce83`3784b898 00000dff`00000000
ffffce83`3784b8a0 00000000`00000000
ffffce83`3784b8a8 ffff9a8e`065f7080
ffffce83`3784b8b0 ffffffff`c0000005
ffffce83`3784b8b8 fffff801`7e6fd6d0 nt!IoSetDumpRange
ffffce83`3784b8c0 fffff801`7e6fd060 nt!IoFreeDumpRange
ffffce83`3784b8c8 ffffce83`3784b888
ffffce83`3784b8d0 ffff9a8e`00f04000
ffffce83`3784b8d8 00000000`00000000
ffffce83`3784b8e0 00000000`00000000
ffffce83`3784b8e8 ffffffff`c0000005
ffffce83`3784b8f0 00000000`00000000
ffffce83`3784b8f8 00000000`00000008
ffffce83`3784b900 00000000`00000000
ffffce83`3784b908 ffff3902`484e7824
ffffce83`3784b910 00000000`0000001e
ffffce83`3784b918 ffff9a8e`065f7080
ffffce83`3784b920 00000000`00000001
ffffce83`3784b928 00000000`00000000
ffffce83`3784b930 00000000`00000003
ffffce83`3784b938 ffffd581`211c3180
ffffce83`3784b940 00000000`00000001
ffffce83`3784b948 00000000`00000000
ffffce83`3784b950 ffffce83`3784ba60
ffffce83`3784b958 fffff801`7e712456 nt!KeBugCheck2+0xca6
ffffce83`3784b960 00000000`00000001
ffffce83`3784b968 ffff9a8e`032bc000
ffffce83`3784b970 fffff801`7ee31a00 nt!KeBugCheckReasonCallbackListHead
ffffce83`3784b978 fffff801`7ee31a00 nt!KeBugCheckReasonCallbackListHead
ffffce83`3784b980 00000000`00000000
ffffce83`3784b988 ffffce83`3784bae0
ffffce83`3784b990 ffff9a8e`065f7080
ffffce83`3784b998 fffff801`7e712bd0 nt!KiBugCheckProgress
ffffce83`3784b9a0 ffffce83`3784c000
ffffce83`3784b9a8 00000000`00000000
ffffce83`3784b9b0 00000101`01000001
ffffce83`3784b9b8 ffff9a8e`065f7080
ffffce83`3784b9c0 00000000`0000001e
ffffce83`3784b9c8 00000000`00000000
ffffce83`3784b9d0 00000000`0000000f
ffffce83`3784b9d8 fffff801`7caf2100
ffffce83`3784b9e0 00000000`00000000
ffffce83`3784b9e8 00000000`00000000
ffffce83`3784b9f0 ffffd581`211c3180
ffffce83`3784b9f8 ffff86a6`00000004
ffffce83`3784ba00 00000000`00000000
ffffce83`3784ba08 ffff86a6`00000001
ffffce83`3784ba10 ffffce83`3784d000
ffffce83`3784ba18 ffffce83`37847000
ffffce83`3784ba20 fffff801`7e712bd0 nt!KiBugCheckProgress
ffffce83`3784ba28 fffff801`7e489594 nt!ExFreeHeapPool+0×4d4
ffffce83`3784ba30 00000000`00140001
ffffce83`3784ba38 00000000`00000001
ffffce83`3784ba40 00000000`00000000
ffffce83`3784ba48 00000000`00000000
ffffce83`3784ba50 00000000`00000000
ffffce83`3784ba58 00000000`00000000
ffffce83`3784ba60 00000000`00000000
ffffce83`3784ba68 00000000`00000000
ffffce83`3784ba70 00000000`00000000
ffffce83`3784ba78 00000000`00000000
ffffce83`3784ba80 00000000`00000000
ffffce83`3784ba88 00000000`00000000
ffffce83`3784ba90 00000000`00000000
ffffce83`3784ba98 00000000`00000000
ffffce83`3784baa0 00000000`00000000
ffffce83`3784baa8 00000000`00000000
ffffce83`3784bab0 00000000`00000000
ffffce83`3784bab8 00000000`00000000
ffffce83`3784bac0 00000000`00000000
ffffce83`3784bac8 00000000`00000000
ffffce83`3784bad0 00000000`00000000
ffffce83`3784bad8 fffff801`7e40ac67 nt!ExReleasePushLockSharedEx+0×37
ffffce83`3784bae0 00000000`00000000
ffffce83`3784bae8 00000000`00000000
ffffce83`3784baf0 00000000`00000000
ffffce83`3784baf8 00000000`00000000
ffffce83`3784bb00 00000000`00000000
ffffce83`3784bb08 00000000`00000000
ffffce83`3784bb10 00001f80`0010000f
ffffce83`3784bb18 0053002b`002b0010
ffffce83`3784bb20 00040246`0018002b
ffffce83`3784bb28 00000000`00000000
ffffce83`3784bb30 00000000`00000000
ffffce83`3784bb38 00000000`00000000
ffffce83`3784bb40 00000000`00000000
ffffce83`3784bb48 00000000`00000000
ffffce83`3784bb50 00000000`00000000
ffffce83`3784bb58 00000000`00000000
ffffce83`3784bb60 00000000`0000001e
ffffce83`3784bb68 ffffffff`c0000005
ffffce83`3784bb70 ffffce83`3784c8a8
ffffce83`3784bb78 ffffce83`3784c0a8
ffffce83`3784bb80 ffffce83`3784c5e0
ffffce83`3784bb88 ffffce83`3784c0e0
ffffce83`3784bb90 00000000`00000000
ffffce83`3784bb98 00000000`00000000
ffffce83`3784bba0 00000000`00000008
ffffce83`3784bba8 ffffce83`3784c8a8
ffffce83`3784bbb0 fffff801`7f000028 nt!PsInvertedFunctionTable+0×18
ffffce83`3784bbb8 00000000`00000000
ffffce83`3784bbc0 00000000`00000000
ffffce83`3784bbc8 ffffce83`3784c950
ffffce83`3784bbd0 00000000`0010001f
ffffce83`3784bbd8 fffff801`7e5f71c0 nt!KeBugCheckEx
ffffce83`3784bbe0 00000000`0000027f
ffffce83`3784bbe8 00000000`00000000
ffffce83`3784bbf0 00000000`00000000
ffffce83`3784bbf8 00000000`00001f80
ffffce83`3784bc00 00000000`00000000
ffffce83`3784bc08 00000000`00000000
ffffce83`3784bc10 00000000`00000000
ffffce83`3784bc18 00000000`00000000
ffffce83`3784bc20 00000000`00000000
ffffce83`3784bc28 00000000`00000000
ffffce83`3784bc30 00000000`00000000
ffffce83`3784bc38 00000000`00000000
ffffce83`3784bc40 00000000`00000000
ffffce83`3784bc48 00000000`00000000
ffffce83`3784bc50 00000000`00000000
ffffce83`3784bc58 00000000`00000000
ffffce83`3784bc60 00000000`00000000
ffffce83`3784bc68 00000000`00000000
ffffce83`3784bc70 00000000`00000000
ffffce83`3784bc78 00000000`00000000
ffffce83`3784bc80 00000000`00000000
ffffce83`3784bc88 00000000`00000000
ffffce83`3784bc90 00000000`00000000
ffffce83`3784bc98 ffff86a6`006136a0
ffffce83`3784bca0 00000000`00000000
ffffce83`3784bca8 00000000`00000000
ffffce83`3784bcb0 00000000`00000000
ffffce83`3784bcb8 00000000`00000000
ffffce83`3784bcc0 00000000`00000000
ffffce83`3784bcc8 00000000`00000000
ffffce83`3784bcd0 00000000`00000000
ffffce83`3784bcd8 00000000`00000000
ffffce83`3784bce0 00000000`00000000
ffffce83`3784bce8 00000000`00000000
ffffce83`3784bcf0 00000000`00000000
ffffce83`3784bcf8 00000000`00000000
ffffce83`3784bd00 00000000`00000000
ffffce83`3784bd08 00000000`00000000
ffffce83`3784bd10 00000000`00000000
ffffce83`3784bd18 00000000`00000000
ffffce83`3784bd20 00000000`00000000
ffffce83`3784bd28 00000000`00000000
ffffce83`3784bd30 00000000`00000000
ffffce83`3784bd38 00000000`00000000
ffffce83`3784bd40 00000000`00000000
ffffce83`3784bd48 00000000`00000000
ffffce83`3784bd50 00000000`00000000
ffffce83`3784bd58 00000000`00000000
ffffce83`3784bd60 00000000`00000000
ffffce83`3784bd68 00000000`00000000
ffffce83`3784bd70 00000000`00000000
ffffce83`3784bd78 00000000`00000000
ffffce83`3784bd80 00000000`00000000
ffffce83`3784bd88 00000000`00000000
ffffce83`3784bd90 00000000`00000000
ffffce83`3784bd98 00000000`00000000
ffffce83`3784bda0 00000000`00000000
ffffce83`3784bda8 00000000`00000000
ffffce83`3784bdb0 00000000`00000000
ffffce83`3784bdb8 00000000`00000000
ffffce83`3784bdc0 00000000`00000000
ffffce83`3784bdc8 00000000`00000000
ffffce83`3784bdd0 00000000`00000000
ffffce83`3784bdd8 00000000`00000000
ffffce83`3784bde0 00000000`00000000
ffffce83`3784bde8 00000000`00000000
ffffce83`3784bdf0 00000000`00000000
ffffce83`3784bdf8 00000000`00000000
ffffce83`3784be00 00000000`00000000
ffffce83`3784be08 00000000`00000000
ffffce83`3784be10 00000000`00000000
ffffce83`3784be18 00000000`00000000
ffffce83`3784be20 00000000`00000000
ffffce83`3784be28 00000000`00000000
ffffce83`3784be30 00000000`00000000
ffffce83`3784be38 00000000`00000000
ffffce83`3784be40 00000000`00000000
ffffce83`3784be48 00000000`00000000
ffffce83`3784be50 00000000`00000000
ffffce83`3784be58 00000000`00000000
ffffce83`3784be60 00000000`00000000
ffffce83`3784be68 00000000`00000000
ffffce83`3784be70 00000000`00000000
ffffce83`3784be78 00000000`00000000
ffffce83`3784be80 00000000`00000000
ffffce83`3784be88 00000000`00000000
ffffce83`3784be90 00000000`00000000
ffffce83`3784be98 00000000`00000000
ffffce83`3784bea0 00000000`00000000
ffffce83`3784bea8 00000000`00000000
ffffce83`3784beb0 00000000`00000000
ffffce83`3784beb8 00000000`00000000
ffffce83`3784bec0 00000000`00000000
ffffce83`3784bec8 00000000`00000000
ffffce83`3784bed0 00000000`00000000
ffffce83`3784bed8 00000000`00000000
ffffce83`3784bee0 00000000`00000000
ffffce83`3784bee8 00000000`00000000
ffffce83`3784bef0 00000000`00000000
ffffce83`3784bef8 00000000`00000000
ffffce83`3784bf00 00000000`00000000
ffffce83`3784bf08 00000000`00000000
ffffce83`3784bf10 00000000`00000000
ffffce83`3784bf18 00000000`00000000
ffffce83`3784bf20 00000000`00000000
ffffce83`3784bf28 00000000`00000000
ffffce83`3784bf30 00000000`00000000
ffffce83`3784bf38 00000000`00000000
ffffce83`3784bf40 00000000`00000000
ffffce83`3784bf48 00000000`00000000
ffffce83`3784bf50 00000000`00000000
ffffce83`3784bf58 00000000`00000000
ffffce83`3784bf60 00000000`00000000
ffffce83`3784bf68 00000000`00000000
ffffce83`3784bf70 00000000`00000000
ffffce83`3784bf78 00000000`00000000
ffffce83`3784bf80 00000000`00000000
ffffce83`3784bf88 00000000`00000000
ffffce83`3784bf90 00000000`00000000
ffffce83`3784bf98 00000000`00000000
ffffce83`3784bfa0 00000000`00000000
ffffce83`3784bfa8 00000000`00000000
ffffce83`3784bfb0 00000000`00000000
ffffce83`3784bfb8 00000000`00000000
ffffce83`3784bfc0 00000000`00000000
ffffce83`3784bfc8 00000000`00000000
ffffce83`3784bfd0 00000000`00000000
ffffce83`3784bfd8 00000000`00000000
ffffce83`3784bfe0 00000000`00000000
ffffce83`3784bfe8 00000000`00000000
ffffce83`3784bff0 00000000`00000000
ffffce83`3784bff8 00000000`00000000
ffffce83`3784c000 00000000`00000000
ffffce83`3784c008 00000000`00000000
ffffce83`3784c010 00000000`00000000
ffffce83`3784c018 00000000`00000000
ffffce83`3784c020 00000000`00000000
ffffce83`3784c028 00000000`00000000
ffffce83`3784c030 00000000`0010001f
ffffce83`3784c038 ffffce83`3784c950
ffffce83`3784c040 00000000`00000000
ffffce83`3784c048 00000000`00000000
ffffce83`3784c050 00000000`00000000
ffffce83`3784c058 ffffce83`3784c0e0
ffffce83`3784c060 ffffce83`3784c5e0
ffffce83`3784c068 fffff801`7e5f72c7 nt!KeBugCheckEx+0×107
ffffce83`3784c070 ffffce83`3784c8a8
ffffce83`3784c078 ffffce83`3784c5e0
ffffce83`3784c080 ffffce83`3784c8a8
ffffce83`3784c088 00000000`00000000
ffffce83`3784c090 00000000`00000000
ffffce83`3784c098 00000000`00000000
ffffce83`3784c0a0 00000000`00040246
ffffce83`3784c0a8 fffff801`7e659ecb nt!KiDispatchException+0×17467b
ffffce83`3784c0b0 00000000`0000001e
ffffce83`3784c0b8 ffffffff`c0000005
ffffce83`3784c0c0 00000000`00000000
ffffce83`3784c0c8 00000000`00000008
ffffce83`3784c0d0 00000000`00000000
ffffce83`3784c0d8 00000000`00000001
ffffce83`3784c0e0 ffff86a6`0312a600
ffffce83`3784c0e8 ffff86a6`0312a688
ffffce83`3784c0f0 ffff86a6`0312a4e8
ffffce83`3784c0f8 00000000`00000d0d
ffffce83`3784c100 00000001`00000000
ffffce83`3784c108 00000000`00000000
ffffce83`3784c110 00001f80`0010001f
ffffce83`3784c118 0053002b`002b0010
ffffce83`3784c120 00050282`0018002b
ffffce83`3784c128 00000000`00000000
ffffce83`3784c130 00000000`00000000
ffffce83`3784c138 00000000`00000000
ffffce83`3784c140 00000000`00000000
ffffce83`3784c148 00000000`00000000
ffffce83`3784c150 00000000`00000000
[…]
ffffce83`3784cda0 00000000`00000000
ffffce83`3784cda8 ffffce83`00000000
ffffce83`3784cdb0 ffff86a6`00000001
ffffce83`3784cdb8 00000000`00000000
ffffce83`3784cdc0 ffffaa81`e634c9c0
ffffce83`3784cdc8 fffff801`7e608bb5 nt!KiSystemServiceCopyEnd+0×25
ffffce83`3784cdd0 00000000`00000000
ffffce83`3784cdd8 ffff1496`0a767479
ffffce83`3784cde0 00000000`0002034c
ffffce83`3784cde8 000002aa`2d0d0180
ffffce83`3784cdf0 000000ce`1b2feac0
ffffce83`3784cdf8 00000023`83360010
ffffce83`3784ce00 00000000`00000000
ffffce83`3784ce08 00000000`00000000
ffffce83`3784ce10 00000000`00000000
ffffce83`3784ce18 00000000`00000000
ffffce83`3784ce20 ffff9a8e`065f7080
ffffce83`3784ce28 00000000`00000000
ffffce83`3784ce30 ffff9a8e`065f7080
ffffce83`3784ce38 fffff801`7e608bb5 nt!KiSystemServiceCopyEnd+0×25
ffffce83`3784ce40 00000000`00000001
ffffce83`3784ce48 ffffce83`38b5db80
ffffce83`3784ce50 000002aa`00000000
ffffce83`3784ce58 ffff868e`e8876c88 win32k!NtUserKillTimer
ffffce83`3784ce60 000000ce`00000000
ffffce83`3784ce68 00001f80`02080000
ffffce83`3784ce70 00000000`00000007
ffffce83`3784ce78 00000000`000001e4
ffffce83`3784ce80 00000000`00000000
ffffce83`3784ce88 000000ce`1b2ff5b8
ffffce83`3784ce90 000000ce`1b2ff689
ffffce83`3784ce98 00000000`00000000
ffffce83`3784cea0 00000000`00000246
ffffce83`3784cea8 000000ce`1b0a7000
ffffce83`3784ceb0 00000000`00000000
ffffce83`3784ceb8 00000000`00000000
ffffce83`3784cec0 00000000`00000000
ffffce83`3784cec8 00000000`00000000
ffffce83`3784ced0 00000000`00000000
ffffce83`3784ced8 00000000`00000000
ffffce83`3784cee0 00000000`00000000
ffffce83`3784cee8 00000000`00000000
ffffce83`3784cef0 00000000`00000000
ffffce83`3784cef8 00000000`00000000
ffffce83`3784cf00 00000000`00000000
ffffce83`3784cf08 00000000`00000000
ffffce83`3784cf10 00007ffb`8a73a5c2
ffffce83`3784cf18 00000000`00000000
ffffce83`3784cf20 00000000`00000000
ffffce83`3784cf28 00000000`00000000
ffffce83`3784cf30 00000000`00000000
ffffce83`3784cf38 00000000`00000000
ffffce83`3784cf40 00000000`00000000
ffffce83`3784cf48 00000000`00000000
ffffce83`3784cf50 00000000`00000000
ffffce83`3784cf58 00000000`00000000
ffffce83`3784cf60 00000000`00000000
ffffce83`3784cf68 00000000`00000000
ffffce83`3784cf70 00000000`00000000
ffffce83`3784cf78 00000000`00000000
ffffce83`3784cf80 00000000`00000000
ffffce83`3784cf88 00000000`000001e4
ffffce83`3784cf90 00000000`00000000
ffffce83`3784cf98 00000000`000001e4
ffffce83`3784cfa0 00000000`00000100
ffffce83`3784cfa8 00007ffb`8dc6ce54
ffffce83`3784cfb0 00000000`00000033
ffffce83`3784cfb8 00000000`00000246
ffffce83`3784cfc0 000000ce`1b2fea68
ffffce83`3784cfc8 00000000`0000002b
ffffce83`3784cfd0 ffffce83`3784d000
ffffce83`3784cfd8 ffffce83`37847000
ffffce83`3784cfe0 ffffce83`38b5e000
ffffce83`3784cfe8 ffffce83`38b58000
ffffce83`3784cff0 ffffce83`38b5d420
ffffce83`3784cff8 ffffce83`38b5dc90
ffffce83`3784d000 ????????`????????

In the case of Self-Diagnosis bugchecks Effect Components‘ execution residue (such as crashdmp and dump_diskdump) overwrite previous pre-bugcheck execution residue that makes reconstruction of Past Stack Trace impossible.

However, before Effect Components are executed, content of the stack region is saved in a special area:

0: kd> ? ffffce833784d000 - ffffce8337847000
Evaluate expression: 24576 = 00000000`00006000

0: kd> dps KiPreBugcheckStackSaveArea KiPreBugcheckStackSaveArea+6000
[…]
fffff801`7ee2f9f0 00000000`00000034
fffff801`7ee2f9f8 00000000`00000015
fffff801`7ee2fa00 ffff868e`e836edb0 win32kfull!vSrcTranCopyS8D32
fffff801`7ee2fa08 00000000`00000005
fffff801`7ee2fa10 00000000`0000000d
fffff801`7ee2fa18 00000000`00000014
fffff801`7ee2fa20 ffffce83`3784c020
fffff801`7ee2fa28 ffff868e`e8379289 win32kfull!vExpandAndCopyText+0×499
fffff801`7ee2fa30 ffff86a6`03358c65
fffff801`7ee2fa38 00000000`00000005
fffff801`7ee2fa40 ffff86a6`00000024
fffff801`7ee2fa48 ffff86a6`03361644
fffff801`7ee2fa50 00000000`ffcce4f7
fffff801`7ee2fa58 00000000`0000001f
fffff801`7ee2fa60 00000000`00000138
fffff801`7ee2fa68 00000000`00000000
fffff801`7ee2fa70 00000000`00000000
fffff801`7ee2fa78 00000000`ffcce4f7
fffff801`7ee2fa80 ffff86a6`03b27840
fffff801`7ee2fa88 00000000`0000002f
fffff801`7ee2fa90 00000000`00000024
fffff801`7ee2fa98 ffffce83`3784c68c
fffff801`7ee2faa0 00000000`0000002a
fffff801`7ee2faa8 fffff801`00000014
fffff801`7ee2fab0 00000000`0000002a
fffff801`7ee2fab8 ffff86a6`03358a90
fffff801`7ee2fac0 ffff868e`e836edb0 win32kfull!vSrcTranCopyS8D32
fffff801`7ee2fac8 ffffce83`3784c020
fffff801`7ee2fad0 ffff86a6`00000000
fffff801`7ee2fad8 ffff86a6`03b27840
fffff801`7ee2fae0 00000001`00000020
fffff801`7ee2fae8 00000000`00000138
fffff801`7ee2faf0 00000000`00000000
fffff801`7ee2faf8 ffff86a6`03356000
fffff801`7ee2fb00 ffff86a6`00000138
fffff801`7ee2fb08 ffff868e`e83c35a0 win32kfull!draw_clrt_nf_ntb_o_to_temp_start
fffff801`7ee2fb10 ffffce83`3784c010
fffff801`7ee2fb18 ffff86a6`03b27840
fffff801`7ee2fb20 ffff86a6`00911000
fffff801`7ee2fb28 ffff86a6`0312a4e8
fffff801`7ee2fb30 ffff86a6`0312a600
fffff801`7ee2fb38 ffff86a6`03b27840
fffff801`7ee2fb40 ffff868e`e83c35a0 win32kfull!draw_clrt_nf_ntb_o_to_temp_start
fffff801`7ee2fb48 ffff868e`e8559d80 win32kfull!draw_clrt_f_ntb_o_to_temp_start
fffff801`7ee2fb50 ffff86a6`03360000
fffff801`7ee2fb58 fffff801`7e407bae nt!ExAcquirePushLockExclusiveEx+0xee
fffff801`7ee2fb60 ffff9a8e`065f7080
fffff801`7ee2fb68 ffff86a6`00200280
fffff801`7ee2fb70 00000000`00000000
fffff801`7ee2fb78 00000000`00000000
fffff801`7ee2fb80 00000000`00000000
fffff801`7ee2fb88 ffff86a6`00200290
fffff801`7ee2fb90 00000000`00000022
fffff801`7ee2fb98 00000000`00000210
fffff801`7ee2fba0 00000000`00000000
fffff801`7ee2fba8 ffffce83`3784b85c
fffff801`7ee2fbb0 ffff86a6`00911000
fffff801`7ee2fbb8 00000000`00000000
fffff801`7ee2fbc0 00000000`00000000
fffff801`7ee2fbc8 fffff801`7e4dc26a nt!RtlpHpReleaseQueuedLockExclusive+0×20a
fffff801`7ee2fbd0 ffffce83`3784b9e0
fffff801`7ee2fbd8 ffff86a6`00200280
fffff801`7ee2fbe0 00000000`00040246
fffff801`7ee2fbe8 fffff801`7e49af8b nt!KeQueryCurrentStackInformationEx+0×8b
fffff801`7ee2fbf0 00000000`00000000
fffff801`7ee2fbf8 ffffce83`3784b9e0
fffff801`7ee2fc00 00000000`00000210
fffff801`7ee2fc08 ffff86a6`03358a60
fffff801`7ee2fc10 ffffce83`3784d000
fffff801`7ee2fc18 ffffce83`37847000
fffff801`7ee2fc20 00000000`00000000
fffff801`7ee2fc28 ffffce83`3784bf00
fffff801`7ee2fc30 00000000`00000000
fffff801`7ee2fc38 00000000`00000000
fffff801`7ee2fc40 ffffce83`3784b9f8
fffff801`7ee2fc48 fffff801`7e4e6aae nt!KeQueryCurrentStackInformation+0×2e
fffff801`7ee2fc50 ffffce83`3784ba10
fffff801`7ee2fc58 ffffce83`3784ba18
fffff801`7ee2fc60 ffffce83`3784ba60
fffff801`7ee2fc68 00000000`00000000
fffff801`7ee2fc70 00000000`00000008
fffff801`7ee2fc78 fffff801`7e7119e1 nt!KeBugCheck2+0×231
fffff801`7ee2fc80 00000000`00000000
fffff801`7ee2fc88 00000000`00000000
fffff801`7ee2fc90 00000000`00000000
fffff801`7ee2fc98 ffffce83`3784c8a8
fffff801`7ee2fca0 ffffce83`3784b9d0
fffff801`7ee2fca8 fffff801`7e65a4dc nt!RtlDispatchException+0×17399c
fffff801`7ee2fcb0 ffffce83`3784bed0
fffff801`7ee2fcb8 00000000`00000000
fffff801`7ee2fcc0 ffffce83`3784c0e0
fffff801`7ee2fcc8 00000000`00000000
fffff801`7ee2fcd0 00000101`01000000
fffff801`7ee2fcd8 ffff9a8e`065f7080
fffff801`7ee2fce0 00000000`0000001e
fffff801`7ee2fce8 00000000`00000000
fffff801`7ee2fcf0 00000000`0000000f
fffff801`7ee2fcf8 fffff801`7caf2100
fffff801`7ee2fd00 00000000`00000000
fffff801`7ee2fd08 00000000`00000000
fffff801`7ee2fd10 00000000`00000000
fffff801`7ee2fd18 ffff86a6`00000004
fffff801`7ee2fd20 00000000`00000000
fffff801`7ee2fd28 ffff86a6`03350010
fffff801`7ee2fd30 ffffce83`3784d000
fffff801`7ee2fd38 ffffce83`37847000
fffff801`7ee2fd40 fffff801`7e712bd0 nt!KiBugCheckProgress
fffff801`7ee2fd48 fffff801`7e489594 nt!ExFreeHeapPool+0×4d4
fffff801`7ee2fd50 00000000`00000000
fffff801`7ee2fd58 00000000`00000000
fffff801`7ee2fd60 00000000`00000000
fffff801`7ee2fd68 00000000`00000000
fffff801`7ee2fd70 00000000`00000000
fffff801`7ee2fd78 00000000`00000000
fffff801`7ee2fd80 00000000`00000000
fffff801`7ee2fd88 00000000`00000000
fffff801`7ee2fd90 00000000`00000000
fffff801`7ee2fd98 00000000`00000000
fffff801`7ee2fda0 00000000`00000000
fffff801`7ee2fda8 00000000`00000000
fffff801`7ee2fdb0 00000000`00000000
fffff801`7ee2fdb8 00000000`00000000
fffff801`7ee2fdc0 00000000`00000000
fffff801`7ee2fdc8 00000000`00000000
fffff801`7ee2fdd0 00000000`00000000
fffff801`7ee2fdd8 00000000`00000000
fffff801`7ee2fde0 00000000`00000000
fffff801`7ee2fde8 00000000`00000000
fffff801`7ee2fdf0 00000000`00000000
fffff801`7ee2fdf8 fffff801`7e40ac67 nt!ExReleasePushLockSharedEx+0×37
fffff801`7ee2fe00 ffff9a8e`00000002
fffff801`7ee2fe08 ffff86a6`00001f80
fffff801`7ee2fe10 ffff86a6`006136a0
fffff801`7ee2fe18 ffff86a6`0329ccd0
fffff801`7ee2fe20 00000000`000000bd
fffff801`7ee2fe28 ffff86a6`0329ccd0
fffff801`7ee2fe30 ffff86a6`03ac53f0
fffff801`7ee2fe38 ffff868e`e807e1d9 win32kbase!NSInstrumentation::CPlatformReaderWriterLock::ReleaseShared+0×19
fffff801`7ee2fe40 ffff86a6`006163d0
fffff801`7ee2fe48 ffff868e`00000003
fffff801`7ee2fe50 00000000`00000000
fffff801`7ee2fe58 ffff9a8e`00831120
fffff801`7ee2fe60 00000000`00000000
fffff801`7ee2fe68 ffff868e`e8123442 win32kbase!NSInstrumentation::CTypeIsolation<28672,112>::Free+0×8e
fffff801`7ee2fe70 00000000`00000000
fffff801`7ee2fe78 ffff86a6`006136a0
fffff801`7ee2fe80 ffff86a6`000000df
fffff801`7ee2fe88 00000000`00000000
fffff801`7ee2fe90 00000000`00000000
fffff801`7ee2fe98 ffff86a6`03358a70
fffff801`7ee2fea0 00000000`00000000
fffff801`7ee2fea8 ffff86a6`03358a90
fffff801`7ee2feb0 ffffce83`3784bcc0
fffff801`7ee2feb8 ffff868e`e837897f win32kfull!EngTextOut+0×68f
fffff801`7ee2fec0 ffff86a6`03358a90
fffff801`7ee2fec8 ffff86a6`03b27840
fffff801`7ee2fed0 ffffce83`3784bcc0
fffff801`7ee2fed8 00000000`00000005
fffff801`7ee2fee0 ffff86a6`03358a90
fffff801`7ee2fee8 ffff86a6`00000024
fffff801`7ee2fef0 00000000`00000000
fffff801`7ee2fef8 00000000`00000000
fffff801`7ee2ff00 00000000`00000000
fffff801`7ee2ff08 00000000`00000000
fffff801`7ee2ff10 00000000`00000000
fffff801`7ee2ff18 00000000`00000000
fffff801`7ee2ff20 00000000`00000000
fffff801`7ee2ff28 00000000`00000000
fffff801`7ee2ff30 00000000`00000000
fffff801`7ee2ff38 00000000`00000000
fffff801`7ee2ff40 00000000`00000000
fffff801`7ee2ff48 00000000`00000000
fffff801`7ee2ff50 00000000`00000000
fffff801`7ee2ff58 00000000`00000000
fffff801`7ee2ff60 00000000`00000000
fffff801`7ee2ff68 00000000`00000000
fffff801`7ee2ff70 00000000`00000000
fffff801`7ee2ff78 00000000`00000000
fffff801`7ee2ff80 00000000`00000000
fffff801`7ee2ff88 00000000`00000000
fffff801`7ee2ff90 ffffce83`3784c5d0
fffff801`7ee2ff98 00000000`00000000
fffff801`7ee2ffa0 ffff86a6`00000000
fffff801`7ee2ffa8 ffff86a6`03b27840
fffff801`7ee2ffb0 ffff86a6`03116220
fffff801`7ee2ffb8 00000000`000001d4
fffff801`7ee2ffc0 00000000`00000000
fffff801`7ee2ffc8 ffff86a6`03b27840
fffff801`7ee2ffd0 ffff86a6`03b27858
fffff801`7ee2ffd8 ffffce83`3784c68c
fffff801`7ee2ffe0 ffff86a6`0312a4e8
fffff801`7ee2ffe8 ffff86a6`0312a600
fffff801`7ee2fff0 ffff86a6`03b27840
fffff801`7ee2fff8 00000000`00000000
fffff801`7ee30000 00000000`00000000
fffff801`7ee30008 ffff86a6`03358a90
fffff801`7ee30010 00000000`00000000
fffff801`7ee30018 00000000`000000d0
fffff801`7ee30020 ffff86a6`03116220
fffff801`7ee30028 00000000`00000000
fffff801`7ee30030 00000000`00000000
fffff801`7ee30038 00000000`00000000
fffff801`7ee30040 00000000`00000000
fffff801`7ee30048 00000000`00000000
fffff801`7ee30050 00000000`00000000
fffff801`7ee30058 00000000`00000000
fffff801`7ee30060 00000000`00000000
fffff801`7ee30068 00000000`00000000
fffff801`7ee30070 00000000`00000000
fffff801`7ee30078 00000000`00000000
fffff801`7ee30080 00000000`00000000
fffff801`7ee30088 00000000`00000000
fffff801`7ee30090 00000000`00000000
fffff801`7ee30098 00000000`00000000
fffff801`7ee300a0 00000000`00000000
fffff801`7ee300a8 00000000`00000000
fffff801`7ee300b0 00000000`00000000
fffff801`7ee300b8 00000000`00000000
fffff801`7ee300c0 00000000`00000000
fffff801`7ee300c8 00000000`00000000
fffff801`7ee300d0 00000000`00000000
fffff801`7ee300d8 00000000`00000000
fffff801`7ee300e0 00000000`00000000
fffff801`7ee300e8 00000000`00000000
fffff801`7ee300f0 00000000`00000000
fffff801`7ee300f8 00000000`00000000
fffff801`7ee30100 00000000`00000000
fffff801`7ee30108 00000000`00000000
fffff801`7ee30110 00000000`00040293
fffff801`7ee30118 fffff801`7e49af8b nt!KeQueryCurrentStackInformationEx+0×8b
fffff801`7ee30120 00000000`00000000
fffff801`7ee30128 00000000`00000000
fffff801`7ee30130 00000000`00000000
fffff801`7ee30138 00000000`00000000
fffff801`7ee30140 ffffce83`3784d000
fffff801`7ee30148 ffffce83`37847000
fffff801`7ee30150 00000000`00000000
fffff801`7ee30158 00000000`00000000
fffff801`7ee30160 00000000`00000000
fffff801`7ee30168 fffff801`7e4e9cc6 nt!RtlGetExtendedContextLength2+0×46
fffff801`7ee30170 00000000`00000000
fffff801`7ee30178 fffff801`7e4e6a64 nt!RtlpGetStackLimitsEx+0×14
fffff801`7ee30180 ffffce83`3784c0e0
fffff801`7ee30188 ffffce83`3784c8a8
fffff801`7ee30190 00000001`00000010
fffff801`7ee30198 ffffce83`3784c0e0
fffff801`7ee301a0 ffffce83`3784c0a0
fffff801`7ee301a8 fffff801`7e4e6c59 nt!RtlDispatchException+0×119
fffff801`7ee301b0 ffffce83`3784c0e0
fffff801`7ee301b8 00000000`00000000
fffff801`7ee301c0 000004e8`fffffb30
fffff801`7ee301c8 000004d0`fffffb30
fffff801`7ee301d0 00000000`00000019
fffff801`7ee301d8 ffff86a6`03360000
fffff801`7ee301e0 ffffce83`3784c5d0
fffff801`7ee301e8 ffff86a6`0312a688
fffff801`7ee301f0 00000000`00000000
fffff801`7ee301f8 000004f7`00000000
fffff801`7ee30200 00000000`00000000
fffff801`7ee30208 ffffce83`3784d000
fffff801`7ee30210 ffffce83`37847000
fffff801`7ee30218 ffffce83`3784bea0
fffff801`7ee30220 00000000`00000000
fffff801`7ee30228 00000000`00000000
fffff801`7ee30230 00000000`00000000
fffff801`7ee30238 ffffce83`3784c8a8
fffff801`7ee30240 00000000`00000000
fffff801`7ee30248 00000000`00000000
fffff801`7ee30250 00000000`00000000
fffff801`7ee30258 00000000`00000000
fffff801`7ee30260 00000000`00000000
fffff801`7ee30268 00000000`00000000
fffff801`7ee30270 00000000`00000000
fffff801`7ee30278 00000000`00000000
fffff801`7ee30280 00000000`00000000
fffff801`7ee30288 00000000`00000000
fffff801`7ee30290 ffffce83`3784c0e0
fffff801`7ee30298 ffff86a6`00615054
fffff801`7ee302a0 00000000`00000000
fffff801`7ee302a8 ffffffff`ffffffff
fffff801`7ee302b0 00000000`00000000
fffff801`7ee302b8 00000000`00000000
fffff801`7ee302c0 00000000`00000000
fffff801`7ee302c8 00000000`00000000
fffff801`7ee302d0 00000000`00000000
fffff801`7ee302d8 00000000`00000000
fffff801`7ee302e0 00000000`00000000
fffff801`7ee302e8 00000000`00000000
fffff801`7ee302f0 00000000`00000000
fffff801`7ee302f8 00000000`00000000
fffff801`7ee30300 00000000`00000000
fffff801`7ee30308 00000000`00000000
fffff801`7ee30310 00000000`00000000
fffff801`7ee30318 00000000`00000000
fffff801`7ee30320 00000000`00000000
fffff801`7ee30328 00000000`00000000
fffff801`7ee30330 00000000`00000000
fffff801`7ee30338 00000000`00000000
fffff801`7ee30340 00000000`00000000
fffff801`7ee30348 00000000`00000000
fffff801`7ee30350 00000000`0010001f
fffff801`7ee30358 ffffce83`3784c950
fffff801`7ee30360 00000000`00000000
fffff801`7ee30368 00000000`00000000
fffff801`7ee30370 00000000`00000000
fffff801`7ee30378 ffffce83`3784c0e0
fffff801`7ee30380 ffffce83`3784c5e0
fffff801`7ee30388 fffff801`7e5f72c7 nt!KeBugCheckEx+0×107
fffff801`7ee30390 ffffce83`3784c8a8
fffff801`7ee30398 ffffce83`3784c5e0
fffff801`7ee303a0 ffffce83`3784c8a8
fffff801`7ee303a8 00000000`00000000
fffff801`7ee303b0 00000000`00000000
fffff801`7ee303b8 00000000`00000000
fffff801`7ee303c0 00000000`00040246
fffff801`7ee303c8 fffff801`7e659ecb nt!KiDispatchException+0×17467b
fffff801`7ee303d0 00000000`0000001e
fffff801`7ee303d8 ffffffff`c0000005
fffff801`7ee303e0 00000000`00000000
fffff801`7ee303e8 00000000`00000008
fffff801`7ee303f0 00000000`00000000
fffff801`7ee303f8 00000000`00000001
fffff801`7ee30400 ffff86a6`0312a600
fffff801`7ee30408 ffff86a6`0312a688
fffff801`7ee30410 ffff86a6`0312a4e8
fffff801`7ee30418 00000000`00000d0d
fffff801`7ee30420 00000001`00000000
fffff801`7ee30428 00000000`00000000
fffff801`7ee30430 00001f80`0010001f
fffff801`7ee30438 0053002b`002b0010
fffff801`7ee30440 00050282`0018002b
fffff801`7ee30448 00000000`00000000
fffff801`7ee30450 00000000`00000000
fffff801`7ee30458 00000000`00000000
fffff801`7ee30460 00000000`00000000
fffff801`7ee30468 00000000`00000000
fffff801`7ee30470 00000000`00000000
[…]
fffff801`7ee310c0 00000000`00000000
fffff801`7ee310c8 ffffce83`00000000
fffff801`7ee310d0 ffff86a6`00000001
fffff801`7ee310d8 00000000`00000000
fffff801`7ee310e0 ffffaa81`e634c9c0
fffff801`7ee310e8 fffff801`7e608bb5 nt!KiSystemServiceCopyEnd+0×25
fffff801`7ee310f0 00000000`00000000
fffff801`7ee310f8 ffff1496`0a767479
fffff801`7ee31100 00000000`0002034c
fffff801`7ee31108 000002aa`2d0d0180
fffff801`7ee31110 000000ce`1b2feac0
fffff801`7ee31118 00000023`83360010
fffff801`7ee31120 00000000`00000000
fffff801`7ee31128 00000000`00000000
fffff801`7ee31130 00000000`00000000
fffff801`7ee31138 00000000`00000000
fffff801`7ee31140 ffff9a8e`065f7080
fffff801`7ee31148 00000000`00000000
fffff801`7ee31150 ffff9a8e`065f7080
fffff801`7ee31158 fffff801`7e608bb5 nt!KiSystemServiceCopyEnd+0×25
fffff801`7ee31160 00000000`00000001
fffff801`7ee31168 ffffce83`38b5db80
fffff801`7ee31170 000002aa`00000000
fffff801`7ee31178 ffff868e`e8876c88 win32k!NtUserKillTimer
fffff801`7ee31180 000000ce`00000000
fffff801`7ee31188 00001f80`02080000
fffff801`7ee31190 00000000`00000007
fffff801`7ee31198 00000000`000001e4
fffff801`7ee311a0 00000000`00000000
fffff801`7ee311a8 000000ce`1b2ff5b8
fffff801`7ee311b0 000000ce`1b2ff689
fffff801`7ee311b8 00000000`00000000
fffff801`7ee311c0 00000000`00000246
fffff801`7ee311c8 000000ce`1b0a7000
fffff801`7ee311d0 00000000`00000000
fffff801`7ee311d8 00000000`00000000
fffff801`7ee311e0 00000000`00000000
fffff801`7ee311e8 00000000`00000000
fffff801`7ee311f0 00000000`00000000
fffff801`7ee311f8 00000000`00000000
fffff801`7ee31200 00000000`00000000
fffff801`7ee31208 00000000`00000000
fffff801`7ee31210 00000000`00000000
fffff801`7ee31218 00000000`00000000
fffff801`7ee31220 00000000`00000000
fffff801`7ee31228 00000000`00000000
fffff801`7ee31230 00007ffb`8a73a5c2
fffff801`7ee31238 00000000`00000000
fffff801`7ee31240 00000000`00000000
fffff801`7ee31248 00000000`00000000
fffff801`7ee31250 00000000`00000000
fffff801`7ee31258 00000000`00000000
fffff801`7ee31260 00000000`00000000
fffff801`7ee31268 00000000`00000000
fffff801`7ee31270 00000000`00000000
fffff801`7ee31278 00000000`00000000
fffff801`7ee31280 00000000`00000000
fffff801`7ee31288 00000000`00000000
fffff801`7ee31290 00000000`00000000
fffff801`7ee31298 00000000`00000000
fffff801`7ee312a0 00000000`00000000
fffff801`7ee312a8 00000000`000001e4
fffff801`7ee312b0 00000000`00000000
fffff801`7ee312b8 00000000`000001e4
fffff801`7ee312c0 00000000`00000100
fffff801`7ee312c8 00007ffb`8dc6ce54
fffff801`7ee312d0 00000000`00000033
fffff801`7ee312d8 00000000`00000246
fffff801`7ee312e0 000000ce`1b2fea68
fffff801`7ee312e8 00000000`0000002b
fffff801`7ee312f0 ffffce83`3784d000
fffff801`7ee312f8 ffffce83`37847000
fffff801`7ee31300 ffffce83`38b5e000
fffff801`7ee31308 ffffce83`38b58000
fffff801`7ee31310 ffffce83`38b5d420
fffff801`7ee31318 ffffce83`38b5dc90
fffff801`7ee31320 ffff9a8e`002f9448

- Dmitry Vostokov @ DumpAnalysis.org + TraceAnalysis.org -

Crash Dump Analysis Patterns (Part 277)

September 27th, 2021

When looking at the kernel and complete memory dumps, the current thread running on the current processor (!thread) may not belong to the current process (not listed in the output of !process WinDbg command). This observation happens when a thread that is owned by one process gets attached to the second process:

0: kd> !thread
THREAD ffffa902d2ff8080 Cid 1f00.02c0 Teb: 000000836c677000 Win32Thread: 0000000000000000 RUNNING on processor 0
IRP List:
ffffa902d0afabb0: (0006,0118) Flags: 00060000 Mdl: 00000000
Not impersonating
DeviceMap ffffba81b0037600
Owning Process ffffa902d1581080 Image: OriginalProcess.exe
Attached Process ffffa902cf41a080 Image: NewProcess.exe
Wait Start TickCount 136814 Ticks: 3 (0:00:00:00.046)
Context Switch Count 4 IdealProcessor: 0
UserTime 00:00:00.000
KernelTime 00:00:00.046
Win32 Start Address 0×00007ff62aabf010
Stack Init ffffe10adff87c90 Current ffffe10adff876a0
Base ffffe10adff88000 Limit ffffe10adff82000 Call 0000000000000000
Priority 14 BasePriority 8 PriorityDecrement 80 IoPriority 2 PagePriority 5
[…]

In this way, a thread can access another process space. We call such analysis pattern Shared Thread. Another example is process creation resulting in Hidden Process. Such Shared Threads can also be found in Stack Trace Collection.

- Dmitry Vostokov @ DumpAnalysis.org + TraceAnalysis.org -

Trace Analysis Patterns (Part 212)

September 11th, 2021

Even if traces and logs are perfectly synchronized (Unsynchronized Traces) we me still get Unsynchronized Messages. If respective message times are the same (can depend on time resolution) we don’t know which one was first. This is visible if we do Trace Mask using different order:

If both messages belong to the same Thread of Activity we may be able to reorder them correctly based on additional message semantics, such as module hierarchy (for example, OS runtime library and application code that are traced separately).

- Dmitry Vostokov @ DumpAnalysis.org + TraceAnalysis.org -

Trace Analysis Patterns (Part 211)

August 29th, 2021

Usually, when we find an interesting message in a log (maybe also a frame from Exception Stack Trace), especially from an unfamiliar component, we also want to search past problem cases either on the Internet or in some internal database. However, we just put the message as is or some small fragment of it we may get a lot of noise results. The problem is to find the optimal Message Essence. Often, this is done by omitting variable data (including Adjoint Thread of Activity fields) but leaving Message Invariants and Trace Constants usually refine a diagnostic error:

This analysis pattern is different from Message Invariant. where the latter is useful when finding its emitter’s source code lines (PLOT).

- Dmitry Vostokov @ DumpAnalysis.org + TraceAnalysis.org -

Trace Analysis Patterns (Part 210)

August 11th, 2021

When we have different traces and logs not necessarily with the same Trace Schema and select only messages that have some condition, for example, the same ATID (see Adjoint Thread of Activity) or FID (see Feature of Activity) value, we get the new trace that we call Trace Join. A combination of ATID from one trace or Message Set from another is also possible as illustrated in this allegorical picture when joining is done by “Plato” author value or title containing “Plato” (all case-insensitive):

This is very similar to relational data joins. Join of the same trace is possible too. A Dia|gram picture (similar to the previous patterns) is left as an exercise.

We initially wanted to call this analysis pattern Filtered Mask but later realized that it may not be possible to do Trace Mask if there is no global ordering information, such as time. In such a case, Serial Trace is possible. 

- Dmitry Vostokov @ DumpAnalysis.org + TraceAnalysis.org -

Trace Analysis Patterns (Part 209)

August 10th, 2021

The name of this pattern, Container Trace, originates from the logging style that is recommended as the best practice for containers (like Docker), where various components output their tracing and logging statements to the standard console output. Such components may have their own incompatible Trace Schemas, for example, normal trace messages intermingled with Exception Stack Traces. However, in general, this pattern can be extended to any log file (a container for trace statements). This pattern is different from Trace Mask, where individual traces come from separate files and have Trace Schema with some ATID (see Adjoint Thread of Activity) or FID (see Feature of Activity), such as time, that allows for blending them correctly. Components that output their messages to Container Trace may not even have any internal Trace Schema. In such a case, Container Trace may simply be treated as Text Trace.

- Dmitry Vostokov @ DumpAnalysis.org + TraceAnalysis.org -

15th Anniversary

June 17th, 2021

To celebrate 15 (0xF) years of Software Diagnostics Library (former Crash Dump Analysis blog) this August, Software Diagnostics Services opens a Summer sale of Memory Dump Analysis Anthology Volume Set in PDF format with a 50% discount. It also includes Volume 14 once it is published on the anniversary date. The sale end date is undefined and equals to min(salesTarget.dateAchieved(), Date(“14-August-2021”)). https://www.patterndiagnostics.com/mdaa-volumes

Trace Analysis Patterns (Part 208)

May 29th, 2021

Most of the time tracing and logging is done sequentially, for example, when a service or application is restarted after the crash or bug fix, or the host is rebooted. Then we can glue all resulted traces together (similar to Glued Stack Trace) into one large Serial Trace. Here we assume the same Trace Schema for all individual traces and logs. It can also be considered as flattening a 2-dimensional Trace Tensor:

This allows us to apply various trace and log analysis patterns to the unified Serial Trace instead of doing Inter-Correlation (vs. Intra-Correlation).

Serial Trace is different from Meta Trace which is a trace about trace and Master Trace which is a trace we compare all other traces to. It is similar to Trace Mask when there is no overlap in time. Also, Serial Trace is not a reverse of Split Trace in a general case due to Visibility Limits between individual traces.

When gluing traces together, Ornament messages may be added to serve as a boundary between fragments.

- Dmitry Vostokov @ DumpAnalysis.org + TraceAnalysis.org -

Trace Analysis Patterns (Part 207)

April 26th, 2021

Trace Schema can be represented as Schema Trace or, avoiding naming confusion, Definition Trace. The resulting trace looses ordering (similar to unordered Message Set) but allows application of trace and log analysis patterns, especially if some order is fixed, for example, alphabetical for names or original presentation column arrangement. Schema definition Trace Schema can be represented as another Definition Trace as illustrated in the following diagram:

- Dmitry Vostokov @ DumpAnalysis.org + TraceAnalysis.org -

Trace Analysis Patterns (Part 206)

April 11th, 2021

Most of trace and log analysis pattern illustrations using Dia|gram language are of these two general forms:

Although the first form represents typical ETW trace attributes, the analysis pattern descriptions are usually independent of attribute name semantics. It, therefore, makes sense to generalize such forms into the following Trace Schema forms, with ATIDs for Adjoint Threads of Activity for the first form, and with FIDs for Features of Activity for the second form:

Such Trace Schemas are useful for various trace and log joins other than Trace Mask.

- Dmitry Vostokov @ DumpAnalysis.org + TraceAnalysis.org -

Crash Dump Analysis Patterns (Part 213b)

April 9th, 2021

Previously we introduced Rough Stack Trace analysis pattern for unmanaged space. However, similar collection of symbolic references is possible for managed space (without included unmanaged references we see in Caller-n-Callee). Although the output is noisy, it can be filtered by external tools. The simple WinDbg script outputs managed method descriptors from a stack segment where boundaries were taken from the output of !teb command (this works even for complete memory dumps with .NET Core SOS extension after switching to the appropriate process context):

1: kd> .for (r $t0=000000a7d4d9c000; @$t0 < 000000a7d4db0000; r $t0=@$t0+@$ptrsize) {.if (poi(@$t0) > 7ff000000000) { .printf "---\n"; !IP2MD poi(@$t0) }}
[...]
Failed to request MethodData, not in JIT code range
---
MethodDesc:   00007ff8f7da4fd8
Method Name:          System.Windows.Forms.Application.Run(System.Windows.Forms.Form)
Class:                00007ff8f7d9c1f0
MethodTable:          00007ff8f7da50b0
mdToken:              0000000006000AB8
Module:               00007ff8f7c599a0
IsJitted:             yes
Current CodeAddr:     00007ff953059310
Version History:
ILCodeVersion:      0000000000000000
ReJIT ID:           0
IL Addr:            00007ff952a055d7
CodeAddr:           00007ff953059310  (ReadyToRun)
NativeCodeVersion:  0000000000000000

MethodDesc:   00007ff8f7c26d98
Method Name:          LINQPad.UIProgram.Run()
Class:                00007ff8f7c32d30
MethodTable:          00007ff8f7c28280
mdToken:              00000000060001AF
Module:               00007ff8f7bc2780
IsJitted:             yes
Current CodeAddr:     00007ff8f8328c50
Version History:
ILCodeVersion:      0000000000000000
ReJIT ID:           0
IL Addr:            000002316969a53c
CodeAddr:           00007ff8f8328c50  (MinOptJitted)
NativeCodeVersion:  0000000000000000

MethodDesc:   00007ff8f7c26c60
Method Name:          LINQPad.UIProgram.Go(System.String[])
Class:                00007ff8f7c32d30
MethodTable:          00007ff8f7c28280
mdToken:              00000000060001A4
Module:               00007ff8f7bc2780
IsJitted:             yes
Current CodeAddr:     00007ff8f7f23890
Version History:
ILCodeVersion:      0000000000000000
ReJIT ID:
IL Addr:            0000023169699840
CodeAddr:           00007ff8f7f23890  (MinOptJitted)
NativeCodeVersion:  0000000000000000

Failed to request MethodData, not in JIT code range

MethodDesc:   00007ff8f7c26c00
Method Name:          LINQPad.UIProgram.Start(System.String[])
Class:                00007ff8f7c32d30
MethodTable:          00007ff8f7c28280
mdToken:              00000000060001A0
Module:               00007ff8f7bc2780
IsJitted:             yes
Current CodeAddr:     00007ff8f7b2fce0
Version History:
ILCodeVersion:      0000000000000000
ReJIT ID:           0
IL Addr:            00000231696996fc
CodeAddr:           00007ff8f7b2fce0  (MinOptJitted)
NativeCodeVersion:  0000000000000000

MethodDesc:   00007ff8f7bc64d8
Method Name:          LINQPad.UI.Loader.Main(System.String[])
Class:                00007ff8f7c09508
MethodTable:          00007ff8f7bc64f0
mdToken:              0000000006000346
Module:               00007ff8f7bc2780
IsJitted:             yes
Current CodeAddr:     00007ff8f7b26400
Version History:
ILCodeVersion:      0000000000000000
ReJIT ID:           0
IL Addr:            00000231696ab048
CodeAddr:           00007ff8f7b26400  (MinOptJitted)
NativeCodeVersion:  0000000000000000

Failed to request MethodData, not in JIT code range

Failed to request MethodData, not in JIT code range

Failed to request MethodData, not in JIT code range

Failed to request MethodData, not in JIT code range

[…]

- Dmitry Vostokov @ DumpAnalysis.org + TraceAnalysis.org -

Trace Analysis Patterns (Part 205)

April 4th, 2021

When looking at trace and log messages we are usually interested in some features (for example, when doing feature engineering, but not limited to) which can be labelled via Feature IDs (FID). Messages that have the same FID value constitute Feature of Activity, similar to Thread of Activity (or Adjoint Thread of Activity).

Such Features of Activity can span several (A)TIDs in contrast to Fibers of Activity which are confined to the same (A)TID and may have different FID values. Therefore, inside (A)TID there can be several Features of Activity having different FID values.

This analysis pattern serves as a base for other data science analysis patterns we add next.

- Dmitry Vostokov @ DumpAnalysis.org + TraceAnalysis.org -

Crash Dump Analysis Patterns (Part 276)

April 3rd, 2021

In simple exception cases, we have exception record, for example from Stored Exception corresponding to exception context, for example:

0:000> .exr -1
ExceptionAddress: 00000001400247ae (TestWER64!CTestDefaultDebuggerDlg::OnBnClickedButton1+0×000000000000007e)
ExceptionCode: c0000005 (Access violation)
ExceptionFlags: 00000000
NumberParameters: 2
Parameter[0]: 0000000000000001
Parameter[1]: 0000000000000000
Attempt to write to address 0000000000000000

0:000> .ecxr
rax=0000000000000000 rbx=0000000000000001 rcx=000000000014fd20
rdx=00000000000003e8 rsi=000000000014fd20 rdi=000000014002daa0
rip=00000001400247ae rsp=000000000014efd0 rbp=0000000000000111
r8=0000000000000000  r9=0000000140024730 r10=0000000140024730
r11=000000000014f0d0 r12=0000000000000000 r13=00000000000003e8
r14=0000000000000110 r15=0000000000000001
iopl=0         nv up ei pl zr na po nc
cs=0033  ss=002b  ds=002b  es=002b  fs=0053  gs=002b             efl=00010246
TestWER64!CTestDefaultDebuggerDlg::OnBnClickedButton1+0×7e:
00000001`400247ae
c704250000000000000000 mov dword ptr [0],0 ds:00000000`00000000=????????

In other cases, we may have missing context:

0:000> .excr
Minidump doesn't have an exception context
Unable to get exception context, HRESULT 0x80004002

invalid context (see also Invalid Exception Information) in the output of !analyze -v command:

CONTEXT:  00007ffb54bd1e60 -- (.cxr 0x7ffb54bd1e60)
rax=15ff480001191885 rbx=ff48c88b48000000 rcx=00441f0f00044c3c
rdx=08ba3824448d4c00 rsi=4838244c8b480001 rdi=0058b9413024448d
rip=00441f0f00044a04 rsp=441f0f00044bd315 rbp=18e4840fc0850000
r8=4c20244489480000  r9=244c89444024448d r10=15ff48a9518d4130
r11=00441f0f00044ebc r12=0118c1840fc08500 r13=8b4840244c8b4800
r14=d88b0000003ee8d7 r15=15ff4838244c8b48
iopl=0 vip vif ov dn ei pl nz na pe nc
cs=2183  ss=044c  ds=4800  es=f98b  fs=ff48  gs=5315             efl=441f0f00
00441f0f`00044a04 ??              ???
Resetting default scope

and valid context but not corresponding to stored exception record:

0:000> .ecxr
rax=00007ffe0a6a9618 rbx=0000024a3aa44020 rcx=0000000100000001
rdx=0000000000000001 rsi=0000024a3abff3e8 rdi=0000024a3abfb5c8
rip=00007ffe9768d759 rsp=000000dc0fd7caf0 rbp=000000dc0fd7d160
r8=0000024a00000007  r9=0000024a5ce8bc80 r10=0000000000000000
r11=0000000000000000 r12=0000024a3abfad90 r13=0000024a3aa44020
r14=0000000000000000 r15=0000024a3abfb5e0
iopl=0         nv up ei pl nz na pe nc
cs=0033  ss=002b  ds=002b  es=002b  fs=0053  gs=002b             efl=00000202
KERNELBASE!RaiseException+0x69:
00007ffe`9768d759 0f1f440000      nop     dword ptr [rax+rax]

0:000> .exr -1
ExceptionAddress: 00007ffe0a6a9609
ExceptionCode: c0000005 (Access violation)
ExceptionFlags: 00000000
NumberParameters: 2
Parameter[0]: 0000000000000001
Parameter[1]: 0000000000000000
Attempt to write to address 0000000000000000

However, Exception Stack Trace may be available with JIT Code address :

0:000> kL
# Child-SP          RetAddr           Call Site
00 000000dc`0fd7b558 00007ffe`976b0d40 ntdll!NtWaitForMultipleObjects+0x14
01 000000dc`0fd7b560 00007ffe`976b0c3e KERNELBASE!WaitForMultipleObjectsEx+0xf0
02 000000dc`0fd7b850 00007ffe`994cf6aa KERNELBASE!WaitForMultipleObjects+0xe
03 000000dc`0fd7b890 00007ffe`994cf0e6 kernel32!WerpReportFaultInternal+0x58a
04 000000dc`0fd7b9b0 00007ffe`9776c439 kernel32!WerpReportFault+0xbe
05 000000dc`0fd7b9f0 00007ffe`99cd4b63 KERNELBASE!UnhandledExceptionFilter+0x3d9
06 000000dc`0fd7bb10 00007ffe`99cbbb16 ntdll!RtlUserThreadStart$filt$0+0xa2
07 000000dc`0fd7bb50 00007ffe`99cd130f ntdll!_C_specific_handler+0x96
08 000000dc`0fd7bbc0 00007ffe`99c7b5e4 ntdll!RtlpExecuteHandlerForException+0xf
09 000000dc`0fd7bbf0 00007ffe`99c7b335 ntdll!RtlDispatchException+0x244
0a 000000dc`0fd7c300 00007ffe`9768d759 ntdll!RtlRaiseException+0x185
0b 000000dc`0fd7caf0 00007ffe`6986b259 KERNELBASE!RaiseException+0x69
0c 000000dc`0fd7cbd0 00007ffe`6986b28b coreclr!NakedThrowHelper2+0x9
0d 000000dc`0fd7cc00 00007ffe`6986b295 coreclr!NakedThrowHelper_RspAligned+0x1e
0e 000000dc`0fd7d128 00007ffe`0a6a9609 coreclr!NakedThrowHelper_FixRsp+0×5
0f 000000dc`0fd7d130 00007ffe`0a548023 0×00007ffe`0a6a9609
10 000000dc`0fd7d170 00007ffe`0a547734 0×00007ffe`0a548023
11 000000dc`0fd7d230 00000000`627311e5 0×00007ffe`0a547734
12 000000dc`0fd7d290 00007ffe`62b50fe7 PresentationCore+0×4011e5
13 000000dc`0fd7d2d0 00007ffe`62a35840 PresentationFramework+0xbb0fe7
14 000000dc`0fd7d310 00007ffe`62b51a60 PresentationFramework+0xa95840
15 000000dc`0fd7d350 00000000`62732e22 PresentationFramework+0xbb1a60
16 000000dc`0fd7d390 00000000`62757c42 PresentationCore+0×402e22
17 000000dc`0fd7d3d0 00007ffe`0a5448f3 PresentationCore+0×427c42
18 000000dc`0fd7d410 00007ffe`0a548023 0×00007ffe`0a5448f3
19 000000dc`0fd7d450 00000000`62740e19 0×00007ffe`0a548023
1a 000000dc`0fd7d510 00000000`62732b6a PresentationCore+0×410e19
1b 000000dc`0fd7d580 00000000`62757c42 PresentationCore+0×402b6a
1c 000000dc`0fd7d5c0 00007ffe`0a5448f3 PresentationCore+0×427c42
1d 000000dc`0fd7d600 00007ffe`0a548023 0×00007ffe`0a5448f3
1e 000000dc`0fd7d640 00007ffe`0a547734 0×00007ffe`0a548023
1f 000000dc`0fd7d700 00007ffe`0a550211 0×00007ffe`0a547734
20 000000dc`0fd7d760 00007ffe`0a558efd 0×00007ffe`0a550211
21 000000dc`0fd7d7a0 00007ffe`0a55ebb1 0×00007ffe`0a558efd
22 000000dc`0fd7d860 00007ffe`0a564474 0×00007ffe`0a55ebb1
23 000000dc`0fd7d8b0 00007ffe`0a550eff 0×00007ffe`0a564474
24 000000dc`0fd7d9e0 00007ffe`0a550692 0×00007ffe`0a550eff
25 000000dc`0fd7da70 00007ffe`0a54967d 0×00007ffe`0a550692
26 000000dc`0fd7dae0 00007ffe`0a549596 0×00007ffe`0a54967d
27 000000dc`0fd7db70 00007ffe`0a548ac7 0×00007ffe`0a549596
28 000000dc`0fd7dbc0 00007ffe`0a5488f5 0×00007ffe`0a548ac7
29 000000dc`0fd7dc20 00007ffe`0a54920c 0×00007ffe`0a5488f5
2a 000000dc`0fd7dc70 00007ffe`0a548f07 0×00007ffe`0a54920c
2b 000000dc`0fd7dd00 00007ffe`09d2d772 0×00007ffe`0a548f07
2c 000000dc`0fd7de00 00007ffe`995ae858 0×00007ffe`09d2d772
2d 000000dc`0fd7de80 00007ffe`995ae299 user32!UserCallWinProcCheckWow+0×2f8
2e 000000dc`0fd7e010 00007ffe`0a18011b user32!DispatchMessageWorker+0×249
2f 000000dc`0fd7e090 00007ffe`69557ec3 0×00007ffe`0a18011b
30 000000dc`0fd7e150 00007ffe`695553a1 WindowsBase+0×197ec3
31 000000dc`0fd7e1e0 00007ffe`6955534e WindowsBase+0×1953a1
32 000000dc`0fd7e210 00007ffe`6276966c WindowsBase+0×19534e
33 000000dc`0fd7e240 00007ffe`62767ccd PresentationFramework+0×7c966c
34 000000dc`0fd7e270 00007ffe`62764c5c PresentationFramework+0×7c7ccd
35 000000dc`0fd7e2c0 00007ffe`09d1618e PresentationFramework+0×7c4c5c
36 000000dc`0fd7e2f0 00007ffe`6986a2f3 0×00007ffe`09d1618e
37 000000dc`0fd7e340 00007ffe`697a2fcc coreclr!CallDescrWorkerInternal+0×83
38 000000dc`0fd7e380 00007ffe`697c22b3 coreclr!MethodDescCallSite::CallTargetWorker+0×268
39 (Inline Function) ——–`——– coreclr!MethodDescCallSite::Call+0xb
3a 000000dc`0fd7e4c0 00007ffe`697c207e coreclr!RunMainInternal+0×11f
3b 000000dc`0fd7e5f0 00007ffe`697c1be1 coreclr!RunMain+0xd2
3c 000000dc`0fd7e6a0 00007ffe`697c1908 coreclr!Assembly::ExecuteMainMethod+0×1cd
3d 000000dc`0fd7ea30 00007ffe`69789ad2 coreclr!CorHost2::ExecuteAssembly+0×1c8
3e 000000dc`0fd7eba0 00007ffe`7d502c72 coreclr!coreclr_execute_assembly+0xe2
3f (Inline Function) ——–`——– hostpolicy!coreclr_t::execute_assembly+0×2b
40 000000dc`0fd7ec40 00007ffe`7d502ed7 hostpolicy!run_app_for_context+0×3be
41 000000dc`0fd7edd0 00007ffe`7d503b6b hostpolicy!run_app+0×37
42 000000dc`0fd7ee10 00007ffe`7d5839ea hostpolicy!corehost_main+0xfb
43 000000dc`0fd7efd0 00007ffe`7d587358 hostfxr!execute_app+0×206
44 (Inline Function) ——–`——– hostfxr!?A0×83a23e19::read_config_and_execute+0×10a
45 000000dc`0fd7f0c0 00007ffe`7d585b5f hostfxr!fx_muxer_t::handle_exec_host_command+0×214
46 000000dc`0fd7f1b0 00007ffe`7d582029 hostfxr!fx_muxer_t::execute+0×39b
47 000000dc`0fd7f2f0 00007ff6`3aede0b0 hostfxr!hostfxr_main_startupinfo+0×89
48 000000dc`0fd7f3f0 00007ff6`3aede418 ApplicationA_exe!exe_start+0×620
49 000000dc`0fd7f5d0 00007ff6`3aedfef8 ApplicationA_exe!wmain+0×124
4a (Inline Function) ——–`——– ApplicationA_exe!invoke_main+0×22
4b 000000dc`0fd7f740 00007ffe`99477034 ApplicationA_exe!__scrt_common_main_seh+0×10c
4c 000000dc`0fd7f780 00007ffe`99c7d0d1 kernel32!BaseThreadInitThunk+0×14
4d 000000dc`0fd7f7b0 00000000`00000000 ntdll!RtlUserThreadStart+0×21

0:000> u 00007ffe`0a6a9609
00007ffe`0a6a9609 c70001000000    mov     dword ptr [rax],1

00007ffe`0a6a960f 90              nop
00007ffe`0a6a9610 90              nop
00007ffe`0a6a9611 488d6500        lea     rsp,[rbp]
00007ffe`0a6a9615 5d              pop     rbp
00007ffe`0a6a9616 c3              ret
00007ffe`0a6a9617 0019            add     byte ptr [rcx],bl
00007ffe`0a6a9619 0502000552      add     eax,52050002h

In the case of .NET Core dump, we can use Saved Exception Context to get the original exception:

0:000> dp coreclr!g_SavedExceptionInfo
00007ffe`69bd57f0  00000000`c0000005 00000000`00000000
00007ffe`69bd5800  00007ffe`0a6a9609 00000000`00000002
00007ffe`69bd5810  00000000`00000001 00000000`00000000
00007ffe`69bd5820  00000000`00000000 00000000`00000000
00007ffe`69bd5830  00000000`00000000 00000000`00000000
00007ffe`69bd5840  00000000`00000000 00000000`00000000
00007ffe`69bd5850  00000000`00000000 00000000`00000000
00007ffe`69bd5860  00000000`00000000 00000000`00000000

0:000> dt coreclr!g_SavedExceptionInfo
+0x000 m_ExceptionRecord : _EXCEPTION_RECORD
+0x0a0 m_ExceptionContext : _CONTEXT
+0x570 m_Crst           : CrstStatic

0:000> .cxr coreclr!g_SavedExceptionInfo+a0
rax=0000000000000000 rbx=0000024a3aa44020 rcx=0000024a3aa1d210
rdx=0000024a3aa44020 rsi=0000024a3abff3e8 rdi=0000024a3abfb5c8
rip=00007ffe0a6a9609 rsp=000000dc0fd7d130 rbp=000000dc0fd7d160
r8=0000024a3abff3e8  r9=0000000000000000 r10=0000000000000000
r11=000000dc0fd7d090 r12=0000024a3abfad90 r13=0000024a3aa44020
r14=0000000000000000 r15=0000024a3abfb5e0
iopl=0         nv up ei pl zr na po nc
cs=0033  ss=002b  ds=002b  es=002b  fs=0053  gs=002b             efl=00010246
00007ffe`0a6a9609 c70001000000    mov     dword ptr [rax],1 ds:00000000`00000000=????????

This may also work in the case of invalid or missing exception information in .NET Core dumps:

0:000> .exr -1
ExceptionAddress: 0000000000000000
ExceptionCode: 80000003 (Break instruction exception)
ExceptionFlags: 00000000
NumberParameters: 0

0:000> .excr
Minidump doesn't have an exception context
Unable to get exception context, HRESULT 0x80004002

0:000> .cxr coreclr!g_SavedExceptionInfo+a0
rax=0000000000000000 rbx=0000024a3aa44020 rcx=0000024a3aa1d210
rdx=0000024a3aa44020 rsi=0000024a3abff3e8 rdi=0000024a3abfb5c8
rip=00007ffe0a6a9609 rsp=000000dc0fd7d130 rbp=000000dc0fd7d160
r8=0000024a3abff3e8  r9=0000000000000000 r10=0000000000000000
r11=000000dc0fd7d090 r12=0000024a3abfad90 r13=0000024a3aa44020
r14=0000000000000000 r15=0000024a3abfb5e0
iopl=0         nv up ei pl zr na po nc
cs=0033  ss=002b  ds=002b  es=002b  fs=0053  gs=002b             efl=00010246
00007ffe`0a6a9609 c70001000000    mov     dword ptr [rax],1 ds:00000000`00000000=????????

In some other unmanaged cases, we can use probe Execution Residue values around some exception processing symbols as in the case of Hidden Exceptions, but this may not work if such values are overwritten or no longer available.

A similar approach is available for .NET Framework despite the type not available:

0:000> x clr!g_SavedExceptionInfo
00007ffc`efc01f40 clr!g_SavedExceptionInfo = <no type information>

0:000> dt clr!g_SavedExceptionInfo
Symbol clr!g_SavedExceptionInfo not found.

0:000> .cxr clr!g_SavedExceptionInfo+a0
rax=0000000000000000 rbx=0000000002f8b8a0 rcx=0000000002f27ee8
rdx=0000000002f8a598 rsi=0000000002f8a598 rdi=0000000002fa1028
rip=00007ffc8fcb0829 rsp=000000000113e5b0 rbp=000000000113e5e0
r8=0000000002fa1028  r9=0000000000000000 r10=00007ff480140018
r11=00007ffc8fba8ae8 r12=0000000000000002 r13=0000000000000202
r14=0000000000000001 r15=0000000000000000
iopl=0         nv up ei pl zr na po nc
cs=0033  ss=002b  ds=002b  es=002b  fs=0053  gs=002b             efl=00010246
00007ffc`8fcb0829 c70001000000    mov     dword ptr [rax],1 ds:00000000`00000000=????????

- Dmitry Vostokov @ DumpAnalysis.org + TraceAnalysis.org -

Trace Analysis Patterns (Part 204)

March 7th, 2021

Trace Intra-Correlation may be quite elaborate and include analysis of 2-dimensional Weaves of Activity. A similar 2-dimensional metaphor can be applied to Inter-Correlation between several artefacts such as traces and logs, configuration information including infrastructure as code (Small DA+TA), telemetry and event streams, memory dumps (Adjoint Spaces, Trace Presheaf, Memory Fibration, State Dump). All these memory patches, layers, and Trace Fabrics are “sewn” together by Braids, Threads, Adjoint Threads, Strands, Cords, and Weaves of Activities. We call this pattern Trace Quilt but analogy with quilting and quilts.

- Dmitry Vostokov @ DumpAnalysis.org + TraceAnalysis.org -

Crash Dump Analysis Patterns (Part 275)

March 3rd, 2021

If we have Step Dumps or Evental Dumps or simply some different memory dumps, for example, from Fiber Bundle and Orbifold memory spaces, we may run debugger commands across them. Then we can track changes in their output like we did in Stack Trace Change analysis pattern. We call the generalization of the latter pattern Structure Sheaf by analogy with structure sheaves of ringed spaces in mathematics. Here we metaphorically treat sequences of debugger commands applied to memory areas (memory structures) as rings of functions on open subsets. We originally wanted to call this analysis pattern Stack Trace (command) for one command and Stack Trace Collection (commands) for a set of commands but realized that the stack trace analogy here makes sense only for sequential memory dumps ordered in time and not for memory dumps taken from different sources.

- Dmitry Vostokov @ DumpAnalysis.org + TraceAnalysis.org -

Crash Dump Analysis Patterns (Part 274)

January 31st, 2021

COM Exceptions are Software Exceptions and their information can be extracted from C++ Exception record as shown in this post. Here we show the case of Nested and Hidden Exceptions.

We see a COM exception raising function on Exception Stack Trace:

0:008> .exr -1
ExceptionAddress: 00007ff97800cadf (ntdll!LdrpICallHandler+0x000000000000000f)
ExceptionCode: c0000409 (Security check failure or stack buffer overrun)
ExceptionFlags: 00000001
NumberParameters: 1
Parameter[0]: 000000000000000a
Subcode: 0xa FAST_FAIL_GUARD_ICALL_CHECK_FAILURE

0:008> kL
*** Stack trace for last set context - .thread/.cxr resets it
# Child-SP          RetAddr           Call Site
00 0000009e`393f9e78 00007ff9`7802184f ntdll!LdrpICallHandler+0xf
01 0000009e`393f9e80 00007ff9`77fea889 ntdll!RtlpExecuteHandlerForException+0xf
02 0000009e`393f9eb0 00007ff9`780204be ntdll!RtlDispatchException+0x219
03 0000009e`393fa5c0 00007ff9`7800cb9e ntdll!KiUserExceptionDispatch+0x2e
04 0000009e`393fad78 00007ff9`72591030 ntdll!LdrpDispatchUserCallTarget+0xe
05 0000009e`393fad80 00007ff9`72594a52 VCRUNTIME140_APP!_CallSettingFrame+0x20
06 0000009e`393fadb0 00007ff9`7259e514 VCRUNTIME140_APP!__FrameHandler3::FrameUnwindToState+0x112
07 0000009e`393fae20 00007ff9`72593cc8 VCRUNTIME140_APP!__FrameHandler3::FrameUnwindToEmptyState+0x54
08 0000009e`393fae50 00007ff9`7259ee51 VCRUNTIME140_APP!__InternalCxxFrameHandler<__FrameHandler3>+0x10c
09 0000009e`393faeb0 00007ff8`f83ea850 VCRUNTIME140_APP!__CxxFrameHandler3+0x71
0a 0000009e`393faf00 00007ff9`780218cf PaintStudio_ViewModel!DllGetActivationFactory+0x100
0b 0000009e`393faf30 00007ff9`77f9d9b2 ntdll!RtlpExecuteHandlerForUnwind+0xf
0c 0000009e`393faf60 00007ff9`7259e9de ntdll!RtlUnwindEx+0x522
0d 0000009e`393fb670 00007ff9`72592955 VCRUNTIME140_APP!__FrameHandler3::UnwindNestedFrames+0xee
0e 0000009e`393fb760 00007ff9`72592d81 VCRUNTIME140_APP!CatchIt<__FrameHandler3>+0xb9
0f 0000009e`393fb800 00007ff9`72593dc4 VCRUNTIME140_APP!FindHandler<__FrameHandler3>+0x33d
10 0000009e`393fb970 00007ff9`7259ee51 VCRUNTIME140_APP!__InternalCxxFrameHandler<__FrameHandler3>+0x208
11 0000009e`393fb9d0 00007ff9`7802184f VCRUNTIME140_APP!__CxxFrameHandler3+0x71
12 0000009e`393fba20 00007ff9`77fea889 ntdll!RtlpExecuteHandlerForException+0xf
13 0000009e`393fba50 00007ff9`77fea643 ntdll!RtlDispatchException+0x219
14 0000009e`393fc160 00007ff9`759d3b29 ntdll!RtlRaiseException+0×153
15 0000009e`393fc9d0 00007ff9`72596220 KERNELBASE!RaiseException+0×69
16 0000009e`393fcab0 00007ff9`4919a58c VCRUNTIME140_APP!_CxxThrowException+0×90
17 0000009e`393fcb10 00007ff8`f8057628 vccorlib140_app!__abi_WinRTraiseCOMException+0×2c
18 0000009e`393fcb40 00007ff8`f8093e81 PaintStudio_ViewModel+0×7628
19 0000009e`393fcb70 00007ff8`f818f27f PaintStudio_ViewModel+0×43e81
1a 0000009e`393fcbc0 00007ff8`f818c26f PaintStudio_ViewModel+0×13f27f
1b 0000009e`393fcc90 00007ff8`f811935a PaintStudio_ViewModel+0×13c26f
1c 0000009e`393fcd40 00007ff8`f827ce8e PaintStudio_ViewModel+0xc935a
1d 0000009e`393fd110 00007ff8`f82723ab PaintStudio_ViewModel+0×22ce8e
1e 0000009e`393fd5c0 00007ff8`f83bf09d PaintStudio_ViewModel+0×2223ab
1f 0000009e`393fd7b0 00007ff8`f83c16bd PaintStudio_ViewModel+0×36f09d
20 0000009e`393fdc60 00007ff8`f80e1331 PaintStudio_ViewModel+0×3716bd
21 0000009e`393fdd10 00007ff7`2030d3b9 PaintStudio_ViewModel+0×91331
22 0000009e`393fdd50 00007ff7`202f772f PaintStudio_View+0×2d3b9
23 0000009e`393fddb0 00007ff7`202f702b PaintStudio_View+0×1772f
24 0000009e`393fdee0 00007ff7`202f520e PaintStudio_View+0×1702b
25 0000009e`393fe010 00007ff7`203266d6 PaintStudio_View+0×1520e
26 0000009e`393fe100 00007ff9`4af9d25b PaintStudio_View+0×466d6
27 0000009e`393fe140 00007ff9`4af9d1ce Windows_UI_Xaml!DirectUI::FrameworkApplicationGenerated:: OnActivatedProtected+0×4b
28 0000009e`393fe170 00007ff9`4af9ebe6 Windows_UI_Xaml!DirectUI::FrameworkApplication::DispatchGenericActivation+0×4a
29 0000009e`393fe1a0 00007ff9`4aeb39eb Windows_UI_Xaml!DirectUI::FrameworkView::OnActivated+0×186
2a (Inline Function) ——–`——– Windows_UI_Xaml!Microsoft::WRL::Callback::__l2::<lambda_772c64e6f5ddba6f719dbbabda2a0901>::operator()+0×15
2b 0000009e`393fe220 00007ff9`72cd55cf Windows_UI_Xaml!Microsoft::WRL::Details::DelegateArgTraits<long (__cdecl Windows::Foundation:: ITypedEventHandler_impl<Windows::Foundation::Internal:: AggregateType<Windows::UI::Core::CoreWindow *,Windows::UI::Core::ICoreWindow *>,IInspectable *>::*)(Windows::UI::Core::ICoreWindow *,IInspectable *)>::DelegateInvokeHelper<Windows::Foundation:: ITypedEventHandler<Windows::UI::Core::CoreWindow *,IInspectable *>,<lambda_772c64e6f5ddba6f719dbbabda2a0901>,-1,Windows::UI::Core::ICoreWindow *,IInspectable *>::Invoke+0×1b
2c 0000009e`393fe250 00007ff9`72cd8a22 twinapi_appcore!Microsoft::WRL::InvokeTraits<-2>:: InvokeDelegates<<lambda_3ad0adb09957fd62cbc86618ebbeb8fa>,Windows::Foundation:: ITypedEventHandler<Windows::ApplicationModel::Core::CoreApplicationView *,Windows::ApplicationModel::Activation::IActivatedEventArgs *> >+0×67
2d 0000009e`393fe2c0 00007ff9`76cb6a63 twinapi_appcore!Windows::ApplicationModel::Core:: CoreApplicationView::Activate+0×3d2
2e 0000009e`393fe430 00007ff9`76d1a036 rpcrt4!Invoke+0×73
2f 0000009e`393fe490 00007ff9`76c783b9 rpcrt4!Ndr64StubWorker+0xb56
30 0000009e`393feb30 00007ff9`76fd5d13 rpcrt4!NdrStubCall3+0xc9
31 0000009e`393feb90 00007ff9`76c99bab combase!CStdStubBuffer_Invoke+0×73
32 0000009e`393febd0 00007ff9`76fbd0e3 rpcrt4!CStdStubBuffer_Invoke+0×3b
33 (Inline Function) ——–`——– combase!InvokeStubWithExceptionPolicyAndTracing::__l6:: <lambda_c9f3956a20c9da92a64affc24fdd69ec>::operator()+0×18
34 0000009e`393fec00 00007ff9`76fbced3 combase!ObjectMethodExceptionHandlingAction< <lambda_c9f3956a20c9da92a64affc24fdd69ec> >+0×43
35 (Inline Function) ——–`——– combase!InvokeStubWithExceptionPolicyAndTracing+0xa8
36 0000009e`393fec60 00007ff9`76fd9556 combase!DefaultStubInvoke+0×1c3
37 (Inline Function) ——–`——– combase!SyncStubCall::Invoke+0×22
38 0000009e`393fedb0 00007ff9`76fba4fa combase!SyncServerCall::StubInvoke+0×26
39 (Inline Function) ——–`——– combase!StubInvoke+0×259
3a 0000009e`393fedf0 00007ff9`76fda81b combase!ServerCall::ContextInvoke+0×42a
3b (Inline Function) ——–`——– combase!CServerChannel::ContextInvoke+0xc0
3c (Inline Function) ——–`——– combase!DefaultInvokeInApartment+0xc0
3d 0000009e`393ff1f0 00007ff9`76f701ac combase!ASTAInvokeInApartment+0×15b
3e 0000009e`393ff400 00007ff9`76f70a11 combase!AppInvoke+0×1ec
3f 0000009e`393ff490 00007ff9`76f918c2 combase!ComInvokeWithLockAndIPID+0×681
40 (Inline Function) ——–`——– combase!ComInvoke+0×1c1
41 0000009e`393ff7c0 00007ff9`76f90a99 combase!ThreadDispatch+0×272
42 0000009e`393ff890 00007ff9`76f947ba combase!ModernSTAState::HandleMessage+0×51
43 0000009e`393ff8e0 00007ff9`4eac92f5 combase!ModernSTAWaitContext::HandlePriorityEventsFromMessagePump+0×66
44 0000009e`393ff910 00007ff9`4eac8fee Windows_UI!Windows::UI::Core::CDispatcher::ProcessMessage+0×1b5
45 0000009e`393ff9c0 00007ff9`4eac8f21 Windows_UI!Windows::UI::Core::CDispatcher::WaitAndProcessMessagesInternal+0xae
46 0000009e`393ffad0 00007ff9`72cea89f Windows_UI!Windows::UI::Core::CDispatcher::WaitAndProcessMessages+0×31
47 0000009e`393ffb00 00007ff9`76eac235 twinapi_appcore!<lambda_643db08282a766b00cec20194396f531>::operator()+0xff
48 0000009e`393ffbf0 00007ff9`77aa7c24 SHCore!_WrapperThreadProc+0xf5
49 0000009e`393ffcd0 00007ff9`77fed4d1 kernel32!BaseThreadInitThunk+0×14
4a 0000009e`393ffd00 00000000`00000000 ntdll!RtlUserThreadStart+0×21

We dump doubly dereferenced raw stack region around such exception processing calls:

0:008> dpp 0000009e`393fc160 0000009e`393fcb70
[…]
0000009e`393fcb38 00007ff8`f8057628 cc003f4c`6115ffcc
0000009e`393fcb40 0000009e`393fcb88 0000009e`393fcb98
0000009e`393fcb48 000001e8`69af9450 00007ff9`491c6170 vccorlib140_app!Platform::COMException::`vftable’
0000009e`393fcb50 000001e8`69af9450 00007ff9`491c6170 vccorlib140_app!Platform::COMException::`vftable’
[…]

We see C++ Object references and apply object structure to them:

0:008> dt vccorlib140_app!Platform::COMException 000001e8`69af9450
+0×000 __VFN_table : 0×00007ff9`491c6170
+0×008 __VFN_table : 0×00007ff9`491c5bf8
+0×010 __VFN_table : 0×00007ff9`491c5e20
+0×018 __VFN_table : 0×00007ff9`491c5ec0
+0×020 __description    : 0×000001e8`5e1e30a8 Void
+0×028 __restrictedErrorString : 0×000001e8`5ba83728 Void

+0×030 __restrictedErrorReference : (null)
+0×038 __capabilitySid  : (null)
+0×040 __hresult        : 0n-2147024894
+0×048 __restrictedInfo : 0×000001e8`699f4308 Void
+0×050 __throwInfo      : 0×00007ff9`491baf60 Void
+0×058 __size           : 0×40
+0×060 __prepare        : Platform::IntPtr
+0×068 __abi_reference_count : __abi_FTMWeakRefData
+0×078 __abi_disposed   : 0
+0×080 __abi_disposed   : 0

0:008> du 0x000001e8`5e1e30a8
000001e8`5e1e30a8  "The system cannot find the file "
000001e8`5e1e30e8  "specified..."

0:008> du 0x000001e8`5ba83728
000001e8`5ba83728  "Error trying to initialize appli"
000001e8`5ba83768  "cation data storage folder"

0:008> !error 0n-2147024894
Error code: (HRESULT) 0x80070002 (2147942402) - The system cannot find the file specified.

- Dmitry Vostokov @ DumpAnalysis.org + TraceAnalysis.org -