Memory Dump Analysis Best Practices (Part 2)

May 7th, 2013

We continue with best practices, the previous was SCP. The second best practice is to check the system for additional patterns after the main pattern was found (similar to avoiding Common Mistake 8). For example, in the case of a bug check resulted from NULL pointer dereference or any other exception in some 3rd-party driver code don’t stop but look at all CPUs, processes and threads to find any other patterns such as Spiking Threads, Busy System, and Contention. Inspection of associated thread stack traces might reveal the same module and/or give additional clues to system behaviour prior to the fault.

- Dmitry Vostokov @ DumpAnalysis.org + TraceAnalysis.org -

Trace Analysis Patterns (Part 70)

May 4th, 2013

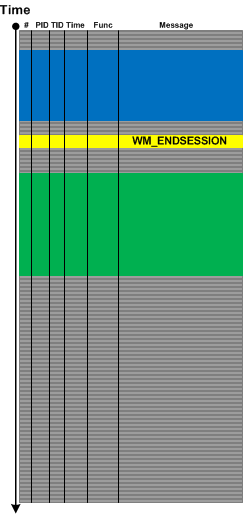
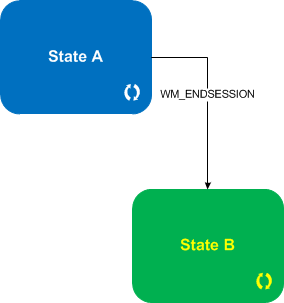
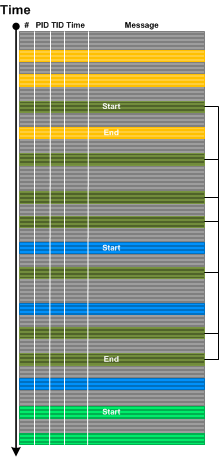
For event- or message-driven architectures it is important to differentiate between event and state messages (including state transition). For example, a system may be doing some work while being in some particular state with a lot of tracing and respond to various external events with each of them having a corresponding trace message. Upon such an event the system transitions to some other state with its own set of possible trace messages. We call such a pattern State and Event. Typical example here is a windowing terminal services system and WM_ENDSESSION event illustrated in the following abstract trace diagram with a corresponding state transition diagram below it:

- Dmitry Vostokov @ DumpAnalysis.org + TraceAnalysis.org -

Trace Analysis Patterns (Part 69)

April 25th, 2013

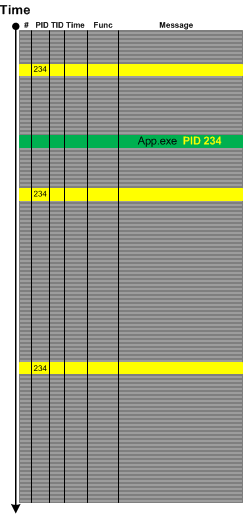
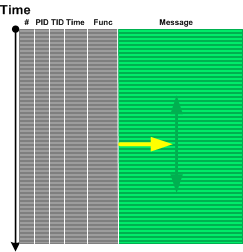
Sometimes in the case of missing Basic Facts we can discern Indirect Facts from message text and even from other patterns. For example, in one incident we were interested in all messages from the certain process name but its PID was missing from the problem description. Fortunately we were able to get its PID from one of individual messages from completely different source:

- Dmitry Vostokov @ DumpAnalysis.org + TraceAnalysis.org -

Fool (Debugging Slang, Part 38)

March 31st, 2013

Fool - The long version of a foo program used in C and C++ tutorials.

Examples: What a foolish program!

- Dmitry Vostokov @ DumpAnalysis.org + TraceAnalysis.org -

Generalized Software Narrative and Trace

March 25th, 2013

In the past we viewed software traces and logs as temporarily ordered event sequences. Since events are just memory data we have a map

T  -> M

as can be seen in the definition of a software trace. Here we generalize the domain to any arbitrary set, for example, it can be a list of indexes or pointers or even memory itself. The latter map can give us narrative chains such as

M -> M -> M -> M

and even give us a grand unification of memory and log analysis and the possibility to apply software narratology to memory dump analysis as well. We talk about it soon and provide some generalized software narrative examples.

- Dmitry Vostokov @ DumpAnalysis.org + TraceAnalysis.org -

Trace Analysis Patterns (Part 68)

March 23rd, 2013

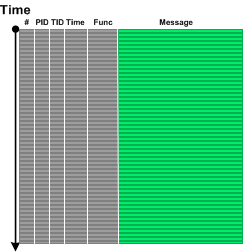
While preparing a presentation on malware narratives we found that one essential pattern is missing from the current log analysis pattern catalog. Most of the time we see some abnormal or unexpected value in a software trace or log such as a network address outside expected range and this triggers further investigation. The message structure may be the same having the same Message Invariant but variable part may contain such values as depicted graphically:

We call this pattern Abnormal Value and plan to add the similar one to memory dump analysis pattern catalog. Please not that we also have Significant Event pattern that is more general and also covers messages without variable part or just suspicious log entries.

- Dmitry Vostokov @ DumpAnalysis.org + TraceAnalysis.org -

More 10 Common Mistakes in Memory Analysis (Part 1)

March 22nd, 2013

Because we finished the list of 10 common mistakes some time ago we continue with “more” series. A year ago we discovered the need to pay attention to differences between 32-bit and 64-bit versions of critical section structures and the need for explicit symbol qualification in x86 mode to avoid mistakes. This post was in draft since then and we now publish it. Suppose we see the address of a critical section on a 32-bit stack trace:

0:000:x86> kv
ChildEBP RetAddr  Args to Child
0044f40c 774e8dd4 00000a94 00000000 00000000 ntdll_774b0000!ZwWaitForSingleObject+0x15
0044f470 774e8cb8 00000000 00000000 041f4b78 ntdll_774b0000!RtlpWaitOnCriticalSection+0x13e
0044f498 0123f70c 010d97c0 8c62ec9c 010cc5fc ntdll_774b0000!RtlEnterCriticalSection+0×150

0:000:x86> dt _RTL_CRITICAL_SECTION 010d97c0
ntdll!_RTL_CRITICAL_SECTION
+0x000 DebugInfo        : 0x00862680 _RTL_CRITICAL_SECTION_DEBUG
+0x008 LockCount        : 0n1
+0x00c RecursionCount   : 0n103356
+0×010 OwningThread     : 0×00000a94 Void
+0×018 LockSemaphore    : 0×0817d72d Void
+0×020 SpinCount        : 0×6130910c`010d9840

Its owner thread has a94 TID but we don’t see it in the thread list:

0:000:x86> ~
.  0  Id: 19508.17944 Suspend: 0 Teb: 7efdb000 Unfrozen
1  Id: 19508.1922c Suspend: 0 Teb: 7efd8000 Unfrozen
2  Id: 19508.195d4 Suspend: 0 Teb: 7efd5000 Unfrozen
3  Id: 19508.19a80 Suspend: 0 Teb: 7efa7000 Unfrozen
4  Id: 19508.19544 Suspend: 0 Teb: 7efa4000 Unfrozen
5  Id: 19508.1925c Suspend: 0 Teb: 7efa1000 Unfrozen
6  Id: 19508.193d4 Suspend: 0 Teb: 7ef9d000 Unfrozen
7  Id: 19508.19b18 Suspend: 0 Teb: 7ef9a000 Unfrozen
8  Id: 19508.19bfc Suspend: 0 Teb: 7ef97000 Unfrozen
9  Id: 19508.19bc4 Suspend: 0 Teb: 7ef94000 Unfrozen
10  Id: 19508.19a90 Suspend: 0 Teb: 7ef91000 Unfrozen
11  Id: 19508.189c0 Suspend: 0 Teb: 7ef8d000 Unfrozen
12  Id: 19508.193bc Suspend: 0 Teb: 7ef8a000 Unfrozen
13  Id: 19508.18f3c Suspend: 0 Teb: 7ef87000 Unfrozen
14  Id: 19508.18834 Suspend: 0 Teb: 7ef84000 Unfrozen
15  Id: 19508.19aec Suspend: 0 Teb: 7ef81000 Unfrozen
16  Id: 19508.180f4 Suspend: 0 Teb: 7ef7d000 Unfrozen
17  Id: 19508.19a3c Suspend: 0 Teb: 7ef7a000 Unfrozen
18  Id: 19508.1916c Suspend: 0 Teb: 7ef77000 Unfrozen
19  Id: 19508.19324 Suspend: 0 Teb: 7ef74000 Unfrozen
20  Id: 19508.19a78 Suspend: 0 Teb: 7ef71000 Unfrozen
21  Id: 19508.19ad4 Suspend: 0 Teb: 7ef6d000 Unfrozen
22  Id: 19508.19834 Suspend: 0 Teb: 7ef6a000 Unfrozen
23  Id: 19508.19754 Suspend: 0 Teb: 7ef67000 Unfrozen
24  Id: 19508.19aa0 Suspend: 0 Teb: 7ef64000 Unfrozen
25  Id: 19508.19bd0 Suspend: 0 Teb: 7ef61000 Unfrozen
26  Id: 19508.19384 Suspend: 0 Teb: 7ef5d000 Unfrozen
27  Id: 19508.1734c Suspend: 0 Teb: 7ef5a000 Unfrozen
28  Id: 19508.19148 Suspend: 0 Teb: 7ef57000 Unfrozen
29  Id: 19508.19b74 Suspend: 0 Teb: 7ef54000 Unfrozen
30  Id: 19508.18290 Suspend: 0 Teb: 7ef51000 Unfrozen
31  Id: 19508.19a4c Suspend: 0 Teb: 7ef4d000 Unfrozen
32  Id: 19508.19bc0 Suspend: 0 Teb: 7ef4a000 Unfrozen
33  Id: 19508.18bf0 Suspend: 0 Teb: 7ef47000 Unfrozen
34  Id: 19508.1895c Suspend: 0 Teb: 7ef44000 Unfrozen
35  Id: 19508.19314 Suspend: 0 Teb: 7ef41000 Unfrozen
36  Id: 19508.19934 Suspend: 0 Teb: 7ef3a000 Unfrozen
37  Id: 19508.197b0 Suspend: 0 Teb: 7ef31000 Unfrozen
38  Id: 19508.1962c Suspend: 0 Teb: 7ef2d000 Unfrozen
39  Id: 19508.191e0 Suspend: 0 Teb: 7ef2a000 Unfrozen
40  Id: 19508.19438 Suspend: 0 Teb: 7ef27000 Unfrozen
41  Id: 19508.197e8 Suspend: 0 Teb: 7ef24000 Unfrozen
42  Id: 19508.18c38 Suspend: 0 Teb: 7ef21000 Unfrozen
43  Id: 19508.197b4 Suspend: 0 Teb: 7ef1d000 Unfrozen
44  Id: 19508.1978c Suspend: 0 Teb: 7ef1a000 Unfrozen
45  Id: 19508.19b84 Suspend: 0 Teb: 7ef17000 Unfrozen
46  Id: 19508.197a8 Suspend: 0 Teb: 7ef14000 Unfrozen
47  Id: 19508.19660 Suspend: 0 Teb: 7ef3d000 Unfrozen
48  Id: 19508.18574 Suspend: 0 Teb: 7efad000 Unfrozen
49  Id: 19508.17a04 Suspend: 0 Teb: 7efaa000 Unfrozen

We see a correct result if we specify a different structure:

0:000:x86> dt CRITICAL_SECTION 010d97c0
ModuleA!CRITICAL_SECTION
+0x000 DebugInfo        : 0x00862680 _RTL_CRITICAL_SECTION_DEBUG
+0x004 LockCount        : 0n-6
+0x008 RecursionCount   : 0n1
+0×00c OwningThread     : 0×000193bc Void
+0×010 LockSemaphore    : 0×00000a94 Void
+0×014 SpinCount        : 0

This is because the structure definition is from a 32-bit module:

0:000:x86> dt ModuleA!CRITICAL_SECTION
ModuleA!CRITICAL_SECTION
+0x000 DebugInfo        : Ptr32 _RTL_CRITICAL_SECTION_DEBUG
+0x004 LockCount        : Int4B
+0x008 RecursionCount   : Int4B
+0×00c OwningThread     : Ptr32 Void
+0×010 LockSemaphore    : Ptr32 Void
+0×014 SpinCount        : Uint4B

However, the structure we used first is from 64-bit module and has a different offset and size for OwningThread field:

0:000:x86> dt ntdll!_RTL_CRITICAL_SECTION
+0x000 DebugInfo        : Ptr64 _RTL_CRITICAL_SECTION_DEBUG
+0x008 LockCount        : Int4B
+0x00c RecursionCount   : Int4B
+0×010 OwningThread     : Ptr64 Void
+0×018 LockSemaphore    : Ptr64 Void
+0×020 SpinCount        : Uint8B

Because a different 32-bit ntdll module is also loaded we can use it for explicit symbol qualification:

0:000:x86> dt ntdll_774b0000!_RTL_CRITICAL_SECTION
+0×000 DebugInfo        : Ptr32 _RTL_CRITICAL_SECTION_DEBUG
+0×004 LockCount        : Int4B
+0×008 RecursionCount   : Int4B
+0×00c OwningThread     : Ptr32 Void
+0×010 LockSemaphore    : Ptr32 Void
+0×014 SpinCount        : Uint4B

- Dmitry Vostokov @ DumpAnalysis.org + TraceAnalysis.org -
Trace Analysis Patterns (Part 67)

March 20th, 2013

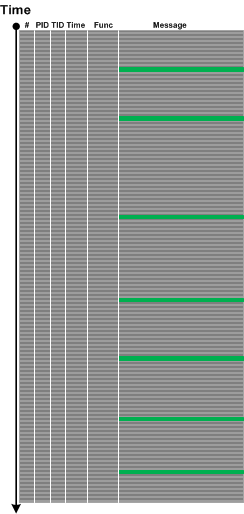
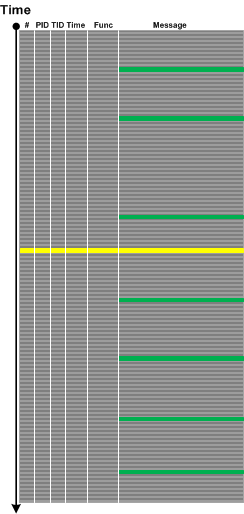
Sometimes we have insufficiently detailed problem description and/or there are several similar parallel user activities going on simultaneously, for example, several session are launched in a terminal services environment. In such cases when tracing is done for the duration of specific user activity Dominant Event Sequence pattern may help. Here we select the most full sequence of events or event sequence based on some Basic Facts. For example, if session id was missing in problem description we can choose the most long and full process launch seqence and assume that its session id was the one missing:

- Dmitry Vostokov @ DumpAnalysis.org + TraceAnalysis.org -
Happy St. Patrick’s Screen

March 17th, 2013


- Dmitry Vostokov @ DumpAnalysis.org + TraceAnalysis.org -
Trace Analysis Patterns (Part 66)

March 16th, 2013

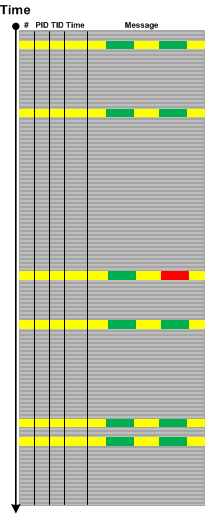
Suppose we form an adjoint thread based on some message or operation type or some other attribute:

But we do not know where to start to look backwards for any anomalies relevant to our problem:

We go back to our full trace and find a problem message:

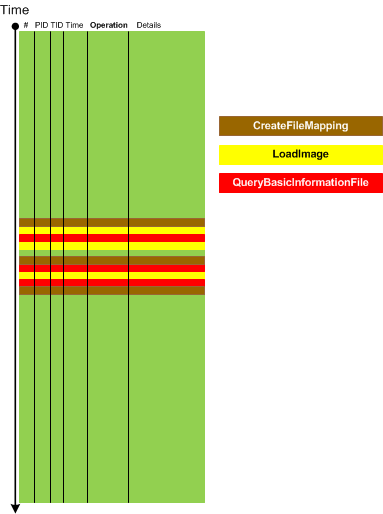
Although it is not in our adjoint thread we formed previously it is still considered as Pivot Message helping us to go backwards there:

- Dmitry Vostokov @ DumpAnalysis.org + TraceAnalysis.org -
Trace Analysis Patterns (Part 65)

March 14th, 2013

If Implementation Discourse focuses on objective technology specific discourse then Traces of Individuality pattern focuses on subjective elements in a software log and its messages. Here we mean some specific naming or tracing conventions either from an individual engineer habit or from some corporate coding standard. As an example of it consider a trace message from a catch statement:

"Surprise, surprise, should have never been caught"

More examples for this pattern will be added later.

- Dmitry Vostokov @ DumpAnalysis.org + TraceAnalysis.org -
Bugtation No.163

March 14th, 2013

… what an ideal engineer should be in the eyes of his contemporaries: […] a man of hardware and a child of software.

Amir Alexander, From Voyagers to Martyrs

- Dmitry Vostokov @ DumpAnalysis.org + TraceAnalysis.org -

WinDbg shortcuts: !sw and !k

March 10th, 2013

There is an extension shortcut to the usual WinDbg command .effmach for 64-bit memory dumps of 32-bit processes:

0:000> .load wow64exts

0:000> !sw

Switched to 32bit mode

0:000:x86> !sw

Switched to 64bit mode

Also !k command will display both thread stacks (32-bit and 64-bit):

0:000> !k
Walking 64bit Stack...
Child-SP          RetAddr           Call Site
00000000`0016e018 00000000`74f9aea8 wow64win!NtUserGetMessage+0xa
00000000`0016e020 00000000`74fecf87 wow64win!whNtUserGetMessage+0x30
00000000`0016e080 00000000`74f72776 wow64!Wow64SystemServiceEx+0xd7
00000000`0016e940 00000000`74fed07e wow64cpu!ServiceNoTurbo+0x2d
00000000`0016ea00 00000000`74fec549 wow64!RunCpuSimulation+0xa
00000000`0016ea50 00000000`77c54956 wow64!Wow64LdrpInitialize+0x429
00000000`0016efa0 00000000`77c51a17 ntdll!LdrpInitializeProcess+0x17e4
00000000`0016f490 00000000`77c3c32e ntdll! ?? ::FNODOBFM::`string'+0x29220
00000000`0016f500 00000000`00000000 ntdll!LdrInitializeThunk+0xe
Walking 32bit Stack...
ChildEBP RetAddr
002cf6a0 76ba790d user32!NtUserGetMessage+0x15
002cf6bc 0048148a user32!GetMessageW+0x33
002cf6fc 004816ec notepad!WinMain+0xe6
002cf78c 755533aa notepad!_initterm_e+0x1a1
002cf798 77e29ef2 kernel32!BaseThreadInitThunk+0xe
002cf7d8 77e29ec5 ntdll_77df0000!__RtlUserThreadStart+0x70
002cf7f0 00000000 ntdll_77df0000!_RtlUserThreadStart+0x1b

However, I don’t recommend its usage in iterative scripts because if something goes wrong at one iteration then all subsequent !sw commands will trigger the wrong machine mode but explicit .effmach will set the correct one.

- Dmitry Vostokov @ DumpAnalysis.org + TraceAnalysis.org -
Cyber Vostok Missions

February 28th, 2013

Software Diagnostics Services launches its first cyber satellite to survey the state of cyber space and mine its patterns:

http://www.dumpanalysis.com/cybervostok

Notice a satellite logo: it has an UML 2.0 interface sink similar to Software Diagnostics Institute logo:

- Dmitry Vostokov @ DumpAnalysis.org + TraceAnalysis.org -
Crash Dump Analysis Patterns (Part 197)

February 27th, 2013

Injected Symbols pattern can be used to add missing symbols when we have Reduced Symbol Information like it was done previously in this old case study. For example, TestWER module was compiled with static MFC and CRT libraries and its private PDB file contains all necessary symbols including MSG structure. We can load that module into notepad.exe process space and apply symbols:

0:000:x86> lm
start             end                 module name
00fc0000 00ff0000   notepad    (pdb symbols)          c:\mss\notepad.pdb\E325F5195AE94FAEB58D25C9DF8C0CFD2\notepad.pdb
10000000 10039000   WinCRT     (deferred)
727f0000 7298e000   comctl32   (deferred)
72aa0000 72af1000   winspool   (deferred)
72b10000 72b19000   version    (deferred)
72e40000 72e48000   wow64cpu   (deferred)
72e50000 72eac000   wow64win   (pdb symbols)          c:\mss\wow64win.pdb\B2D08CC152D64E71B79167DC0A0A53E91\wow64win.pdb
72eb0000 72eef000   wow64      (deferred)
733d0000 733e3000   dwmapi     (deferred)
735b0000 73606000   uxtheme    (deferred)
746f0000 746fc000   CRYPTBASE   (deferred)
74700000 74760000   sspicli    (deferred)
747c0000 74817000   shlwapi    (deferred)
74830000 7547a000   shell32    (deferred)
755d0000 7564b000   comdlg32   (deferred)
75650000 7567e000   imm32      (deferred)
75770000 75810000   advapi32   (deferred)
75810000 75920000   kernel32   (pdb symbols)          c:\mss\wkernel32.pdb\1C690A8592304467BB15A09CEA7180FA2\wkernel32.pdb
75920000 759b0000   gdi32      (deferred)
759b0000 759f7000   KERNELBASE   (deferred)
75a00000 75b00000   user32     (pdb symbols)          c:\mss\wuser32.pdb\0FCE9CC301ED4567A819705B2718E1D62\wuser32.pdb
75b00000 75b8f000   oleaut32   (deferred)
75be0000 75c7d000   usp10      (deferred)
75ff0000 76009000   sechost    (deferred)
76010000 76100000   rpcrt4     (deferred)
76230000 762dc000   msvcrt     (deferred)
76470000 7647a000   lpk        (deferred)
76480000 7654c000   msctf      (deferred)
76550000 766ac000   ole32      (deferred)
766d0000 76753000   clbcatq    (deferred)
76e40000 76fe9000   ntdll      (deferred)
77020000 771a0000   ntdll_77020000   (pdb symbols)          c:\mss\wntdll.pdb\D74F79EB1F8D4A45ABCD2F476CCABACC2\wntdll.pdb

0:000:x86> .sympath+ C:\DebuggingTV\TestWER\x86
Symbol search path is: srv*;C:\DebuggingTV\TestWER\x86
Expanded Symbol search path is: SRV*c:\mss*http://msdl.microsoft.com/download/symbols;c:\debuggingtv\testwer\x86

0:000:x86> .reload /f /i C:\DebuggingTV\TestWER\x86\TestWER.exe=10000000

0:000:x86> lm
start             end                 module name
00fc0000 00ff0000   notepad    (pdb symbols)          c:\mss\notepad.pdb\E325F5195AE94FAEB58D25C9DF8C0CFD2\notepad.pdb
10000000 10039000   TestWER    (private pdb symbols)  c:\debuggingtv\testwer\x86\TestWER.pdb
727f0000 7298e000   comctl32   (deferred)
72aa0000 72af1000   winspool   (deferred)
72b10000 72b19000   version    (deferred)
72e40000 72e48000   wow64cpu   (deferred)
72e50000 72eac000   wow64win   (pdb symbols)          c:\mss\wow64win.pdb\B2D08CC152D64E71B79167DC0A0A53E91\wow64win.pdb
72eb0000 72eef000   wow64      (deferred)
733d0000 733e3000   dwmapi     (deferred)
735b0000 73606000   uxtheme    (deferred)
746f0000 746fc000   CRYPTBASE   (deferred)
74700000 74760000   sspicli    (deferred)
747c0000 74817000   shlwapi    (deferred)
74830000 7547a000   shell32    (deferred)
755d0000 7564b000   comdlg32   (deferred)
75650000 7567e000   imm32      (deferred)
75770000 75810000   advapi32   (deferred)
75810000 75920000   kernel32   (pdb symbols)          c:\mss\wkernel32.pdb\1C690A8592304467BB15A09CEA7180FA2\wkernel32.pdb
75920000 759b0000   gdi32      (deferred)
759b0000 759f7000   KERNELBASE   (deferred)
75a00000 75b00000   user32     (pdb symbols)          c:\mss\wuser32.pdb\0FCE9CC301ED4567A819705B2718E1D62\wuser32.pdb
75b00000 75b8f000   oleaut32   (deferred)
75be0000 75c7d000   usp10      (deferred)
75ff0000 76009000   sechost    (deferred)
76010000 76100000   rpcrt4     (deferred)
76230000 762dc000   msvcrt     (deferred)
76470000 7647a000   lpk        (deferred)
76480000 7654c000   msctf      (deferred)
76550000 766ac000   ole32      (deferred)
766d0000 76753000   clbcatq    (deferred)
76e40000 76fe9000   ntdll      (deferred)
77020000 771a0000   ntdll_77020000   (pdb symbols)          c:\mss\wntdll.pdb\D74F79EB1F8D4A45ABCD2F476CCABACC2\wntdll.pdb

0:000:x86> kv
ChildEBP RetAddr  Args to Child
0013fe34 75a1790d 0013fe74 00000000 00000000 user32!NtUserGetMessage+0x15
0013fe50 00fc148a 0013fe74 00000000 00000000 user32!GetMessageW+0×33
0013fe90 00fc16ec 00fc0000 00000000 00354082 notepad!WinMain+0xe6
0013ff20 758233aa 7efde000 0013ff6c 77059ef2 notepad!_initterm_e+0×1a1
0013ff2c 77059ef2 7efde000 57785ae5 00000000 kernel32!BaseThreadInitThunk+0xe
0013ff6c 77059ec5 00fc3689 7efde000 00000000 ntdll_77020000!__RtlUserThreadStart+0×70
0013ff84 00000000 00fc3689 7efde000 00000000 ntdll_77020000!_RtlUserThreadStart+0×1b

0:000:x86> dt -r MSG 0013fe74
TestWER!MSG
  +0x000 hwnd             : 0x0007149c HWND__
    +0x000 unused           : ??
  +0×004 message          : 0×113
  +0×008 wParam           : 0×38a508
  +0×00c lParam           : 0n1921500630
  +0×010 time             : 0×2079a177
  +0×014 pt               : tagPOINT
    +0×000 x                : 0n1337
    +0×004 y                : 0n448

- Dmitry Vostokov @ DumpAnalysis.org + TraceAnalysis.org -
Crash Dump Analysis Patterns (Part 196)

February 26th, 2013

Sometimes we have Reduced Symbolic Information for modules which can range from stripped or public symbol files to exported only function names. In such cases we can use API function prototypes, structure definitions and possible String Parameters to make sense of function arguments:

0:000:x86> kv
ChildEBP RetAddr  Args to Child
0013fe34 75a1790d 0013fe74 00000000 00000000 user32!NtUserGetMessage+0x15
0013fe50 00fc148a 0013fe74 00000000 00000000 user32!GetMessageW+0×33
0013fe90 00fc16ec 00fc0000 00000000 00354082 notepad!WinMain+0xe6
0013ff20 758233aa 7efde000 0013ff6c 77059ef2 notepad!_initterm_e+0×1a1
0013ff2c 77059ef2 7efde000 57785ae5 00000000 kernel32!BaseThreadInitThunk+0xe
0013ff6c 77059ec5 00fc3689 7efde000 00000000 ntdll_77020000!__RtlUserThreadStart+0×70
0013ff84 00000000 00fc3689 7efde000 00000000 ntdll_77020000!_RtlUserThreadStart+0×1b

The first parameter of GetMessage API is a pointer to MSG structure:

0:000:x86> dt MSG 0013fe74
Symbol MSG not found.

From MSDN we find this structure definition:

typedef struct tagMSG { HWND   hwnd; UINT   message; WPARAM wParam; LPARAM lParam; DWORD  time; POINT  pt; } MSG, *PMSG, *LPMSG;

0:000:x86> dc 0013fe74 L7
0013fe74  0007149c 00000113 0038a508 7287c5d6  ……….8….r
0013fe84  2079a177 00000539 000001c0           w.y 9…….

- Dmitry Vostokov @ DumpAnalysis.org + TraceAnalysis.org -
Crash Dump Analysis Patterns (Part 195)

February 26th, 2013

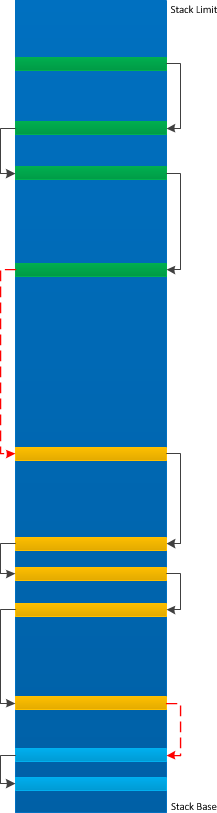
Sometimes we have a Truncated Stack Trace and need to perform manual stack trace reconstruction of the missing part to get approximate full stack trace. Often we are only able to reconstruct some parts and glue them together perhaps with some missing intermediate frames:

For example, we have this truncated stack trace due to the lack of symbols:

1: kd> k
ChildEBP RetAddr
97543b6c 85adf579 nt!KiTrap0E+0x2ac
WARNING: Stack unwind information not available. Following frames may be wrong.
97543be8 85adf770 myfault+0x579
97543bf4 85adf7fc myfault+0x770
97543c2c 81827ecf myfault+0x7fc
97543c44 81988f65 nt!IofCallDriver+0x63
97543c64 81989f25 nt!IopSynchronousServiceTail+0x1e0
97543d00 8198ee8d nt!IopXxxControlFile+0x6b7
97543d34 8188c96a nt!NtDeviceIoControlFile+0x2a
97543d34 77510f34 nt!KiFastCallEntry+0x12a
0012f9a0 7750f850 ntdll!KiFastSystemCallRet
0012f9a4 77417c92 ntdll!NtDeviceIoControlFile+0xc
0012fa04 00401a5b kernel32!DeviceIoControl+0x14a
0012fa94 7700becf NotMyfault+0x1a5b
0012facc 00000000 USER32!xxxDrawButton+0xc1

Manual stack reconstruction brings this fragment:

1: kd> k L=0012fb94 0012fb94 0012fb94
ChildEBP RetAddr
WARNING: Frame IP not in any known module. Following frames may be wrong.
0012fb94 77001ae8 0x12fb94
0012fc0c 7700286a USER32!UserCallWinProcCheckWow+0x14b
0012fc4c 77002bba USER32!SendMessageWorker+0x4b7
0012fc6c 7700c6b4 USER32!SendMessageW+0x7c
0012fc84 7700c7c9 USER32!xxxButtonNotifyParent+0x41
0012fca0 7700c7e8 USER32!xxxBNReleaseCapture+0xf7
0012fd24 7701632e USER32!ButtonWndProcWorker+0x910
0012fd44 77001a10 USER32!ButtonWndProcA+0x4c
0012fd70 77001ae8 USER32!InternalCallWinProc+0x23
0012fde8 77002a47 USER32!UserCallWinProcCheckWow+0x14b
0012fe4c 77002a98 USER32!DispatchMessageWorker+0x322
0012fe5c 76ff11fc USER32!DispatchMessageW+0xf
0012fe80 76fe98d2 USER32!IsDialogMessageW+0x586
0012fea0 00401cc9 USER32!IsDialogMessageA+0xff
0012ff10 004022ec NotMyfault+0x1cc9
00000000 00000000 NotMyfault+0x22ec

And finally we get the 3rd usual thread start fragment:

1: kd> k L=0012ffa0 0012ffa0 0012ffa0
ChildEBP RetAddr
WARNING: Frame IP not in any known module. Following frames may be wrong.
0012ffa0 77413833 0x12ffa0
0012ffac 774ea9bd kernel32!BaseThreadInitThunk+0xe
0012ffec 00000000 ntdll!_RtlUserThreadStart+0x23

Gluing them together we get this approx. stack trace:

97543b6c 85adf579 nt!KiTrap0E+0x2ac
WARNING: Stack unwind information not available. Following frames may be wrong.
97543be8 85adf770 myfault+0x579
97543bf4 85adf7fc myfault+0x770
97543c2c 81827ecf myfault+0x7fc
97543c44 81988f65 nt!IofCallDriver+0x63
97543c64 81989f25 nt!IopSynchronousServiceTail+0x1e0
97543d00 8198ee8d nt!IopXxxControlFile+0x6b7
97543d34 8188c96a nt!NtDeviceIoControlFile+0x2a
97543d34 77510f34 nt!KiFastCallEntry+0x12a
0012f9a0 7750f850 ntdll!KiFastSystemCallRet
0012f9a4 77417c92 ntdll!NtDeviceIoControlFile+0xc
0012fa04 00401a5b kernel32!DeviceIoControl+0x14a
0012fa94 7700becf NotMyfault+0x1a5b
0012fc0c 7700286a USER32!UserCallWinProcCheckWow+0x14b
0012fc4c 77002bba USER32!SendMessageWorker+0x4b7
0012fc6c 7700c6b4 USER32!SendMessageW+0x7c
0012fc84 7700c7c9 USER32!xxxButtonNotifyParent+0x41
0012fca0 7700c7e8 USER32!xxxBNReleaseCapture+0xf7
0012fd24 7701632e USER32!ButtonWndProcWorker+0x910
0012fd44 77001a10 USER32!ButtonWndProcA+0x4c
0012fd70 77001ae8 USER32!InternalCallWinProc+0x23
0012fde8 77002a47 USER32!UserCallWinProcCheckWow+0x14b
0012fe4c 77002a98 USER32!DispatchMessageWorker+0x322
0012fe5c 76ff11fc USER32!DispatchMessageW+0xf
0012fe80 76fe98d2 USER32!IsDialogMessageW+0x586
0012fea0 00401cc9 USER32!IsDialogMessageA+0xff
0012ff10 004022ec NotMyfault+0x1cc9
0012ffac 774ea9bd kernel32!BaseThreadInitThunk+0xe
0012ffec 00000000 ntdll!_RtlUserThreadStart+0x23

We call this pattern Glued Stack Trace.

- Dmitry Vostokov @ DumpAnalysis.org + TraceAnalysis.org -

A Dump Machine

February 15th, 2013

- Dmitry Vostokov @ DumpAnalysis.org + TraceAnalysis.org -
Trace Analysis Patterns (Part 64)

February 15th, 2013

Inter-Correlation analysis between a normal and a problem logs to find a Bifurcation Point (and a possible root cause) becomes a difficult task when both traces come from different environments with widely differing Background Components. Here a new analysis pattern called Sheaf of Activities (borrowed from sheaves from mathematics) can help. Basically this pattern is also a tool in tracking properties of trace message subsets. First we find out important message types around some Activity Region where we hope to find a difference between two traces:

Then we create several Adjoint Threads from different message types, for example, based on operation type or function name:

Then we analyze subtraces separately to find out a bifurcation point in each of them and then use this knowledge to find out differences between the original full traces.

- Dmitry Vostokov @ DumpAnalysis.org + TraceAnalysis.org -

Cadaver Worm: An Exercise in Malware Fiction

February 10th, 2013

The discovery of a “black hole horizon” in a complete memory dump inspired this fictitious malware. There in a dump we discovered an innocuous ASCII message:

fffff880`15925010  fffff880`159250d0 "Dumping physical memory to disk:  80% ."

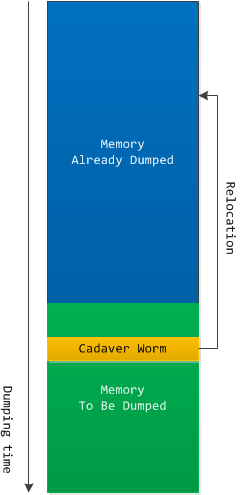
A little thought and we realized that this page was saved to a page file at the time when only 80% of memory were dumped. So we do not know what were in that page during the rest of the time (and would never know). I guess Cadaver Worms live there spreading from PC to PC and causing blue screens immediately upon infection to minimize discovery. They are not in crash dumps because they relocate themselves during the system dump procedure. They thaw frozen CPUs and send themselves to network. Who would suspect a computer showing a blue screen sending network packets?

- Dmitry Vostokov @ DumpAnalysis.org + TraceAnalysis.org -