February 10th, 2013
Out-of-Module Pointer pattern is about pointers to addresses outside the container module range. Typical example here would be some kernel table or structure, for example, a driver IRP dispatch table having pointers to outside that driver module address range. Other examples may include 32-bit SSDT pointing outside nt module range and IDT entries pointing outside hal and expected drivers:
[...]

818809dc  8193c4e7 nt!NtQueryOpenSubKeys

818809e0  8193c76b nt!NtQueryOpenSubKeysEx

818809e4  81a909b0 nt!NtQueryPerformanceCounter

818809e8  819920e7 nt!NtQueryQuotaInformationFile

818809ec  819e34f2 nt!NtQuerySection

818809f0  819f470b nt!NtQuerySecurityObject

818809f4  81a882fe nt!NtQuerySemaphore

818809f8  819eff54 nt!NtQuerySymbolicLinkObject

818809fc  81a8a223 nt!NtQuerySystemEnvironmentValue

81880a00  81a8a831 nt!NtQuerySystemEnvironmentValueEx

81880a04  96ca1a73

81880a08  81a7ac06 nt!NtQuerySystemTime

81880a0c  81a8f913 nt!NtQueryTimer

81880a10  81a7aeeb nt!NtQueryTimerResolution

81880a14  8193985a nt!NtQueryValueKey

81880a18  819e9273 nt!NtQueryVirtualMemory

81880a1c  8199274e nt!NtQueryVolumeInformationFile

81880a20  81a1a655 nt!NtQueueApcThread

[…]
0: kd> lm m nt

start    end        module name

81800000 81ba1000   nt
Such pointers may also be Raw Pointers but it also could be the case that all pointers are raw in the absence of symbols with only a few outside of the expected range.
- Dmitry Vostokov @ DumpAnalysis.org + TraceAnalysis.org -
Posted in Core Dump Analysis, Malware Analysis, Malware Patterns, Victimware, Victimware Analysis | No Comments »
February 9th, 2013
Raw Pointer pattern is about pointers without matching symbol files. They may be in the expected module range or in some other known module range in the form of module+offset or can be completely out of range of any module from the loaded module list and therefore just a number. For example, usually we have certain structures or arrays (tables) where we expect pointers with matching symbols such as IAT, IDT and 32-bit SSDT where an occurrence of a raw pointer immediately triggers a suspicion such as in this Import Address Table from ProcessA:
[...]

00000001`3f8a9048  00000000`76e282d0 ntdll!RtlSizeHeap

00000001`3f8a9050  00000000`76bf9070 kernel32!GetStringTypeWStub

00000001`3f8a9058  00000000`76c03580 kernel32!WideCharToMultiByteStub

00000001`3f8a9060  00000000`76e33f20 ntdll!RtlReAllocateHeap

00000001`3f8a9068  00000000`76e533a0 ntdll!RtlAllocateHeap

00000001`3f8a9070  00000000`76bfc420 kernel32!GetCommandLineWStub

00000001`3f8a9078  00000001`3f8a1638 ProcessA+0×10ac

00000001`3f8a9080  00000000`76c2cc50 kernel32!IsProcessorFeaturePresent

00000001`3f8a9088  00000000`76c02d60 kernel32!GetLastErrorStub

00000001`3f8a9090  00000000`76c02d80 kernel32!SetLastError

00000001`3f8a9098  00000000`76bf3ee0 kernel32!GetCurrentThreadIdStub

[…]
Note that structures are not limited to the above and can me any OS or even application specific structure where we have symbol files. Raw pointers that are outside of expected module range are covered in the next pattern.
- Dmitry Vostokov @ DumpAnalysis.org + TraceAnalysis.org -
Posted in Crash Dump Analysis, Malware Analysis, Malware Patterns, Victimware, Victimware Analysis | No Comments »
February 9th, 2013
Hooksware pattern originally came from memory dump analysis pattern catalog and is too general for malware analysis pattern catalog. So we decided to factor out 3 separate patterns. The first one is called Patched Code and includes cases such as in-place patching:
0:004> u ntdll!ZwQueryDirectoryFile

ntdll!ZwQueryDirectoryFile:

77814db4 b8da000000      mov     eax,0DAh

77814db9 bae8af0500      mov     edx,5AFE8h

77814dbe ff12            call    dword ptr [edx]

77814dc0 c22c00          ret     2Ch

77814dc3 90              nop

ntdll!NtQueryDirectoryObject:

77814dc4 b8db000000      mov     eax,0DBh

77814dc9 ba0003fe7f      mov     edx,offset SharedUserData!SystemCallStub (7ffe0300)

77814dce ff12            call    dword ptr [edx]
and detour patching:
0:004> u wininet!InternetReadFile

wininet!InternetReadFile:

7758654b e98044ac88      jmp     0004a9d0

77586550 83ec24          sub     esp,24h

77586553 53              push    ebx

77586554 56              push    esi

77586555 57              push    edi

77586556 33ff            xor     edi,edi

77586558 393db8116277    cmp     dword ptr [wininet!GlobalDataInitialized (776211b8)],edi

7758655e 897df4          mov     dword ptr [ebp-0Ch],edi
In case of WinDbg such pattern is usually detected on the crash spot such as from RIP Stack Trace or from !chkimg command output.
- Dmitry Vostokov @ DumpAnalysis.org + TraceAnalysis.org -
Posted in Assembly Language, Crash Dump Analysis, Malware Analysis, Malware Patterns, Victimware, Victimware Analysis | No Comments »
February 8th, 2013
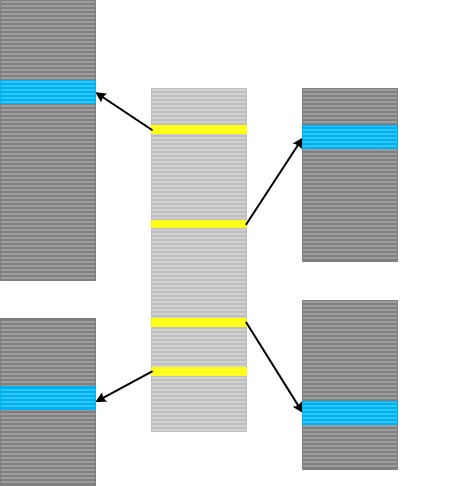
Indexical Trace pattern describes an Inter-Correlation pattern variant when we have a trace that has messages of interest pointing to specific activity regions in another trace. The latter trace can be very huge, from another computer and split into many parts (Split Trace). This pattern is very helpful when the problem needs to be diagnosed in the large split trace but we don’t know when it happened. Then an index trace that may have recorded software execution account (for example, in the case of a broker-like architecture) and can point to the right trace fragment from the split trace.
- Dmitry Vostokov @ DumpAnalysis.org + TraceAnalysis.org -
Posted in CDF Analysis Tips and Tricks, Debugging, Software Architecture, Software Trace Analysis, Software Trace Reading, Trace Analysis Patterns | No Comments »
February 7th, 2013
If debugging were profitable, everybody would be debugging.
Thomas More
- Dmitry Vostokov @ DumpAnalysis.org + TraceAnalysis.org -
Posted in Bugtations, Debugging, Fun with Debugging | No Comments »
February 6th, 2013
Steps:
1. Open a crash dump or attach WinDbg to a process you can sacrifice.
2. Enter this command: eb rsp <UNICODE string> [00 00]
0: kd> eb rsp 42 00 65 00 65 00 74 00 68 00 6F 00 76 00 65 00 6E 00 3A 00 20 00 53 00 79 00 6D 00 70 00 68 00 6F 00 6E 00 69 00 65 00 73 00 20 00 31 00 20 00 61 00 6E 00 64 00 20 00 33 00 00 00
Note: use esp for a 32-bit dump. Last NULL terminators 00 00 are not necessary if the string already has them.
3. Enter this command: du rsp
0: kd> du rsp

fffff880`15925ae8  "Beethoven: Symphonies 1 and 3"
- Dmitry Vostokov @ DumpAnalysis.org + TraceAnalysis.org -
Posted in Fun with WinDbg, WinDbg Tips and Tricks | No Comments »
February 5th, 2013
As usual a new pattern arises with the need to communicate analysis findings. Most often when analyzing malware we don’t have symbol files (No Component Symbols) for an Unknown Module. By looking at IAT (if any present) we can guess module purpose. Sometimes a module itself is not malicious but is used in the larger malicious context such as screen grabbing:
[...]

10002000  76376101 gdi32!CreateCompatibleDC

10002004  763793d6 gdi32!StretchBlt

10002008  76377461 gdi32!CreateDIBSection

1000200c  763762a0 gdi32!SelectObject

10002010  00000000

10002024  77429ced user32!ReleaseDC

10002028  77423ba7 user32!NtUserGetWindowDC

1000202c  77430e21 user32!GetWindowRect

10002030  00000000

10002034  744a75e9 GdiPlus!GdiplusStartup

10002038  744976dd GdiPlus!GdipSaveImageToStream

1000203c  744cdd38 GdiPlus!GdipGetImageEncodersSize

10002040  744971cf GdiPlus!GdipDisposeImage

10002044  744a8591 GdiPlus!GdipCreateBitmapFromHBITMAP

10002048  744cdbae GdiPlus!GdipGetImageEncoders

[...]
There are also cases where these API names are not in IAT but found as String Hint in raw data such LoadLibrary / GetProcAddress and even a group of modules themselves as a collective API:
[...]

00058e20  "kernel32.dll"

00058e3c  "user32.dll"

00058e54  "ws2_32.dll"

00058e6c  "ntdll.dll"

00058e80  "wininet.dll"

00058e98  "nspr4.dll"

00058eac  "ssl3.dll"

[...]
We name this pattern Namespace.
- Dmitry Vostokov @ DumpAnalysis.org + TraceAnalysis.org -
Posted in Crash Dump Analysis, Malware Analysis, Malware Patterns, Victimware, Victimware Analysis | No Comments »
February 3rd, 2013
It is a well-known fact that page heap is implemented by placing allocations at the end of pages with the next non-accessible page to catch buffer overruns leading to heap corruption. The best way to see it is to use !address command that dumps all such allocations:
0:004> !gflag

Current NtGlobalFlag contents: 0x02000000

hpa - Place heap allocations at ends of pages
0:004> !address

[...]

20b10000 20b11000     1000 MEM_PRIVATE MEM_COMMIT  PAGE_READWRITE                     PageHeap   [PageHeap: 1f241000; NormalHeap: 1f410000]

20b11000 20b12000     1000 MEM_PRIVATE MEM_RESERVE                                    PageHeap   [PageHeap: 1f241000; NormalHeap: 1f410000]

20b12000 20b13000     1000 MEM_PRIVATE MEM_COMMIT  PAGE_READWRITE                     PageHeap   [PageHeap: 1f241000; NormalHeap: 1f410000]

20b13000 20b14000     1000 MEM_PRIVATE MEM_RESERVE                                    PageHeap   [PageHeap: 1f241000; NormalHeap: 1f410000]

20b14000 20b15000     1000 MEM_PRIVATE MEM_COMMIT  PAGE_READWRITE                     PageHeap   [PageHeap: 1f241000; NormalHeap: 1f410000]

20b15000 20b1a000     5000 MEM_PRIVATE MEM_RESERVE                                    PageHeap   [PageHeap: 1f241000; NormalHeap: 1f410000]

20b1a000 20b1b000     1000 MEM_PRIVATE MEM_COMMIT  PAGE_READWRITE                     PageHeap   [PageHeap: 1f241000; NormalHeap: 1f410000]

20b1b000 20b1c000     1000 MEM_PRIVATE MEM_RESERVE                                    PageHeap   [PageHeap: 1f241000; NormalHeap: 1f410000]

20b1c000 20b1d000     1000 MEM_PRIVATE MEM_COMMIT  PAGE_READWRITE                     PageHeap   [PageHeap: 1f241000; NormalHeap: 1f410000]

20b1d000 20b1e000     1000 MEM_PRIVATE MEM_RESERVE                                    PageHeap   [PageHeap: 1f241000; NormalHeap: 1f410000]

20b1e000 20b1f000     1000 MEM_PRIVATE MEM_COMMIT  PAGE_READWRITE                     PageHeap   [PageHeap: 1f241000; NormalHeap: 1f410000]

20b1f000 20b20000     1000 MEM_PRIVATE MEM_RESERVE                                    PageHeap   [PageHeap: 1f241000; NormalHeap: 1f410000]

+ 20b20000 20b21000     1000 MEM_PRIVATE MEM_COMMIT  PAGE_READWRITE                     PageHeap   [PageHeap: 1f241000; NormalHeap: 1f410000]

20b21000 20b26000     5000 MEM_PRIVATE MEM_RESERVE                                    PageHeap   [PageHeap: 1f241000; NormalHeap: 1f410000]

20b26000 20b27000     1000 MEM_PRIVATE MEM_COMMIT  PAGE_READWRITE                     PageHeap   [PageHeap: 1f241000; NormalHeap: 1f410000]

20b27000 20b28000     1000 MEM_PRIVATE MEM_RESERVE                                    PageHeap   [PageHeap: 1f241000; NormalHeap: 1f410000]

20b28000 20b29000     1000 MEM_PRIVATE MEM_COMMIT  PAGE_READWRITE                     PageHeap   [PageHeap: 1f241000; NormalHeap: 1f410000]

20b29000 20b2a000     1000 MEM_PRIVATE MEM_RESERVE                                    PageHeap   [PageHeap: 1f241000; NormalHeap: 1f410000]

20b2a000 20b2b000     1000 MEM_PRIVATE MEM_COMMIT  PAGE_READWRITE                     PageHeap   [PageHeap: 1f241000; NormalHeap: 1f410000]

20b2b000 20b2f000     4000 MEM_PRIVATE MEM_RESERVE                                    PageHeap   [PageHeap: 1f241000; NormalHeap: 1f410000]

20b2f000 20b30000     1000 MEM_PRIVATE MEM_COMMIT  PAGE_READWRITE                     PageHeap   [PageHeap: 1f241000; NormalHeap: 1f410000]

20b30000 20b3f000     f000 MEM_PRIVATE MEM_RESERVE                                    PageHeap   [PageHeap: 1f241000; NormalHeap: 1f410000]

20b3f000 20b40000     1000 MEM_PRIVATE MEM_COMMIT  PAGE_READWRITE                     PageHeap   [PageHeap: 1f241000; NormalHeap: 1f410000]

20b40000 20b41000     1000 MEM_PRIVATE MEM_RESERVE                                    PageHeap   [PageHeap: 1f241000; NormalHeap: 1f410000]

20b41000 20b42000     1000 MEM_PRIVATE MEM_COMMIT  PAGE_READWRITE                     PageHeap   [PageHeap: 1f241000; NormalHeap: 1f410000]

20b42000 20b45000     3000 MEM_PRIVATE MEM_RESERVE                                    PageHeap   [PageHeap: 1f241000; NormalHeap: 1f410000]

20b45000 20b46000     1000 MEM_PRIVATE MEM_COMMIT  PAGE_READWRITE                     PageHeap   [PageHeap: 1f241000; NormalHeap: 1f410000]

20b46000 20b4b000     5000 MEM_PRIVATE MEM_RESERVE                                    PageHeap   [PageHeap: 1f241000; NormalHeap: 1f410000]

20b4b000 20b4c000     1000 MEM_PRIVATE MEM_COMMIT  PAGE_READWRITE                     PageHeap   [PageHeap: 1f241000; NormalHeap: 1f410000]

20b4c000 20b4d000     1000 MEM_PRIVATE MEM_RESERVE                                    PageHeap   [PageHeap: 1f241000; NormalHeap: 1f410000]

20b4d000 20b4e000     1000 MEM_PRIVATE MEM_COMMIT  PAGE_READWRITE                     PageHeap   [PageHeap: 1f241000; NormalHeap: 1f410000]

20b4e000 20b4f000     1000 MEM_PRIVATE MEM_RESERVE                                    PageHeap   [PageHeap: 1f241000; NormalHeap: 1f410000]

20b4f000 20b50000     1000 MEM_PRIVATE MEM_COMMIT  PAGE_READWRITE                     PageHeap   [PageHeap: 1f241000; NormalHeap: 1f410000]

20b50000 20b51000     1000 MEM_PRIVATE MEM_RESERVE                                    PageHeap   [PageHeap: 1f241000; NormalHeap: 1f410000]

20b51000 20b52000     1000 MEM_PRIVATE MEM_COMMIT  PAGE_READWRITE                     PageHeap   [PageHeap: 1f241000; NormalHeap: 1f410000]

20b52000 20b57000     5000 MEM_PRIVATE MEM_RESERVE                                    PageHeap   [PageHeap: 1f241000; NormalHeap: 1f410000]

20b57000 20b58000     1000 MEM_PRIVATE MEM_COMMIT  PAGE_READWRITE                     PageHeap   [PageHeap: 1f241000; NormalHeap: 1f410000]

20b58000 20b5d000     5000 MEM_PRIVATE MEM_RESERVE                                    PageHeap   [PageHeap: 1f241000; NormalHeap: 1f410000]

20b5d000 20b5e000     1000 MEM_PRIVATE MEM_COMMIT  PAGE_READWRITE                     PageHeap   [PageHeap: 1f241000; NormalHeap: 1f410000]

20b5e000 20b5f000     1000 MEM_PRIVATE MEM_RESERVE                                    PageHeap   [PageHeap: 1f241000; NormalHeap: 1f410000]

20b5f000 20b60000     1000 MEM_PRIVATE MEM_COMMIT  PAGE_READWRITE                     PageHeap   [PageHeap: 1f241000; NormalHeap: 1f410000]

20b60000 20b61000     1000 MEM_PRIVATE MEM_RESERVE                                    PageHeap   [PageHeap: 1f241000; NormalHeap: 1f410000]

20b61000 20b62000     1000 MEM_PRIVATE MEM_COMMIT  PAGE_READWRITE                     PageHeap   [PageHeap: 1f241000; NormalHeap: 1f410000]

20b62000 20b6b000     9000 MEM_PRIVATE MEM_RESERVE                                    PageHeap   [PageHeap: 1f241000; NormalHeap: 1f410000]

20b6b000 20b6f000     4000 MEM_PRIVATE MEM_COMMIT  PAGE_READWRITE                     PageHeap   [PageHeap: 1f241000; NormalHeap: 1f410000]

20b6f000 20b71000     2000 MEM_PRIVATE MEM_RESERVE                                    PageHeap   [PageHeap: 1f241000; NormalHeap: 1f410000]

20b71000 20b72000     1000 MEM_PRIVATE MEM_COMMIT  PAGE_READWRITE                     PageHeap   [PageHeap: 1f241000; NormalHeap: 1f410000]

20b72000 20b73000     1000 MEM_PRIVATE MEM_RESERVE                                    PageHeap   [PageHeap: 1f241000; NormalHeap: 1f410000]

20b73000 20b74000     1000 MEM_PRIVATE MEM_COMMIT  PAGE_READWRITE                     PageHeap   [PageHeap: 1f241000; NormalHeap: 1f410000]

[…]
0:004> dc 20b26000 20b27000

20b26000  00000000 00000000 00000000 00000000  …………….

20b26010  00000000 00000000 00000000 00000000  …………….

20b26020  00000000 00000000 00000000 00000000  …………….

20b26030  00000000 00000000 00000000 00000000  …………….

20b26040  00000000 00000000 00000000 00000000  …………….

20b26050  00000000 00000000 00000000 00000000  …………….

20b26060  00000000 00000000 00000000 00000000  …………….

20b26070  00000000 00000000 00000000 00000000  …………….

20b26080  00000000 00000000 00000000 00000000  …………….

20b26090  00000000 00000000 00000000 00000000  …………….

20b260a0  00000000 00000000 00000000 00000000  …………….

20b260b0  00000000 00000000 00000000 00000000  …………….

20b260c0  00000000 00000000 00000000 00000000  …………….

20b260d0  00000000 00000000 00000000 00000000  …………….

20b260e0  00000000 00000000 00000000 00000000  …………….

20b260f0  00000000 00000000 00000000 00000000  …………….

20b26100  00000000 00000000 00000000 00000000  …………….

20b26110  00000000 00000000 00000000 00000000  …………….

20b26120  00000000 00000000 00000000 00000000  …………….

20b26130  00000000 00000000 00000000 00000000  …………….

20b26140  00000000 00000000 00000000 00000000  …………….

20b26150  00000000 00000000 00000000 00000000  …………….

20b26160  00000000 00000000 00000000 00000000  …………….

20b26170  00000000 00000000 00000000 00000000  …………….

20b26180  00000000 00000000 00000000 00000000  …………….

20b26190  00000000 00000000 00000000 00000000  …………….

20b261a0  00000000 00000000 00000000 00000000  …………….

20b261b0  00000000 00000000 00000000 00000000  …………….

20b261c0  00000000 00000000 00000000 00000000  …………….

20b261d0  00000000 00000000 00000000 00000000  …………….

20b261e0  00000000 00000000 00000000 00000000  …………….

20b261f0  00000000 00000000 00000000 00000000  …………….

20b26200  00000000 00000000 00000000 00000000  …………….

20b26210  00000000 00000000 00000000 00000000  …………….

20b26220  00000000 00000000 00000000 00000000  …………….

20b26230  00000000 00000000 00000000 00000000  …………….

20b26240  00000000 00000000 00000000 00000000  …………….

20b26250  00000000 00000000 00000000 00000000  …………….

20b26260  00000000 00000000 00000000 00000000  …………….

20b26270  00000000 00000000 00000000 00000000  …………….

20b26280  00000000 00000000 00000000 00000000  …………….

20b26290  00000000 00000000 00000000 00000000  …………….

20b262a0  00000000 00000000 00000000 00000000  …………….

20b262b0  00000000 00000000 00000000 00000000  …………….

20b262c0  00000000 00000000 00000000 00000000  …………….

20b262d0  00000000 00000000 00000000 00000000  …………….

20b262e0  00000000 00000000 00000000 00000000  …………….

20b262f0  00000000 00000000 00000000 00000000  …………….

20b26300  00000000 00000000 00000000 00000000  …………….

20b26310  00000000 00000000 00000000 00000000  …………….

20b26320  00000000 00000000 00000000 00000000  …………….

20b26330  00000000 00000000 00000000 00000000  …………….

20b26340  00000000 00000000 00000000 00000000  …………….

20b26350  00000000 00000000 00000000 00000000  …………….

20b26360  00000000 00000000 00000000 00000000  …………….

20b26370  00000000 00000000 00000000 00000000  …………….

20b26380  00000000 00000000 00000000 00000000  …………….

20b26390  00000000 00000000 00000000 00000000  …………….

20b263a0  00000000 00000000 00000000 00000000  …………….

20b263b0  00000000 00000000 00000000 00000000  …………….

20b263c0  00000000 00000000 00000000 00000000  …………….

20b263d0  00000000 00000000 00000000 00000000  …………….

20b263e0  00000000 00000000 00000000 00000000  …………….

20b263f0  00000000 00000000 00000000 00000000  …………….

20b26400  00000000 00000000 00000000 00000000  …………….

20b26410  00000000 00000000 00000000 00000000  …………….

20b26420  00000000 00000000 00000000 00000000  …………….

20b26430  00000000 00000000 00000000 00000000  …………….

20b26440  00000000 00000000 00000000 00000000  …………….

20b26450  00000000 00000000 00000000 00000000  …………….

20b26460  00000000 00000000 00000000 00000000  …………….

20b26470  00000000 00000000 00000000 00000000  …………….

20b26480  00000000 00000000 00000000 00000000  …………….

20b26490  00000000 00000000 00000000 00000000  …………….

20b264a0  00000000 00000000 00000000 00000000  …………….

20b264b0  00000000 00000000 00000000 00000000  …………….

20b264c0  00000000 00000000 00000000 00000000  …………….

20b264d0  00000000 00000000 00000000 00000000  …………….

20b264e0  00000000 00000000 00000000 00000000  …………….

20b264f0  00000000 00000000 00000000 00000000  …………….

20b26500  00000000 00000000 00000000 00000000  …………….

20b26510  00000000 00000000 00000000 00000000  …………….

20b26520  00000000 00000000 00000000 00000000  …………….

20b26530  00000000 00000000 00000000 00000000  …………….

20b26540  00000000 00000000 00000000 00000000  …………….

20b26550  00000000 00000000 00000000 00000000  …………….

20b26560  00000000 00000000 00000000 00000000  …………….

20b26570  00000000 00000000 00000000 00000000  …………….

20b26580  00000000 00000000 00000000 00000000  …………….

20b26590  00000000 00000000 00000000 00000000  …………….

20b265a0  00000000 00000000 00000000 00000000  …………….

20b265b0  00000000 00000000 00000000 00000000  …………….

20b265c0  00000000 00000000 00000000 00000000  …………….

20b265d0  00000000 00000000 00000000 00000000  …………….

20b265e0  00000000 00000000 00000000 00000000  …………….

20b265f0  00000000 00000000 00000000 00000000  …………….

20b26600  00000000 00000000 00000000 00000000  …………….

20b26610  00000000 00000000 00000000 00000000  …………….

20b26620  00000000 00000000 00000000 00000000  …………….

20b26630  00000000 00000000 00000000 00000000  …………….

20b26640  00000000 00000000 00000000 00000000  …………….

20b26650  00000000 00000000 00000000 00000000  …………….

20b26660  00000000 00000000 00000000 00000000  …………….

20b26670  00000000 00000000 00000000 00000000  …………….

20b26680  00000000 00000000 00000000 00000000  …………….

20b26690  00000000 00000000 00000000 00000000  …………….

20b266a0  00000000 00000000 00000000 00000000  …………….

20b266b0  00000000 00000000 00000000 00000000  …………….

20b266c0  00000000 00000000 00000000 00000000  …………….

20b266d0  00000000 00000000 00000000 00000000  …………….

20b266e0  00000000 00000000 00000000 00000000  …………….

20b266f0  00000000 00000000 00000000 00000000  …………….

20b26700  00000000 00000000 00000000 00000000  …………….

20b26710  00000000 00000000 00000000 00000000  …………….

20b26720  00000000 00000000 00000000 00000000  …………….

20b26730  00000000 00000000 00000000 00000000  …………….

20b26740  00000000 00000000 00000000 00000000  …………….

20b26750  00000000 00000000 00000000 00000000  …………….

20b26760  00000000 00000000 00000000 00000000  …………….

20b26770  00000000 00000000 00000000 00000000  …………….

20b26780  00000000 00000000 00000000 00000000  …………….

20b26790  00000000 00000000 00000000 00000000  …………….

20b267a0  00000000 00000000 00000000 00000000  …………….

20b267b0  00000000 00000000 00000000 00000000  …………….

20b267c0  00000000 00000000 00000000 00000000  …………….

20b267d0  00000000 00000000 00000000 00000000  …………….

20b267e0  00000000 00000000 00000000 00000000  …………….

20b267f0  00000000 00000000 00000000 00000000  …………….

20b26800  00000000 00000000 00000000 00000000  …………….

20b26810  00000000 00000000 00000000 00000000  …………….

20b26820  00000000 00000000 00000000 00000000  …………….

20b26830  00000000 00000000 00000000 00000000  …………….

20b26840  00000000 00000000 00000000 00000000  …………….

20b26850  00000000 00000000 00000000 00000000  …………….

20b26860  00000000 00000000 00000000 00000000  …………….

20b26870  00000000 00000000 00000000 00000000  …………….

20b26880  00000000 00000000 00000000 00000000  …………….

20b26890  00000000 00000000 00000000 00000000  …………….

20b268a0  00000000 00000000 00000000 00000000  …………….

20b268b0  00000000 00000000 00000000 00000000  …………….

20b268c0  00000000 00000000 00000000 00000000  …………….

20b268d0  00000000 00000000 00000000 00000000  …………….

20b268e0  00000000 00000000 00000000 00000000  …………….

20b268f0  00000000 00000000 00000000 00000000  …………….

20b26900  00000000 00000000 00000000 00000000  …………….

20b26910  00000000 00000000 00000000 00000000  …………….

20b26920  00000000 00000000 00000000 00000000  …………….

20b26930  00000000 00000000 00000000 00000000  …………….

20b26940  00000000 00000000 00000000 00000000  …………….

20b26950  00000000 00000000 00000000 00000000  …………….

20b26960  00000000 00000000 00000000 00000000  …………….

20b26970  00000000 00000000 00000000 00000000  …………….

20b26980  00000000 00000000 00000000 00000000  …………….

20b26990  00000000 00000000 00000000 00000000  …………….

20b269a0  00000000 00000000 00000000 00000000  …………….

20b269b0  00000000 00000000 00000000 00000000  …………….

20b269c0  00000000 00000000 00000000 00000000  …………….

20b269d0  00000000 00000000 00000000 00000000  …………….

20b269e0  00000000 00000000 00000000 00000000  …………….

20b269f0  00000000 00000000 00000000 00000000  …………….

20b26a00  00000000 00000000 00000000 00000000  …………….

20b26a10  00000000 00000000 00000000 00000000  …………….

20b26a20  00000000 00000000 00000000 00000000  …………….

20b26a30  00000000 00000000 00000000 00000000  …………….

20b26a40  00000000 00000000 00000000 00000000  …………….

20b26a50  00000000 00000000 00000000 00000000  …………….

20b26a60  00000000 00000000 00000000 00000000  …………….

20b26a70  00000000 00000000 00000000 00000000  …………….

20b26a80  00000000 00000000 00000000 00000000  …………….

20b26a90  00000000 00000000 00000000 00000000  …………….

20b26aa0  00000000 00000000 00000000 00000000  …………….

20b26ab0  00000000 00000000 00000000 00000000  …………….

20b26ac0  00000000 00000000 00000000 00000000  …………….

20b26ad0  00000000 00000000 00000000 00000000  …………….

20b26ae0  00000000 00000000 00000000 00000000  …………….

20b26af0  00000000 00000000 00000000 00000000  …………….

20b26b00  00000000 00000000 00000000 00000000  …………….

20b26b10  00000000 00000000 00000000 00000000  …………….

20b26b20  00000000 00000000 00000000 00000000  …………….

20b26b30  00000000 00000000 00000000 00000000  …………….

20b26b40  00000000 00000000 00000000 00000000  …………….

20b26b50  00000000 00000000 00000000 00000000  …………….

20b26b60  00000000 00000000 00000000 00000000  …………….

20b26b70  00000000 00000000 00000000 00000000  …………….

20b26b80  00000000 00000000 00000000 00000000  …………….

20b26b90  00000000 00000000 00000000 00000000  …………….

20b26ba0  00000000 00000000 00000000 00000000  …………….

20b26bb0  00000000 00000000 00000000 00000000  …………….

20b26bc0  00000000 00000000 00000000 00000000  …………….

20b26bd0  00000000 00000000 00000000 00000000  …………….

20b26be0  00000000 00000000 00000000 00000000  …………….

20b26bf0  00000000 00000000 00000000 00000000  …………….

20b26c00  00000000 00000000 00000000 00000000  …………….

20b26c10  00000000 00000000 00000000 00000000  …………….

20b26c20  00000000 00000000 00000000 00000000  …………….

20b26c30  00000000 00000000 00000000 00000000  …………….

20b26c40  00000000 00000000 00000000 00000000  …………….

20b26c50  00000000 00000000 00000000 00000000  …………….

20b26c60  00000000 00000000 00000000 00000000  …………….

20b26c70  00000000 00000000 00000000 00000000  …………….

20b26c80  00000000 00000000 00000000 00000000  …………….

20b26c90  00000000 00000000 00000000 00000000  …………….

20b26ca0  00000000 00000000 00000000 00000000  …………….

20b26cb0  00000000 00000000 00000000 00000000  …………….

20b26cc0  00000000 00000000 00000000 00000000  …………….

20b26cd0  00000000 00000000 00000000 00000000  …………….

20b26ce0  00000000 00000000 00000000 00000000  …………….

20b26cf0  00000000 00000000 00000000 00000000  …………….

20b26d00  00000000 00000000 00000000 00000000  …………….

20b26d10  00000000 00000000 00000000 00000000  …………….

20b26d20  00000000 00000000 00000000 00000000  …………….

20b26d30  00000000 00000000 00000000 00000000  …………….

20b26d40  00000000 00000000 00000000 00000000  …………….

20b26d50  00000000 00000000 00000000 00000000  …………….

20b26d60  00000000 00000000 00000000 00000000  …………….

20b26d70  00000000 00000000 00000000 00000000  …………….

20b26d80  00000000 00000000 00000000 00000000  …………….

20b26d90  00000000 00000000 00000000 00000000  …………….

20b26da0  00000000 00000000 00000000 00000000  …………….

20b26db0  00000000 00000000 00000000 00000000  …………….

20b26dc0  00000000 00000000 00000000 00000000  …………….

20b26dd0  00000000 00000000 00000000 00000000  …………….

20b26de0  00000000 00000000 00000000 00000000  …………….

20b26df0  00000000 00000000 00000000 00000000  …………….

20b26e00  00000000 00000000 00000000 00000000  …………….

20b26e10  00000000 00000000 00000000 00000000  …………….

20b26e20  00000000 00000000 00000000 00000000  …………….

20b26e30  00000000 00000000 00000000 00000000  …………….

20b26e40  00000000 00000000 00000000 00000000  …………….

20b26e50  00000000 00000000 00000000 00000000  …………….

20b26e60  00000000 00000000 00000000 00000000  …………….

20b26e70  00000000 00000000 00000000 00000000  …………….

20b26e80  00000000 00000000 00000000 00000000  …………….

20b26e90  00000000 00000000 00000000 00000000  …………….

20b26ea0  00000000 00000000 00000000 00000000  …………….

20b26eb0  00000000 00000000 00000000 00000000  …………….

20b26ec0  00000000 00000000 00000000 00000000  …………….

20b26ed0  00000000 00000000 abcdbbbb 1f241000  …………..$.

20b26ee0  00000108 00000108 00000000 00000000  …………….

20b26ef0  011c6b10 dcbabbbb 1f1bc8b4 00000002  .k…………..

20b26f00  20b79fd0 20b85fd0 20b28fe8 20b2ffe0  … ._. … …

20b26f10  20b3ffe0 20b4bfe8 20b51fe8 20b57fe8  … … … …

20b26f20  00000000 00000000 20b5dfa8 00000000  ……….. ….

20b26f30  00000000 00000000 1f1bcbf0 00000000  …………….

20b26f40  20b71ff8 00000010 1f1bcbf0 00000000  … …………

20b26f50  20b73ff8 00000010 1f1bcbf0 00000000  .?. …………

20b26f60  20b75ff8 00000010 1f1bcbf0 00000000  ._. …………

20b26f70  20b77ff8 00000010 00000000 00000000  … …………

20b26f80  c0c0c001 00000000 c0c00000 00000002  …………….

20b26f90  01000000 00000101 00000000 00000000  …………….

20b26fa0  00000000 c0c0c000 00000000 00000001  …………….

20b26fb0  00000000 00000000 00000000 00000000  …………….

20b26fc0  00000000 00000000 00000000 00000000  …………….

20b26fd0  00000000 00000000 00000000 00000000  …………….

20b26fe0  00000000 00000000 00000000 00000000  …………….

20b26ff0  00000000 00000000 00000000 c0c0c000  …………….

20b27000  ????????                             ????
- Dmitry Vostokov @ DumpAnalysis.org + TraceAnalysis.org -
Posted in Crash Dump Analysis, Debugging | No Comments »
February 1st, 2013
Memorianic prophecy 0m3 says: “Memory is infinitude of memories.” In monistic aspect plural interpretation of Memoidealism memory is also an attribute of itself. Memorianity considers all memories of the same substance as eternal Memory. All memories are distinct, yet they are one essence. There is only one Memory in memories. Each memory is only distinct in relation to other memories. In M-Memory M stands for Multiplicity. One analogy here is the concept of Trinity with the infinite number of hypostases instead of just 3.
- Dmitry Vostokov @ DumpAnalysis.org + TraceAnalysis.org -
Posted in Memoidealism, Memorianic Pilgrimages, Memory Religion (Memorianity), Philosophy, Religion | No Comments »
February 1st, 2013
This pattern (we call it String Hint) covers traces of ASCII and UNICODE strings that look suspicious such as website, password and HTTP forms or strange names that intuitively shouldn’t be present according to the purpose of a module or its container process (example is taken from Victimware presentation case study):
0:005> s-sa 00040000 L1d000

0004004d  "!This program cannot be run in D"

0004006d  "OS mode."

00040081  "3y@"

000400b8  "Rich"

000401d0  ".text"

000401f7  "`.rdata"

0004021f  "@.data"

00040248  ".reloc"

[...]

00054018  "GET /stat?uptime=%d&downlink=%d&"

00054038  "uplink=%d&id=%s&statpass=%s&comm"

00054058  "ent=%s HTTP/1.0"

000540ac  "%s%s%s"

000540d8  "ftp://%s:%s@%s:%d"

000540fc  "Accept-Encoding:"

00054118  "Accept-Encoding:"

00054130  "0123456789ABCDEF"

00054144  "://"

00054160  "POST %s HTTP/1.0"

00054172  "Host: %s"

0005417c  "User-Agent: %s"

0005418c  "Accept: text/html"

0005419f  "Connection: Close"

000541b2  "Content-Type: application/x-www-"

000541d2  "form-urlencoded"

000541e3  "Content-Length: %d"

000541fc  "id="

00054208  "POST %s HTTP/1.1"

0005421a  "Host: %s"

00054224  "User-Agent: %s"

00054234  "Accept: text/html"

00054247  "Connection: Close"

0005425a  "Content-Type: application/x-www-"

0005427a  "form-urlencoded"

0005428b  "Content-Length: %d"

000542a4  "id=%s&base="

000542b8  "id=%s&brw=%d&type=%d&data="

000542d8  "POST %s HTTP/1.1"

000542ea  "Host: %s"

000542f4  "User-Agent: %s"

00054304  "Accept: text/html"

00054317  "Connection: Close"

0005432a  "Content-Type: application/x-www-"

0005434a  "form-urlencoded"

0005435b  "Content-Length: %d"

00054378  "id=%s&os=%s&plist="

00054390  "POST %s HTTP/1.1"

000543a2  "Host: %s"

000543ac  "User-Agent: %s"

000543bc  "Accept: text/html"

000543cf  "Connection: Close"

000543e2  "Content-Type: application/x-www-"

00054402  "form-urlencoded"

00054413  "Content-Length: %d"

00054430  "id=%s&data=%s"

00054440  "POST %s HTTP/1.1"

00054452  "Host: %s"

0005445c  "User-Agent: %s"

0005446c  "Accept: text/html"

0005447f  "Connection: Close"

00054492  "Content-Type: application/x-www-"

000544b2  "form-urlencoded"

000544c3  "Content-Length: %d"

000544e0  "GET %s HTTP/1.0"

000544f1  "Host: %s"

000544fb  "User-Agent: %s"

0005450b  "Connection: close"

00054528  "POST /get/scr.html HTTP/1.0"

00054545  "Host: %s"

0005454f  "User-Agent: %s"

0005455f  "Connection: close"

00054572  "Content-Length: %d"

00054586  "Content-Type: multipart/form-dat"

000545a6  "a; boundary=--------------------"

000545c6  "-------%d"

000545d4  "-----------------------------%d"

000545f8  "%sContent-Disposition: form-data"

00054618  "; name="id""

00054630  "%sContent-Disposition: form-data"

00054650  "; name="screen"; filename="%d""

00054670  "Content-Type: application/octet-"

00054690  "stream"

000546a0  "%s(%d) : %s"

000546ac  "%s failed with error %d: %s"

000546c8  "%02X"

000546d8  "BlackwoodPRO"

000546e8  "FinamDirect"

000546f4  "GrayBox"

000546fc  "MbtPRO"

00054704  "Laser"

0005470c  "LightSpeed"

00054718  "LTGroup"

00054720  "Mbt"

00054724  "ScotTrader"

00054730  "SaxoTrader"

00054740  "Program:   %s"

0005474f  "Username:  %s"

0005475e  "Password:  %s"

0005476d  "AccountNO: %s"

[...]
- Dmitry Vostokov @ DumpAnalysis.org + TraceAnalysis.org -
Posted in Crash Dump Analysis, Malware Analysis, Malware Patterns, Victimware, Victimware Analysis, x64 Windows | No Comments »
January 29th, 2013
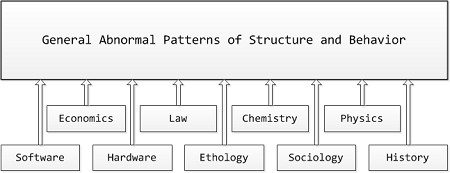
Memory Analysis Patterns (MAPs) including memory dump, malware, software trace (TAPs), and other patterns and pattern catalogs from Software Diagnostics Institute form the very rich semantic network. Now it is possible (by using a metaphorical bijection) to create a catalog of General Patterns of Abnormal Structure and Behaviour including software, hardware, biological behavior including animal (ethology) and human behavior, sociological and historical behavior including economics, business and finance, ethics and law, and even behavior of chemical and physical systems. Such “GAPs of Structure and Behavior” may include wait chains, spikes, deadlocks, etc. We provide more specific examples in the forthcoming parts. So we are a few steps closer to realization of my old dangerous idea of a parameterized science of universal memory dumps by the so called science files or might event a general diagnostics discipline.
- Dmitry Vostokov @ DumpAnalysis.org + TraceAnalysis.org -
Posted in Announcements, Anthropology, Biology, Business, Catastrophe Theory, Causality, Chaos, Chemistry, Complexity, Computation, Economics, Ethics, General Abnormal Patterns, General Memory Analysis, General Science, Hardware, History, Humanities, Ideas, Language, Life, Medicine, Physics, Political Economy, Politics, Psychoanalysis, Psychology, Religion, Semantics, Semiotics, Social Media, Social Sciences, Software Generalist Worldview, Software and Business, Software and Economics, Software and History, Software and Industrial Production, Software and Politics, Software and Religion, Software and Science, Software and Sociology, Structural Memory Analysis and Social Sciences, Systems Theory, Systems Thinking | No Comments »
January 23rd, 2013
What is a role of perceived memory deficient matter in Memorianity where Memory consists of memories (Memorianic Prophecy 0m3)? Matter are boundaries of memories as illustrated on this schematic diagram:
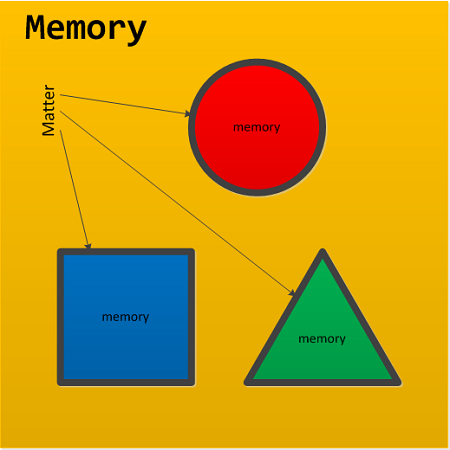
We can also reverse monistic aspect pluralism of Memoidealism and consider substances as boundaries of memories too.
- Dmitry Vostokov @ DumpAnalysis.org + TraceAnalysis.org -
Posted in Memoidealism, Memory Religion (Memorianity), Philosophy, Religion | No Comments »
January 22nd, 2013
I don’t know how I missed it. It was the first real life slang I heard almost 10 years ago during hot political and critical crash dump analysis session.
DD That - Analyze that simply.
Although more correctly would be to say DP That at that time when I heard it 64-bit computing wasn’t a mainstream yet. Based on dd WinDbg command to dump raw binary data starting from a given 32-bit memory address.
Examples: I dd-ed that and found an ASCII.
- Dmitry Vostokov @ DumpAnalysis.org + TraceAnalysis.org -
Posted in Debugging Slang, Fun with Crash Dumps, Fun with Debugging, Fun with WinDbg | No Comments »
January 22nd, 2013
STATUS - Something important to check for just now.
Examples: If only programmers checked statuses of their functions more often than statuses on Facebook…
- Dmitry Vostokov @ DumpAnalysis.org + TraceAnalysis.org -
Posted in Debugging Slang, Fun with Crash Dumps, Fun with Debugging, Fun with Software Diagnostics, Fun with Software Traces | No Comments »
January 20th, 2013
Injected code address may not be in the address ranges of loaded modules. In such cases, in the execution call history we would see plain EIP and RIP return addresses on stack traces. We call this pattern RIP Stack Trace partly because we have seen these addresses after something had gone wrong and a process crashed:
0:005> k

ChildEBP RetAddr

02aec974 77655620 ntdll!KiFastSystemCallRet

02aec978 77683c62 ntdll!NtWaitForSingleObject+0xc

02aec9fc 77683d4b ntdll!RtlReportExceptionEx+0x14b

02aeca3c 7769fa87 ntdll!RtlReportException+0x3c

02aeca50 7769fb0d ntdll!RtlpTerminateFailureFilter+0x14

02aeca5c 775f9bdc ntdll!RtlReportCriticalFailure+0x6b

02aeca70 775f4067 ntdll!_EH4_CallFilterFunc+0x12

02aeca98 77655f79 ntdll!_except_handler4+0x8e

02aecabc 77655f4b ntdll!ExecuteHandler2+0x26

02aecb6c 77655dd7 ntdll!ExecuteHandler+0x24

02aecb6c 7769faf8 ntdll!KiUserExceptionDispatcher+0xf

02aecee0 776a0704 ntdll!RtlReportCriticalFailure+0x5b

02aecef0 776a07f2 ntdll!RtlpReportHeapFailure+0x21

02aecf24 7766b1a5 ntdll!RtlpLogHeapFailure+0xa1

02aecf6c 7765730a ntdll!RtlpCoalesceFreeBlocks+0x4b9

02aed064 77657545 ntdll!RtlpFreeHeap+0x1e2

02aed080 75e47e4b ntdll!RtlFreeHeap+0x14e

02aed0c8 77037277 kernel32!GlobalFree+0x47

02aed0dc 774b4a1f ole32!ReleaseStgMedium+0x124

02aed0f0 77517feb urlmon!ReleaseBindInfo+0x4c

02aed100 774d9a87 urlmon!CINet::ReleaseCNetObjects+0x3d

02aed118 774d93f0 urlmon!CINetHttp::OnWininetRequestHandleClosing+0x60

02aed12c 76432078 urlmon!CINet::CINetCallback+0x2de

02aed274 76438f5d wininet!InternetIndicateStatus+0xfc

02aed2a4 7643937a wininet!HANDLE_OBJECT::~HANDLE_OBJECT+0xc9

02aed2c0 7643916b wininet!INTERNET_CONNECT_HANDLE_OBJECT::~INTERNET_CONNECT_HANDLE_OBJECT+0x209

02aed2cc 76438d5e wininet!HTTP_REQUEST_HANDLE_OBJECT::`vector deleting destructor'+0xd

02aed2dc 76434e72 wininet!HANDLE_OBJECT::Dereference+0x22

02aed2e8 76439419 wininet!DereferenceObject+0x21

02aed310 76439114 wininet!_InternetCloseHandle+0x9d

02aed330 0004aaaf wininet!InternetCloseHandle+0x11e

WARNING: Frame IP not in any known module. Following frames may be wrong.

02aed33c 774c5d25 0×4aaaf

02aed358 774c5d95 urlmon!CINet::TerminateRequest+0×82

02aed364 774c5d7c urlmon!CINet::MyUnlockRequest+0×10

02aed370 774c5d63 urlmon!CINetProtImpl::UnlockRequest+0×10

02aed37c 774c5d49 urlmon!CINetEmbdFilter::UnlockRequest+0×11

02aed388 774b743d urlmon!CINet::UnlockRequest+0×13

02aed394 774b73e1 urlmon!COInetProt::UnlockRequest+0×11

02aed3a8 774b7530 urlmon!CTransaction::UnlockRequest+0×36

02aed3b4 774b74e0 urlmon!CTransData::~CTransData+0×3a

02aed3c0 774b74c9 urlmon!CTransData::`scalar deleting destructor’+0xd

02aed3d8 774e221f urlmon!CTransData::Release+0×25

02aed3e0 774b6d0a urlmon!CReadOnlyStreamDirect::~CReadOnlyStreamDirect+0×1a

02aed3ec 774b7319 urlmon!CReadOnlyStreamDirect::`vector deleting destructor’+0xd

02aed404 774b72be urlmon!CReadOnlyStreamDirect::Release+0×25

02aed410 774b71f4 urlmon!CBinding::~CBinding+0xb9

02aed41c 774b71dd urlmon!CBinding::`scalar deleting destructor’+0xd

02aed434 6b20b0e8 urlmon!CBinding::Release+0×25

02aed448 6b20b0ba mshtml!ATL::AtlComPtrAssign+0×2b

02aed458 6b20b8de mshtml!ATL::CComPtr<IBindCallbackInternal>::operator=+0×15

02aed464 6b20b8aa mshtml!CBindingXSSFilter::TearDown+0×2b

02aed46c 6b20b887 mshtml!BindingXSSFilter_TearDown+0×19

02aed478 6b0da61a mshtml!CStreamProxy::Passivate+0×12

02aed484 6b0ddf3a mshtml!CBaseFT::Release+0×1d

02aed4ac 6b0e0b70 mshtml!CDwnBindData::TerminateBind+0×11d

02aed4b8 6b11a2a9 mshtml!CDwnBindData::TerminateOnApt+0×14

02aed4ec 6b105066 mshtml!GlobalWndOnMethodCall+0xfb

02aed50c 7742fd72 mshtml!GlobalWndProc+0×183

02aed538 7742fe4a user32!InternalCallWinProc+0×23

02aed5b0 7743018d user32!UserCallWinProcCheckWow+0×14b

02aed614 7743022b user32!DispatchMessageWorker+0×322

02aed624 6ecac1d5 user32!DispatchMessageW+0xf

02aef72c 6ec5337e ieframe!CTabWindow::_TabWindowThreadProc+0×54c

02aef7e4 760f426d ieframe!LCIETab_ThreadProc+0×2c1

02aef7f4 75e4d0e9 iertutil!CIsoScope::RegisterThread+0xab

02aef800 776319bb kernel32!BaseThreadInitThunk+0xe

02aef840 7763198e ntdll!__RtlUserThreadStart+0×23

02aef858 00000000 ntdll!_RtlUserThreadStart+0×1b
However, such addresses need to be checked whether they belong to .NET CLR JIT code.
- Dmitry Vostokov @ DumpAnalysis.org + TraceAnalysis.org -
Posted in Assembly Language, Crash Dump Analysis, Malware Analysis, Malware Patterns | No Comments »
January 20th, 2013
We skip parts 5 (Module Collection), 6 (No Component Symbols, for looking at import tables), 7 (Stack Trace Collection, for listing active processes, threads and their stack traces), 8 (Hidden Module), and 9 (Hidden Process). The new pattern here is called Driver Device Collection and can be used to compare the current list of device and driver objects with some saved reference list to find out any changes. This listing can be done by using !object command:
0: kd> !object \Driver

[...]
0: kd> !object \FileSystem

[...]
0: kd> !object \Device

[...]
Note that the collection is called Driver Device and not Device Driver.
- Dmitry Vostokov @ DumpAnalysis.org + TraceAnalysis.org -
Posted in Complete Memory Dump Analysis, Crash Dump Analysis, Malware Analysis, Malware Patterns | No Comments »
January 19th, 2013
The next pattern is closely linked to packed and/or obfuscated code. We call it Pre-Obfuscation Residue. Depending on a level of obfuscation and/or packing some initial code and data structures and patterns including fragments of strings may leak in post-obfuscation data giving a clue to intended software behavior:
0:000> s-sa 00000000`00fd4000 L6000

[...]

00000000`00fd943d  "o__"

00000000`00fd9449  "91!We"

00000000`00fd945d  "H5!"

00000000`00fd94d2  "zQ@"

00000000`00fd94dd  "ommandS"

00000000`00fd94f4  “IsDeb”

00000000`00fd94fd  “uggerP”

00000000`00fd9507  “Enc”

00000000`00fd950c  “v)3Po4t”

00000000`00fd9515  “DeXU”

00000000`00fd9520  “xFe”

00000000`00fd952a  “5Eb”

00000000`00fd9533  “SI=l8kev”

00000000`00fd953e  “Z_1m”

00000000`00fd9547  “@IF”

[…]
- Dmitry Vostokov @ DumpAnalysis.org + TraceAnalysis.org -
Posted in Crash Dump Analysis, Malware Analysis, Malware Patterns | No Comments »
January 19th, 2013
Packed Code is frequent ingredient of armored malware. Here we demonstrate a few WinDbg commands to detect UPX packed modules with little or no expected strings:
0:000> !dh 00000000`00fd40b0
File Type: DLL

FILE HEADER VALUES

14C machine (i386)

3 number of sections

time date stamp Fri Jan 18 21:27:25 2013
0 file pointer to symbol table

0 number of symbols

E0 size of optional header

2102 characteristics

Executable

32 bit word machine

DLL
OPTIONAL HEADER VALUES

10B magic #

11.00 linker version

6000 size of code

1000 size of initialized data

F000 size of uninitialized data

15600 address of entry point

10000 base of code

----- new -----

0000000010000000 image base

1000 section alignment

200 file alignment

2 subsystem (Windows GUI)

6.00 operating system version

0.00 image version

6.00 subsystem version

17000 size of image

1000 size of headers

0 checksum

0000000000100000 size of stack reserve

0000000000001000 size of stack commit

0000000000100000 size of heap reserve

0000000000001000 size of heap commit

140  DLL characteristics

Dynamic base

NX compatible

16274 [      AC] address [size] of Export Directory

161DC [      98] address [size] of Import Directory

16000 [     1DC] address [size] of Resource Directory

0 [       0] address [size] of Exception Directory

0 [       0] address [size] of Security Directory

16320 [      10] address [size] of Base Relocation Directory

0 [       0] address [size] of Debug Directory

0 [       0] address [size] of Description Directory

0 [       0] address [size] of Special Directory

0 [       0] address [size] of Thread Storage Directory

157CC [      48] address [size] of Load Configuration Directory

0 [       0] address [size] of Bound Import Directory

0 [       0] address [size] of Import Address Table Directory

0 [       0] address [size] of Delay Import Directory

0 [       0] address [size] of COR20 Header Directory

0 [       0] address [size] of Reserved Directory

SECTION HEADER #1

UPX0 name

F000 virtual size

1000 virtual address

0 size of raw data

400 file pointer to raw data

0 file pointer to relocation table

0 file pointer to line numbers

0 number of relocations

0 number of line numbers

E0000080 flags

Uninitialized Data

(no align specified)

Execute Read Write
SECTION HEADER #2

UPX1 name

6000 virtual size

10000 virtual address

5A00 size of raw data

400 file pointer to raw data

0 file pointer to relocation table

0 file pointer to line numbers

0 number of relocations

0 number of line numbers

E0000040 flags

Initialized Data

(no align specified)

Execute Read Write
SECTION HEADER #3

.rsrc name

1000 virtual size

16000 virtual address

400 size of raw data

5E00 file pointer to raw data

0 file pointer to relocation table

0 file pointer to line numbers

0 number of relocations

0 number of line numbers

C0000040 flags

Initialized Data

(no align specified)

Read Write
0:000> s-sa 00000000`00fd40b0 L6600

00000000`00fd40fd  "!This program cannot be run in D"

00000000`00fd411d  "OS mode."

00000000`00fd4188  "Rich"

00000000`00fd4290  “UPX0″

00000000`00fd42b8  “UPX1″

00000000`00fd42e0  “.rsrc”

00000000`00fd448b  “3.08″

00000000`00fd4490  “UPX!”

00000000`00fd449b  “YhHM4″

00000000`00fd44d1  “vqx”

[…]
Such in-memory modules (not yet initialized by a loader) can be saved to disk using .writemem command and unpacked. Once loaded and relocated into some address they still have UPX sections but also they now have more strings:
0:000> s-sa 00000000`691c0000 L300

00000000`691c004d  "!This program cannot be run in D"

00000000`691c006d  "OS mode."

00000000`691c00d8  "Rich"

00000000`691c01e0  “UPX0″

00000000`691c0207  “`UPX1″

00000000`691c022f  “`.rsrc”

[…]

00000000`691d620b  “uGC”

00000000`691d621c  “KERNEL32.DLL”

00000000`691d622a  “LoadLibraryA”

00000000`691d6238  “GetProcAddress”

00000000`691d6248  “VirtualProtect”

00000000`691d6258  “VirtualAlloc”

00000000`691d6266  “VirtualFree”

[…]
0:000> s-su 00000000`691c0000 L(00000000`691d7000-00000000`691c0000)

[...]

00000000`691c8178  “http://www.dumpanalysis.com”

00000000`691c8260  “mscoree.dll”

[…]
- Dmitry Vostokov @ DumpAnalysis.org + TraceAnalysis.org -
Posted in Crash Dump Analysis, Malware Analysis, Malware Patterns | No Comments »
January 18th, 2013
Whereas some false positives can be considered soft debugger bugs false negatives can have more severe impact on software behavior analysis especially in malware analysis. We name this pattern Debugger Omission. Typical example here is current .imgscan command which according to documentation should by default scan virtual process space for MZ/PE signatures. Unfortunately it doesn’t detect such signatures in resource pages (we haven’t checked stack regions yet):
0000000000fd0000 image base
SECTION HEADER #4

.rsrc name

6430 virtual size

4000 virtual address

6600 size of raw data

1600 file pointer to raw data

0 file pointer to relocation table

0 file pointer to line numbers

0 number of relocations

0 number of line numbers

40000040 flags

Initialized Data

(no align specified)

Read Only
0:000> .imgscan /r 00000000`00fd4000 L200
0:000> s -[l2]sa 00000000`00fd4000 l200

00000000`00fd40b0  "MZ"

00000000`00fd40fd  "!This program cannot be run in D"

00000000`00fd411d  "OS mode."

00000000`00fd4188  "Rich"

00000000`00fd4198  "PE"
0:000> !dh 00000000`00fd40b0
File Type: DLL

FILE HEADER VALUES

14C machine (i386)

3 number of sections

time date stamp Fri Jan 18 21:27:25 2013
0 file pointer to symbol table

0 number of symbols

E0 size of optional header

2102 characteristics

Executable

32 bit word machine

DLL

[...]
Another other analysis scenarios found will be added to this pattern. Milder version of it includes !analyze -v that shows us a breakpoint instead of an exception violation from a parallel thread.
- Dmitry Vostokov @ DumpAnalysis.org + TraceAnalysis.org -
Posted in Crash Dump Analysis, Crash Dump Patterns, Debugging, Malware Analysis, x64 Windows | No Comments »