Coping with missing symbolic information

July 5th, 2007

Sometimes there is no private PDB file available for a module in a crash dump although we know they exist for different versions of the same module. The typical example is when we have a public PDB file loaded automatically and we need access to structure definitions, for example, _TEB or _PEB. In this case we need to force WinDbg to load an additional PDB file just to be able to use these structure definitions. This can be achieved by loading an additional module at a different address and forcing it to use another private PDB file. At the same time we want to keep the original module to reference the correct PDB file albeit the public one. Let’s look at one concrete example.   

I was trying to get stack limits for a thread by using !teb command:

0:000> !teb
TEB at 7efdd000
*** Your debugger is not using the correct symbols
***
*** In order for this command to work properly, your symbol path
*** must point to .pdb files that have full type information.
***
*** Certain .pdb files (such as the public OS symbols) do not
*** contain the required information.  Contact the group that
*** provided you with these symbols if you need this command to
*** work.
***
*** Type referenced: ntdll!_TEB
***
error InitTypeRead( TEB )…
0:000> dt ntdll!*

lm command showed that the symbol file was loaded and it was correct so perhaps it was the public symbol file or _TEB definition was missing in it: 

0:000> lm m ntdll
start    end      module name
7d600000 7d6f0000 ntdll (pdb symbols) c:\websymbols\wntdll.pdb\ 40B574C84D5C42708465A7E4A1E4D7CC2\wntdll.pdb

I looked at the size of wntdll.pdb and it was 1,091Kb. I searched for other ntdll.pdb files, found one with the bigger size 1,187Kb and appended it to my symbol search path:

0:000> .sympath+ C:\websymbols\ntdll.pdb\ DCE823FCF71A4BF5AA489994520EA18F2
Symbol search path is: SRV*c:\websymbols*http://msdl.microsoft.com/download/symbols; C:\websymbols\ntdll.pdb\DCE823FCF71A4BF5AA489994520EA18F2

Then I looked at my symbol cache folder for ntdll.dll, chose a path to a random one and loaded it at the address not occupied by other modules forcing to load symbol files and ignore a mismatch if any:

0:000> .reload /f /i C:\websymbols\ntdll.dll\45D709FFf0000\ntdll.dll=7E000000
0:000> lm
start    end        module name
...
...
...
7d600000 7d6f0000   ntdll      (pdb symbols)          c:\websymbols\wntdll.pdb\40B574C84D5C42708465A7E4A1E4D7CC2\wntdll.pdb
7d800000 7d890000   GDI32      (deferred)
7d8d0000 7d920000   Secur32    (deferred)
7d930000 7da00000   USER32     (deferred)
7da20000 7db00000   RPCRT4     (deferred)
7e000000 7e000000   ntdll_7e000000   (pdb symbols)          C:\websymbols\ntdll.pdb\DCE823FCF71A4BF5AA489994520EA18F2\ntdll.pdb

The additional ntdll.dll was loaded at 7e000000 address and its module name became ntdll_7e000000. Because I knew TEB address I could see the values of _TEB structure fields immediately:

0:000> dt -r1 ntdll_7e000000!_TEB 7efdd000
   +0×000 NtTib            : _NT_TIB
      +0×000 ExceptionList    : 0×0012fec0 _EXCEPTION_REGISTRATION_RECORD
      +0×004 StackBase        : 0×00130000
      +0×008 StackLimit       : 0×0011c000

      +0×00c SubSystemTib     : (null)
      +0×010 FiberData        : 0×00001e00
      +0×010 Version          : 0×1e00
      +0×014 ArbitraryUserPointer : (null)
      +0×018 Self             : 0×7efdd000 _NT_TIB
   +0×01c EnvironmentPointer : (null)
   +0×020 ClientId         : _CLIENT_ID
      +0×000 UniqueProcess    : 0×00000e0c
      +0×004 UniqueThread     : 0×000013dc
   +0×028 ActiveRpcHandle  : (null)
   +0×02c ThreadLocalStoragePointer : (null)
   +0×030 ProcessEnvironmentBlock : 0×7efde000 _PEB
      +0×000 InheritedAddressSpace : 0 ”
      +0×001 ReadImageFileExecOptions : 0×1 ”
      +0×002 BeingDebugged    : 0×1 ”
      +0×003 BitField         : 0 ”
      +0×003 ImageUsesLargePages : 0y0
      +0×003 SpareBits        : 0y0000000 (0)
      +0×004 Mutant           : 0xffffffff
      +0×008 ImageBaseAddress : 0×00400000
      +0×00c Ldr              : 0×7d6a01e0 _PEB_LDR_DATA
      +0×010 ProcessParameters : 0×00020000 _RTL_USER_PROCESS_PARAMETERS
      +0×014 SubSystemData    : (null)
      +0×018 ProcessHeap      : 0×00210000
      +0×01c FastPebLock      : 0×7d6a00e0 _RTL_CRITICAL_SECTION
      +0×020 AtlThunkSListPtr : (null)
      +0×024 SparePtr2        : (null)
      +0×028 EnvironmentUpdateCount : 1
      +0×02c KernelCallbackTable : 0×7d9419f0
      +0×030 SystemReserved   : [1] 0
      +0×034 SpareUlong       : 0
      +0×038 FreeList         : (null)
      +0×03c TlsExpansionCounter : 0
      +0×040 TlsBitmap        : 0×7d6a2058
      +0×044 TlsBitmapBits    : [2] 0xf
      +0×04c ReadOnlySharedMemoryBase : 0×7efe0000
      +0×050 ReadOnlySharedMemoryHeap : 0×7efe0000
      +0×054 ReadOnlyStaticServerData : 0×7efe0cd0  -> (null)
      +0×058 AnsiCodePageData : 0×7efb0000
      +0×05c OemCodePageData  : 0×7efc1000
      +0×060 UnicodeCaseTableData : 0×7efd2000
      +0×064 NumberOfProcessors : 8
      +0×068 NtGlobalFlag     : 0×70
      +0×070 CriticalSectionTimeout : _LARGE_INTEGER 0xffffe86d`079b8000
      +0×078 HeapSegmentReserve : 0×100000
      +0×07c HeapSegmentCommit : 0×2000
      +0×080 HeapDeCommitTotalFreeThreshold : 0×10000
      +0×084 HeapDeCommitFreeBlockThreshold : 0×1000
      +0×088 NumberOfHeaps    : 5
      +0×08c MaximumNumberOfHeaps : 0×10
      +0×090 ProcessHeaps     : 0×7d6a06a0  -> 0×00210000
      +0×094 GdiSharedHandleTable : (null)
      +0×098 ProcessStarterHelper : (null)
      +0×09c GdiDCAttributeList : 0
      +0×0a0 LoaderLock       : 0×7d6a0180 _RTL_CRITICAL_SECTION
      +0×0a4 OSMajorVersion   : 5
      +0×0a8 OSMinorVersion   : 2
      +0×0ac OSBuildNumber    : 0xece
      +0×0ae OSCSDVersion     : 0×200
      +0×0b0 OSPlatformId     : 2
      +0×0b4 ImageSubsystem   : 2
      +0×0b8 ImageSubsystemMajorVersion : 4
      +0×0bc ImageSubsystemMinorVersion : 0
      +0×0c0 ImageProcessAffinityMask : 0
      +0×0c4 GdiHandleBuffer  : [34] 0
      +0×14c PostProcessInitRoutine : (null)
      +0×150 TlsExpansionBitmap : 0×7d6a2050
      +0×154 TlsExpansionBitmapBits : [32] 1
      +0×1d4 SessionId        : 1
      +0×1d8 AppCompatFlags   : _ULARGE_INTEGER 0×0
      +0×1e0 AppCompatFlagsUser : _ULARGE_INTEGER 0×0
      +0×1e8 pShimData        : (null)
      +0×1ec AppCompatInfo    : (null)
      +0×1f0 CSDVersion       : _UNICODE_STRING “Service Pack 2″
      +0×1f8 ActivationContextData : (null)
      +0×1fc ProcessAssemblyStorageMap : (null)
      +0×200 SystemDefaultActivationContextData : 0×00180000 _ACTIVATION_CONTEXT_DATA
      +0×204 SystemAssemblyStorageMap : (null)
      +0×208 MinimumStackCommit : 0
      +0×20c FlsCallback      : 0×002137b0  -> (null)
      +0×210 FlsListHead      : _LIST_ENTRY [ 0×2139c8 - 0×2139c8 ]
      +0×218 FlsBitmap        : 0×7d6a2040
      +0×21c FlsBitmapBits    : [4] 0×33
      +0×22c FlsHighIndex     : 5
   +0×034 LastErrorValue   : 0
   +0×038 CountOfOwnedCriticalSections : 0
   +0×03c CsrClientThread  : (null)
   +0×040 Win32ThreadInfo  : (null)
   +0×044 User32Reserved   : [26] 0
   +0×0ac UserReserved     : [5] 0
   +0×0c0 WOW32Reserved    : 0×78b81910
   +0×0c4 CurrentLocale    : 0×409
   +0×0c8 FpSoftwareStatusRegister : 0
   +0×0cc SystemReserved1  : [54] (null)
   +0×1a4 ExceptionCode    : 0
   +0×1a8 ActivationContextStackPointer : 0×00211ea0 _ACTIVATION_CONTEXT_STACK
      +0×000 ActiveFrame      : (null)
      +0×004 FrameListCache   : _LIST_ENTRY [ 0×211ea4 - 0×211ea4 ]
      +0×00c Flags            : 0
      +0×010 NextCookieSequenceNumber : 1
      +0×014 StackId          : 0×9444f8
   +0×1ac SpareBytes1      : [40]  “”
   +0×1d4 GdiTebBatch      : _GDI_TEB_BATCH
      +0×000 Offset           : 0
      +0×004 HDC              : 0
      +0×008 Buffer           : [310] 0
   +0×6b4 RealClientId     : _CLIENT_ID
      +0×000 UniqueProcess    : 0×00000e0c
      +0×004 UniqueThread     : 0×000013dc
   +0×6bc GdiCachedProcessHandle : (null)
   +0×6c0 GdiClientPID     : 0
   +0×6c4 GdiClientTID     : 0
   +0×6c8 GdiThreadLocalInfo : (null)
   +0×6cc Win32ClientInfo  : [62] 0
   +0×7c4 glDispatchTable  : [233] (null)
   +0xb68 glReserved1      : [29] 0
   +0xbdc glReserved2      : (null)
   +0xbe0 glSectionInfo    : (null)
   +0xbe4 glSection        : (null)
   +0xbe8 glTable          : (null)
   +0xbec glCurrentRC      : (null)
   +0xbf0 glContext        : (null)
   +0xbf4 LastStatusValue  : 0xc0000135
   +0xbf8 StaticUnicodeString : _UNICODE_STRING “mscoree.dll”
      +0×000 Length           : 0×16
      +0×002 MaximumLength    : 0×20a
      +0×004 Buffer           : 0×7efddc00  “mscoree.dll”
   +0xc00 StaticUnicodeBuffer : [261] 0×6d
   +0xe0c DeallocationStack : 0×00030000
   +0xe10 TlsSlots         : [64] (null)
   +0xf10 TlsLinks         : _LIST_ENTRY [ 0×0 - 0×0 ]
      +0×000 Flink            : (null)
      +0×004 Blink            : (null)
   +0xf18 Vdm              : (null)
   +0xf1c ReservedForNtRpc : (null)
   +0xf20 DbgSsReserved    : [2] (null)
   +0xf28 HardErrorMode    : 0
   +0xf2c Instrumentation  : [14] (null)
   +0xf64 SubProcessTag    : (null)
   +0xf68 EtwTraceData     : (null)
   +0xf6c WinSockData      : (null)
   +0xf70 GdiBatchCount    : 0×7efdb000
   +0xf74 InDbgPrint       : 0 ”
   +0xf75 FreeStackOnTermination : 0 ”
   +0xf76 HasFiberData     : 0 ”
   +0xf77 IdealProcessor   : 0×3 ”
   +0xf78 GuaranteedStackBytes : 0
   +0xf7c ReservedForPerf  : (null)
   +0xf80 ReservedForOle   : (null)
   +0xf84 WaitingOnLoaderLock : 0
   +0xf88 SparePointer1    : 0
   +0xf8c SoftPatchPtr1    : 0
   +0xf90 SoftPatchPtr2    : 0
   +0xf94 TlsExpansionSlots : (null)
   +0xf98 ImpersonationLocale : 0
   +0xf9c IsImpersonating  : 0
   +0xfa0 NlsCache         : (null)
   +0xfa4 pShimData        : (null)
   +0xfa8 HeapVirtualAffinity : 0
   +0xfac CurrentTransactionHandle : (null)
   +0xfb0 ActiveFrame      : (null)
   +0xfb4 FlsData          : 0×002139c8
   +0xfb8 SafeThunkCall    : 0 ”
   +0xfb9 BooleanSpare     : [3]  “”

Of course, if I knew in advance that StackBase and StackLimit were the second and the third double words I could have just dumped the first 3 double words at TEB address:

0:000> dd 7efdd000 l3
7efdd000  0012fec0 00130000 0011c000

- Dmitry Vostokov @ DumpAnalysis.org -
Citrixofication

July 5th, 2007

Following the invention of one of the greatest technological thinkers of our civilization, Thomas Edison, at the beginning of the 20th century, that prompted the electrification of our world, I would like to introduce and coin the word ”Citrixofication”, the electrifying power of Citrix that transforms our lives in the 21st century - instant access to any software application whenever and wherever we want. I am very proud that I work for Citrix, the company that changes the way we work at the beginning of the 21st century, like electricity transformed our lives a century ago. The moment you do remote access to your Windows application you use solutions and technology invented by Citrix. Every Windows computer in the world has the code developed by Citrix, ICA protocol code! To be honest I was thinking about “Citrification” but I found that it is already used in chemistry so I tried  ”Citrixification” but this was already used in one French document. The only word left was “Citrixofication” or just “Citrixfication”, whatever you prefer.

- Dmitry Vostokov @ DumpAnalysis.org -
Crash Dump Analysis Patterns (Part 9b)

July 3rd, 2007

This is a follow up to the previous Deadlock pattern post. In this part I’m going to show an example of ERESOURCE deadlock in the Windows kernel.

ERESOURCE (executive resource) is a Windows synchronization object that has ownership semantics. 

An executive resource can be owned exclusively or can have a shared ownership. This is similar to the following file sharing analogy: when a file is opened for writing others can’t write or read it; if you have that file opened for reading others can read from it but can’t write to it.

ERESOURCE structure is linked into a list and have threads as owners which allows us to quickly find deadlocks using !locks command in kernel and complete memory dumps. Here is the definition of _ERESOURCE from x86 and x64 Windows:

0: kd> dt -r1 _ERESOURCE
   +0x000 SystemResourcesList : _LIST_ENTRY
      +0x000 Flink            : Ptr32 _LIST_ENTRY
      +0x004 Blink            : Ptr32 _LIST_ENTRY
   +0x008 OwnerTable       : Ptr32 _OWNER_ENTRY
      +0x000 OwnerThread      : Uint4B
      +0x004 OwnerCount       : Int4B
      +0x004 TableSize        : Uint4B
   +0x00c ActiveCount      : Int2B
   +0x00e Flag             : Uint2B
   +0x010 SharedWaiters    : Ptr32 _KSEMAPHORE
      +0x000 Header           : _DISPATCHER_HEADER
      +0x010 Limit            : Int4B
   +0x014 ExclusiveWaiters : Ptr32 _KEVENT
      +0x000 Header           : _DISPATCHER_HEADER
   +0x018 OwnerThreads     : [2] _OWNER_ENTRY
      +0x000 OwnerThread      : Uint4B
      +0x004 OwnerCount       : Int4B
      +0x004 TableSize        : Uint4B
   +0x028 ContentionCount  : Uint4B
   +0x02c NumberOfSharedWaiters : Uint2B
   +0x02e NumberOfExclusiveWaiters : Uint2B
   +0x030 Address          : Ptr32 Void
   +0x030 CreatorBackTraceIndex : Uint4B
   +0x034 SpinLock         : Uint4B

0: kd> dt -r1  _ERESOURCE
nt!_ERESOURCE
   +0x000 SystemResourcesList : _LIST_ENTRY
      +0x000 Flink            : Ptr64 _LIST_ENTRY
      +0x008 Blink            : Ptr64 _LIST_ENTRY
   +0x010 OwnerTable       : Ptr64 _OWNER_ENTRY
      +0x000 OwnerThread      : Uint8B
      +0x008 OwnerCount       : Int4B
      +0x008 TableSize        : Uint4B
   +0x018 ActiveCount      : Int2B
   +0x01a Flag             : Uint2B
   +0x020 SharedWaiters    : Ptr64 _KSEMAPHORE
      +0x000 Header           : _DISPATCHER_HEADER
      +0x018 Limit            : Int4B
   +0x028 ExclusiveWaiters : Ptr64 _KEVENT
      +0x000 Header           : _DISPATCHER_HEADER
   +0x030 OwnerThreads     : [2] _OWNER_ENTRY
      +0x000 OwnerThread      : Uint8B
      +0x008 OwnerCount       : Int4B
      +0x008 TableSize        : Uint4B
   +0x050 ContentionCount  : Uint4B
   +0x054 NumberOfSharedWaiters : Uint2B
   +0x056 NumberOfExclusiveWaiters : Uint2B
   +0x058 Address          : Ptr64 Void
   +0x058 CreatorBackTraceIndex : Uint8B
   +0x060 SpinLock         : Uint8B

If we have a list of resources from !locks output we can start following threads that own these resources. Owner threads are marked with a star character (*):

0: kd> !locks
**** DUMP OF ALL RESOURCE OBJECTS ****
KD: Scanning for held locks......

Resource @ 0x8815b928    Exclusively owned
    Contention Count = 6234751
    NumberOfExclusiveWaiters = 53
     Threads: 89ab8db0-01<*>
     Threads Waiting On Exclusive Access:
        8810fa08       880f5b40       88831020       87e33020
        880353f0       88115020       88131678       880f5db0
        89295420       88255378       880f8b40       8940d020
        880f58d0       893ee500       880edac8       880f8db0
        89172938       879b3020       88091510       88038020
        880407b8       88051020       89511db0       8921f020
        880e9db0       87c33020       88064cc0       88044730
        8803f020       87a2a020       89529380       8802d330
        89a53020       89231b28       880285b8       88106b90
        8803cbc8       88aa3020       88093400       8809aab0
        880ea540       87d46948       88036020       8806e198
        8802d020       88038b40       8826b020       88231020
        890a2020       8807f5d0
     

We see that 53 threads are waiting for _KTHREAD 89ab8db0 to release _ERESOURCE 8815b928. Searching for this thread address reveals the following: 

Resource @ 0x88159560    Exclusively owned
    Contention Count = 166896
    NumberOfExclusiveWaiters = 1
     Threads: 8802a790-01<*>
     Threads Waiting On Exclusive Access:
              89ab8db0
  

We see that thread 89ab8db0 is waiting for 8802a790 to release resource 88159560. We continue searching for thread 8802a790 waiting for another thread but we skip occurences when this thread is not waiting:

Resource @ 0x881f7b60    Exclusively owned
     Threads: 8802a790-01<*>

Resource @ 0x8824b418    Exclusively owned
    Contention Count = 34
     Threads: 8802a790-01<*>
 

Resource @ 0x8825e5a0    Exclusively owned
     Threads: 8802a790-01<*>

Resource @ 0x88172428    Exclusively owned
    Contention Count = 5
    NumberOfExclusiveWaiters = 1
     Threads: 8802a790-01<*>
     Threads Waiting On Exclusive Access:
              880f5020

Searching further we see that thread 8802a790 is waiting for thread 880f5020 to release resource 89bd7bf0:

Resource @ 0x89bd7bf0    Exclusively owned
    Contention Count = 1
    NumberOfExclusiveWaiters = 1
     Threads: 880f5020-01<*>
     Threads Waiting On Exclusive Access:
              8802a790

If we look carefully we would see that we have already seen thread 880f5020 above and I repeat the fragment (with appropriate colors now):

Resource @ 0x88172428    Exclusively owned
    Contention Count = 5
    NumberOfExclusiveWaiters = 1
     Threads: 8802a790-01<*>
     Threads Waiting On Exclusive Access:
              880f5020

We see that thread 880f5020 is waiting for thread 8802a790 and thread 8802a790 is waiting for thread 880f5020.

Therefore we have identified the classical deadlock. What we have to do now is to look at stack traces of these threads to see involved components.

- Dmitry Vostokov @ DumpAnalysis.org -
PDBFinder (public version 3.5)

July 1st, 2007

Version 3.5 uses the new binary database format and achieves the following results compare to the previous version 3.0.1:

  • 2 times smaller database size
  • 5 times faster database load time on startup!

It is fully backwards compatible with 3.0.1 and 2.x database formats and silently converts your old database to the new format on the first load.

Additionally the new version fixes the bug in version 3.0.1 sometimes manifested when removing and then adding folders before building the new database which resulted in incorrectly built database. 

The next version 4.0 is currently under development and it will have the following features:

  • The ability to open multiple databases
  • The ability to exclude certain folders during build to avoid excessive search results output
  • Fully configurable OS and language search options (which are currently disabled for public version)

PDBFinder upgrade is available for download from Citrix support.

If you still use version 2.x there is some additional information about features in version 3.5:

http://www.dumpanalysis.org/blog/index.php/2007/05/04/pdbfinder-public-version-301/

- Dmitry Vostokov @ DumpAnalysis.org -
GDB for WinDbg Users (Part 5)

July 1st, 2007

Displaying thread stack trace is the most used action in crash or core dump analysis and debugging. To show various available GDB commands I created the next version of the test program with the following source code:

#include <stdio.h>

void func_1(int param_1, char param_2, int *param_3, char *param_4);
void func_2(int param_1, char param_2, int *param_3, char *param_4);
void func_3(int param_1, char param_2, int *param_3, char *param_4);
void func_4();

int val_1;
char val_2;
int *pval_1 = &val_1;
char *pval_2 = &val_2;

int main()
{
  val_1 = 1;
  val_2 = '1';
  func_1(val_1, val_2, (int *)pval_1, (char *)pval_2);
  return 0;
}

void func_1(int param_1, char param_2, int *param_3, char *param_4)
{
  val_1 = 2;
  val_2 = '2';
  func_2(param_1, param_2, param_3, param_4);
}

void func_2(int param_1, char param_2, int *param_3, char *param_4)
{
  val_1 = 3;
  val_2 = '3';
  func_3(param_1, param_2, param_3, param_4);
}

void func_3(int param_1, char param_2, int *param_3, char *param_4)
{
  *pval_1 += param_1;
  *pval_2 += param_2;
  func_4();
}

void func_4()
{
  puts("Hello World!");
}

I compiled it with -g gcc compiler option to generate symbolic information. It will be needed for GDB to display function arguments and local variables.

C:\MinGW\examples>..\bin\gcc -g -o test.exe test.c

If you have a crash in func_4 then you can examine stack trace (backtrace) once you open a core dump. Because we don’t have a core dump of our test program we will simulate the stack trace by putting a breakpoint on func_4. In GDB this can be done by break command:

C:\MinGW\examples>..\bin\gdb test.exe
...
...
...
(gdb) break func_4
Breakpoint 1 at 0x40141d
(gdb) run
Starting program: C:\MinGW\examples/test.exe
Breakpoint 1, 0x0040141d in func_4 ()
(gdb)

In WinDbg the breakpoint command is bp:

CommandLine: C:\dmitri\test\release\test.exe
Symbol search path is: SRV*c:\websymbols*http://msdl.microsoft.com/download/symbols
Executable search path is:
ModLoad: 00400000 0040f000   test.exe
ModLoad: 7d4c0000 7d5f0000   NOT_AN_IMAGE
ModLoad: 7d600000 7d6f0000   C:\W2K3\SysWOW64\ntdll32.dll
ModLoad: 7d4c0000 7d5f0000   C:\W2K3\syswow64\kernel32.dll
(103c.17d8): Break instruction exception - code 80000003 (first chance)
eax=7d600000 ebx=7efde000 ecx=00000005 edx=00000020 esi=7d6a01f4 edi=00221f38
eip=7d61002d esp=0012fb4c ebp=0012fcac iopl=0 nv up ei pl nz na po nc
cs=0023 ss=002b ds=002b es=002b fs=0053 gs=002b efl=00000202
ntdll32!DbgBreakPoint:
7d61002d cc              int     3

0:000> bp func_4

0:000> g
ModLoad: 71c20000 71c32000   C:\W2K3\SysWOW64\tsappcmp.dll
ModLoad: 77ba0000 77bfa000   C:\W2K3\syswow64\msvcrt.dll
ModLoad: 77f50000 77fec000   C:\W2K3\syswow64\ADVAPI32.dll
ModLoad: 7da20000 7db00000   C:\W2K3\syswow64\RPCRT4.dll
Breakpoint 0 hit
eax=0040c9d0 ebx=7d4d8dc9 ecx=0040c9d0 edx=00000064 esi=00000002 edi=00000ece
eip=00408be0 esp=0012ff24 ebp=0012ff28 iopl=0 nv up ei pl nz na po nc
cs=0023 ss=002b ds=002b es=002b fs=0053 gs=002b efl=00000202
test!func_4:
00408be0 55              push    ebp

I had to disable optimization in the project properties otherwise Visual C++ compiler optimizes away all function calls and produces the following short code:

0:000> uf main
00401000 push    offset test!`string' (004020f4)
00401005 mov     dword ptr [test!val_1 (0040337c)],4
0040100f mov     byte ptr [test!val_2 (00403378)],64h
00401016 call    dword ptr [test!_imp__puts (004020a0)]
0040101c add     esp,4
0040101f xor     eax,eax
00401021 ret

I will talk about setting breakpoints in another part and here I’m going to concentrate only on commands that examine call stack. backtrace or bt command shows stack trace. backtrace <N> or bt <N> shows only the innermost N stack frames. backtrace -<N> or bt -<N> shows only the outermost N stack frames. backtrace full or bt full additionally shows local variables. There are also variants backtrace full <N> or bt full <N> and backtrace full -<N> or bt full -<N>:

(gdb) backtrace
#0  func_4 () at test.c:48
#1  0x00401414 in func_3 (param_1=1, param_2=49 '1', param_3=0x404080,
    param_4=0x404070 "d") at test.c:43
#2  0x004013da in func_2 (param_1=1, param_2=49 '1', param_3=0x404080,
    param_4=0x404070 "d") at test.c:35
#3  0x0040139a in func_1 (param_1=1, param_2=49 '1', param_3=0x404080,
    param_4=0x404070 "d") at test.c:27
#4  0x00401355 in main () at test.c:18

(gdb) bt
#0  func_4 () at test.c:48
#1  0x00401414 in func_3 (param_1=1, param_2=49 '1', param_3=0x404080,
    param_4=0x404070 "d") at test.c:43
#2  0x004013da in func_2 (param_1=1, param_2=49 '1', param_3=0x404080,
    param_4=0x404070 "d") at test.c:35
#3  0x0040139a in func_1 (param_1=1, param_2=49 '1', param_3=0x404080,
    param_4=0x404070 "d") at test.c:27
#4  0x00401355 in main () at test.c:18

(gdb) bt 2
#0  func_4 () at test.c:48
#1  0x00401414 in func_3 (param_1=1, param_2=49 '1', param_3=0x404080,
    param_4=0x404070 "d") at test.c:43
(More stack frames follow...)

(gdb) bt -2
#3  0x0040139a in func_1 (param_1=1, param_2=49 '1', param_3=0x404080,
    param_4=0x404070 "d") at test.c:27
#4  0x00401355 in main () at test.c:18

(gdb) bt full
#0  func_4 () at test.c:48
No locals.
#1  0x00401414 in func_3 (param_1=1, param_2=49 '1', param_3=0x404080,
    param_4=0x404070 "d") at test.c:43
        param_2 = 49 '1'
#2  0x004013da in func_2 (param_1=1, param_2=49 '1', param_3=0x404080,
    param_4=0x404070 "d") at test.c:35
        param_2 = 49 '1'
#3  0x0040139a in func_1 (param_1=1, param_2=49 '1', param_3=0x404080,
    param_4=0x404070 "d") at test.c:27
        param_2 = 49 '1'
#4  0x00401355 in main () at test.c:18
No locals.

(gdb) bt full 2
#0  func_4 () at test.c:48
No locals.
#1  0x00401414 in func_3 (param_1=1, param_2=49 '1', param_3=0x404080,
    param_4=0x404070 "d") at test.c:43
        param_2 = 49 '1'
(More stack frames follow...)

(gdb) bt full -2
#3  0x0040139a in func_1 (param_1=1, param_2=49 '1', param_3=0x404080,
    param_4=0x404070 "d") at test.c:27
        param_2 = 49 '1'
#4  0x00401355 in main () at test.c:18
No locals.

(gdb)

In WinDbg there is only one k command but it has many parameters, for example:

- default stack trace with source code lines

0:000> k
ChildEBP RetAddr
0012ff20 00408c30 test!func_4 [c:\dmitri\test\test\test.cpp @ 47]
0012ff28 00408c69 test!func_3+0x30 [c:\dmitri\test\test\test.cpp @ 44]
0012ff40 00408c99 test!func_2+0x29 [c:\dmitri\test\test\test.cpp @ 35]
0012ff58 00408cd3 test!func_1+0x29 [c:\dmitri\test\test\test.cpp @ 27]
0012ff70 00401368 test!main+0x33 [c:\dmitri\test\test\test.cpp @ 18]
0012ffc0 7d4e992a test!__tmainCRTStartup+0x15f [f:\sp\vctools\crt_bld\self_x86\crt\src\crt0.c @ 327]
0012fff0 00000000 kernel32!BaseProcessStart+0x28

- stack trace without source code lines

0:000> kL
ChildEBP RetAddr
0012ff20 00408c30 test!func_4
0012ff28 00408c69 test!func_3+0x30
0012ff40 00408c99 test!func_2+0x29
0012ff58 00408cd3 test!func_1+0x29
0012ff70 00401368 test!main+0x33
0012ffc0 7d4e992a test!__tmainCRTStartup+0x15f
0012fff0 00000000 kernel32!BaseProcessStart+0x28

- full stack trace without source code lines showing 3 stack arguments for every stack frame, calling convention and optimization information

0:000> kvL
ChildEBP RetAddr  Args to Child
0012ff20 00408c30 0012ff40 00408c69 00000001 test!func_4 (CONV: cdecl)
0012ff28 00408c69 00000001 00000031 0040c9d4 test!func_3+0x30 (CONV: cdecl)
0012ff40 00408c99 00000001 00000031 0040c9d4 test!func_2+0x29 (CONV: cdecl)
0012ff58 00408cd3 00000001 00000031 0040c9d4 test!func_1+0x29 (CONV: cdecl)
0012ff70 00401368 00000001 004230e0 00423120 test!main+0x33 (CONV: cdecl)
0012ffc0 7d4e992a 00000000 00000000 7efde000 test!__tmainCRTStartup+0x15f (FPO: [Non-Fpo]) (CONV: cdecl)
0012fff0 00000000 004013bf 00000000 00000000 kernel32!BaseProcessStart+0x28 (FPO: [Non-Fpo])

- stack trace without source code lines showing all function parameters

0:000> kPL
ChildEBP RetAddr
0012ff20 00408c30 test!func_4(void)
0012ff28 00408c69 test!func_3(
   int param_1 = 1,
   char param_2 = 49 '1',
   int * param_3 = 0x0040c9d4,
   char * param_4 = 0x0040c9d0 "d")+0x30
0012ff40 00408c99 test!func_2(
   int param_1 = 1,
   char param_2 = 49 '1',
   int * param_3 = 0x0040c9d4,
   char * param_4 = 0x0040c9d0 "d")+0x29
0012ff58 00408cd3 test!func_1(
   int param_1 = 1,
   char param_2 = 49 '1',
   int * param_3 = 0x0040c9d4,
   char * param_4 = 0x0040c9d0 "d")+0x29
0012ff70 00401368 test!main(void)+0x33
0012ffc0 7d4e992a test!__tmainCRTStartup(void)+0x15f
0012fff0 00000000 kernel32!BaseProcessStart+0x28

- stack trace without source code lines showing stack frame numbers

0:000> knL
 # ChildEBP RetAddr
00 0012ff20 00408c30 test!func_4
01 0012ff28 00408c69 test!func_3+0x30
02 0012ff40 00408c99 test!func_2+0x29
03 0012ff58 00408cd3 test!func_1+0x29
04 0012ff70 00401368 test!main+0x33
05 0012ffc0 7d4e992a test!__tmainCRTStartup+0x15f
06 0012fff0 00000000 kernel32!BaseProcessStart+0x28

- stack trace without source code lines showing the distance between stack frames in bytes

0:000> knfL
 #   Memory  ChildEBP RetAddr
00           0012ff20 00408c30 test!func_4
01         8 0012ff28 00408c69 test!func_3+0x30
02        18 0012ff40 00408c99 test!func_2+0x29
03        18 0012ff58 00408cd3 test!func_1+0x29
04        18 0012ff70 00401368 test!main+0x33
05        50 0012ffc0 7d4e992a test!__tmainCRTStartup+0x15f
06        30 0012fff0 00000000 kernel32!BaseProcessStart+0x28

- stack trace without source code lines showing the innermost 2 frames:

0:000> kL 2
ChildEBP RetAddr
0012ff20 00408c30 test!func_4
0012ff28 00408c69 test!func_3+0x30

If you want to see stack traces from all threads in a process use the following command: 

(gdb) thread apply all bt

Thread 1 (thread 728.0xc0c):
#0  func_4 () at test.c:48
#1  0x00401414 in func_3 (param_1=1, param_2=49 '1', param_3=0x404080,
    param_4=0x404070 "d") at test.c:43
#2  0x004013da in func_2 (param_1=1, param_2=49 '1', param_3=0x404080,
    param_4=0x404070 "d") at test.c:35
#3  0x0040139a in func_1 (param_1=1, param_2=49 '1', param_3=0x404080,
    param_4=0x404070 "d") at test.c:27
#4  0x00401355 in main () at test.c:18
(gdb)

In WinDbg it is ~*k. Any parameter shown above can be used, for example:

0:000> ~*kL

.  0  Id: 103c.17d8 Suspend: 1 Teb: 7efdd000 Unfrozen
ChildEBP RetAddr
0012ff20 00408c30 test!func_4
0012ff28 00408c69 test!func_3+0x30
0012ff40 00408c99 test!func_2+0x29
0012ff58 00408cd3 test!func_1+0x29
0012ff70 00401368 test!main+0x33
0012ffc0 7d4e992a test!__tmainCRTStartup+0x15f
0012fff0 00000000 kernel32!BaseProcessStart+0x28

Therefore, our next version of the map contains these new commands:

Action                      | GDB                 | WinDbg
----------------------------------------------------------
Start the process           | run                 | g
Exit                        | (q)uit              | q
Disassemble (forward)       | (disas)semble       | uf, u
Disassemble N instructions  | x/<N>i              | -
Disassemble (backward)      | -                   | ub
Stack trace                 | backtrace (bt)      | k
Full stack trace            | bt full             | kv
Partial trace (innermost)   | bt <N>              | k <N>
Partial trace (outermost)   | bt -<N>             | -
Stack trace for all threads | thread apply all bt | ~*k
Breakpoint                  | break               | bp

- Dmitry Vostokov @ DumpAnalysis.org -

GDB for WinDbg Users (Part 4)

July 1st, 2007

If you are looking for debugging tutorials with a wider scope than just listing various debugger commands then the following books will be useful:

Both use GDB for debugging case studies and will be useful for engineers with any level of debugging experience.

- Dmitry Vostokov @ DumpAnalysis.org -

Correcting Microsoft article about userdump.exe

June 28th, 2007

There is much confusion among Microsoft and Citrix customers on how to use userdump.exe to save a process dump. Microsoft published an article about userdump.exe and it has the following title:

How to use the Userdump.exe tool to create a dump file

Unfortunately all scenarios listed there start with:

1. Run the Setup.exe program for your processor.

It also says:

<…> move to the version of Userdump.exe for your processor at the command prompt 

I would like to correct the article here. You don’t need to run setup.exe, you just need to copy userdump.exe and dbghelp.dll. The latter is important because the version of that DLL in your system32 folder can be older and userdump.exe will not start:

C:\kktools\userdump8.1\x64>userdump.exe

!!!!!!!!!! Error !!!!!!!!!!
Unsupported DbgHelp.dll version.
Path   : C:\W2K3\system32\DbgHelp.dll
Version: 5.2.3790.1830

C:\kktools\userdump8.1\x64>

For most customers running setup.exe and configuring the default rules in Exception Monitor creates the significant amount of false positive dumps. If we want to manually dump a process we don’t need automatically generated dumps or fine tune Exception Monitor rules to reduce the number of dumps.

Just an additional note: if you have an error dialog box showing that a program got an exception you can find that process in Task Manager and use userdump.exe to save that process dump manually. Then inside the dump it is possible to see that error. Therefore in the case when a default postmortem debugger wasn’t configured in the registry you can still get a dump for postmortem crash dump analysis. Here is an example. I removed a postmortem debugger from

HKEY_LOCAL_MACHINE\SOFTWARE\Microsoft\Windows NT\CurrentVersion\AeDebug
Debugger=

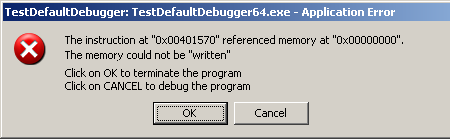
Now if we run TestDefaultDebugger tool and hit the big crash button we get the following message box:


If we save TestDefaultDebugger process dump manually using userdump.exe when this message box is shown

C:\kktools\userdump8.1\x64>userdump.exe 5264 c:\tdd.dmp
User Mode Process Dumper (Version 8.1.2929.4)
Copyright (c) Microsoft Corp. All rights reserved.
Dumping process 5264 (TestDefaultDebugger64.exe) to
c:\tdd.dmp...
The process was dumped successfully.

and open it in WinDbg we can see the problem thread there:

0:000> kn
#  Child-SP          RetAddr           Call Site
00 00000000`0012dab8 00000000`77dbfb3b ntdll!ZwRaiseHardError+0xa
01 00000000`0012dac0 00000000`004148c6 kernel32!UnhandledExceptionFilter+0x6c8
02 00000000`0012e2f0 00000000`004165f6 TestDefaultDebugger64!__tmainCRTStartup$filt$0+0x16
03 00000000`0012e320 00000000`78ee4bdd TestDefaultDebugger64!__C_specific_handler+0xa6
04 00000000`0012e3b0 00000000`78ee685a ntdll!RtlpExecuteHandlerForException+0xd
05 00000000`0012e3e0 00000000`78ef3a5d ntdll!RtlDispatchException+0x1b4
06 00000000`0012ea90 00000000`00401570 ntdll!KiUserExceptionDispatch+0x2d
07 00000000`0012f028 00000000`00403d4d TestDefaultDebugger64!CTestDefaultDebuggerDlg::OnBnClickedButton1
08 00000000`0012f030 00000000`00403f75 TestDefaultDebugger64!_AfxDispatchCmdMsg+0xc1
09 00000000`0012f070 00000000`004030cc TestDefaultDebugger64!CCmdTarget::OnCmdMsg+0x169
0a 00000000`0012f0f0 00000000`0040c18d TestDefaultDebugger64!CDialog::OnCmdMsg+0x28
0b 00000000`0012f150 00000000`0040cfbd TestDefaultDebugger64!CWnd::OnCommand+0xc9
0c 00000000`0012f200 00000000`0040818f TestDefaultDebugger64!CWnd::OnWndMsg+0x55
0d 00000000`0012f360 00000000`0040b2e5 TestDefaultDebugger64!CWnd::WindowProc+0x33
0e 00000000`0012f3c0 00000000`0040b3d2 TestDefaultDebugger64!AfxCallWndProc+0xf1
0f 00000000`0012f480 00000000`77c439fc TestDefaultDebugger64!AfxWndProc+0x4e
10 00000000`0012f4e0 00000000`77c432ba user32!UserCallWinProcCheckWow+0x1f9
11 00000000`0012f5b0 00000000`77c4335b user32!SendMessageWorker+0x68c
12 00000000`0012f650 000007ff`7f07c5af user32!SendMessageW+0x9d
13 00000000`0012f6a0 000007ff`7f07eb8e comctl32!Button_ReleaseCapture+0x14f

The second parameter to RtlDispatchException is the pointer to the exception context so if we dump the stack trace verbosely we can get that pointer and pass it to .cxr command:

0:000> kv
Child-SP          RetAddr           : Args to Child
...
...
...
00000000`0012e3e0 00000000`78ef3a5d : 00000000`0040c9ec 00000000`0012ea90 00000000`00000001 00000000`00000111 : ntdll!RtlDispatchException+0×1b4


0:000> .cxr 00000000`0012ea90
rax=0000000000000000 rbx=0000000000000001 rcx=000000000012fd70
rdx=00000000000003e8 rsi=000000000012fd70 rdi=0000000000432e90
rip=0000000000401570 rsp=000000000012f028 rbp=0000000000000111
 r8=0000000000000000  r9=0000000000401570 r10=0000000000401570
r11=000000000015abb0 r12=0000000000000000 r13=00000000000003e8
r14=0000000000000110 r15=0000000000000001
iopl=0 nv up ei pl zr na po nc
cs=0033 ss=002b ds=002b es=002b fs=0053 gs=002b efl=00010246
TestDefaultDebugger64!CTestDefaultDebuggerDlg::OnBnClickedButton1:
00000000`00401570 c704250000000000000000 mov dword ptr [0],0 ds:00000000`00000000=????????

We see that it was NULL pointer dereference that caused the process termination. Now we can dump the full stack trace that led to our crash:

0:000> kn 100
#  Child-SP          RetAddr           Call Site
00 00000000`0012f028 00000000`00403d4d TestDefaultDebugger64!CTestDefaultDebuggerDlg::OnBnClickedButton1
01 00000000`0012f030 00000000`00403f75 TestDefaultDebugger64!_AfxDispatchCmdMsg+0xc1
02 00000000`0012f070 00000000`004030cc TestDefaultDebugger64!CCmdTarget::OnCmdMsg+0x169
03 00000000`0012f0f0 00000000`0040c18d TestDefaultDebugger64!CDialog::OnCmdMsg+0x28
04 00000000`0012f150 00000000`0040cfbd TestDefaultDebugger64!CWnd::OnCommand+0xc9
05 00000000`0012f200 00000000`0040818f TestDefaultDebugger64!CWnd::OnWndMsg+0x55
06 00000000`0012f360 00000000`0040b2e5 TestDefaultDebugger64!CWnd::WindowProc+0x33
07 00000000`0012f3c0 00000000`0040b3d2 TestDefaultDebugger64!AfxCallWndProc+0xf1
08 00000000`0012f480 00000000`77c439fc TestDefaultDebugger64!AfxWndProc+0x4e
09 00000000`0012f4e0 00000000`77c432ba user32!UserCallWinProcCheckWow+0x1f9
0a 00000000`0012f5b0 00000000`77c4335b user32!SendMessageWorker+0x68c
0b 00000000`0012f650 000007ff`7f07c5af user32!SendMessageW+0x9d
0c 00000000`0012f6a0 000007ff`7f07eb8e comctl32!Button_ReleaseCapture+0x14f
0d 00000000`0012f6d0 00000000`77c439fc comctl32!Button_WndProc+0x8ee
0e 00000000`0012f830 00000000`77c43e9c user32!UserCallWinProcCheckWow+0x1f9
0f 00000000`0012f900 00000000`77c3965a user32!DispatchMessageWorker+0x3af
10 00000000`0012f970 00000000`0040706d user32!IsDialogMessageW+0x256
11 00000000`0012fa40 00000000`0040868c TestDefaultDebugger64!CWnd::IsDialogMessageW+0x35
12 00000000`0012fa80 00000000`0040309c TestDefaultDebugger64!CWnd::PreTranslateInput+0x28
13 00000000`0012fab0 00000000`0040ae73 TestDefaultDebugger64!CDialog::PreTranslateMessage+0xc0
14 00000000`0012faf0 00000000`004047fc TestDefaultDebugger64!CWnd::WalkPreTranslateTree+0x33
15 00000000`0012fb30 00000000`00404857 TestDefaultDebugger64!AfxInternalPreTranslateMessage+0x64233]
16 00000000`0012fb70 00000000`00404a17 TestDefaultDebugger64!AfxPreTranslateMessage+0x23
17 00000000`0012fba0 00000000`00404a57 TestDefaultDebugger64!AfxInternalPumpMessage+0x37
18 00000000`0012fbe0 00000000`0040a419 TestDefaultDebugger64!AfxPumpMessage+0x1b
19 00000000`0012fc10 00000000`00403a3a TestDefaultDebugger64!CWnd::RunModalLoop+0xe5
1a 00000000`0012fc90 00000000`00401139 TestDefaultDebugger64!CDialog::DoModal+0x1ce
1b 00000000`0012fd40 00000000`0042bbbd TestDefaultDebugger64!CTestDefaultDebuggerApp::InitInstance+0xe9
1c 00000000`0012fe70 00000000`00414848 TestDefaultDebugger64!AfxWinMain+0x69
1d 00000000`0012fed0 00000000`77d5966c TestDefaultDebugger64!__tmainCRTStartup+0x258
1e 00000000`0012ff80 00000000`00000000 kernel32!BaseProcessStart+0x29

The same technique can be used to dump a process when any kind of error message box appears, for example, when a .NET application displays a .NET exception message box or a native application shows a run-time error dialog box. 

- Dmitry Vostokov @ DumpAnalysis.org -

GDB for WinDbg Users (Part 3)

June 28th, 2007

One of the common tasks in crash dump analysis is to disassemble various functions. In GDB it can be done by using two different commands: disassemble and x/i.

The first command gets a function name, an address or a range of addresses and can be shortened to just disas:

(gdb) set disassembly-flavor intel
(gdb) disas main
Dump of assembler code for function main:
0x4012f0 <main>:        push   ebp
0x4012f1 <main+1>:      mov    ebp,esp
0x4012f3 <main+3>:      sub    esp,0x8
0x4012f6 <main+6>:      and    esp,0xfffffff0
0x4012f9 <main+9>:      mov    eax,0x0
0x4012fe <main+14>:     add    eax,0xf
0x401301 <main+17>:     add    eax,0xf
0x401304 <main+20>:     shr    eax,0x4
0x401307 <main+23>:     shl    eax,0x4
0x40130a <main+26>:     mov    DWORD PTR [ebp-4],eax
0x40130d <main+29>:     mov    eax,DWORD PTR [ebp-4]
0x401310 <main+32>:     call   0x401860 <_alloca>
0x401315 <main+37>:     call   0x401500 <__main>
0x40131a <main+42>:     mov    DWORD PTR [esp],0x403000
0x401321 <main+49>:     call   0x401950 <puts>
0x401326 <main+54>:     mov    eax,0x0
0x40132b <main+59>:     leave
0x40132c <main+60>:     ret
0x40132d <main+61>:     nop
0x40132e <main+62>:     nop
0x40132f <main+63>:     nop
End of assembler dump.
(gdb) disas 0x4012f0
Dump of assembler code for function main:
0x4012f0 <main>:        push   ebp
0x4012f1 <main+1>:      mov    ebp,esp
0x4012f3 <main+3>:      sub    esp,0x8
0x4012f6 <main+6>:      and    esp,0xfffffff0
0x4012f9 <main+9>:      mov    eax,0x0
0x4012fe <main+14>:     add    eax,0xf
0x401301 <main+17>:     add    eax,0xf
0x401304 <main+20>:     shr    eax,0x4
0x401307 <main+23>:     shl    eax,0x4
0x40130a <main+26>:     mov    DWORD PTR [ebp-4],eax
0x40130d <main+29>:     mov    eax,DWORD PTR [ebp-4]
0x401310 <main+32>:     call   0x401860 <_alloca>
0x401315 <main+37>:     call   0x401500 <__main>
0x40131a <main+42>:     mov    DWORD PTR [esp],0x403000
0x401321 <main+49>:     call   0x401950 <puts>
0x401326 <main+54>:     mov    eax,0x0
0x40132b <main+59>:     leave
0x40132c <main+60>:     ret
0x40132d <main+61>:     nop
0x40132e <main+62>:     nop
0x40132f <main+63>:     nop
End of assembler dump.
(gdb) disas 0x4012f0 0x40132d
Dump of assembler code from 0x4012f0 to 0x40132d:
0x4012f0 <main>:        push   ebp
0x4012f1 <main+1>:      mov    ebp,esp
0x4012f3 <main+3>:      sub    esp,0x8
0x4012f6 <main+6>:      and    esp,0xfffffff0
0x4012f9 <main+9>:      mov    eax,0x0
0x4012fe <main+14>:     add    eax,0xf
0x401301 <main+17>:     add    eax,0xf
0x401304 <main+20>:     shr    eax,0x4
0x401307 <main+23>:     shl    eax,0x4
0x40130a <main+26>:     mov    DWORD PTR [ebp-4],eax
0x40130d <main+29>:     mov    eax,DWORD PTR [ebp-4]
0x401310 <main+32>:     call   0x401860 <_alloca>
0x401315 <main+37>:     call   0x401500 <__main>
0x40131a <main+42>:     mov    DWORD PTR [esp],0x403000
0x401321 <main+49>:     call   0x401950 <puts>
0x401326 <main+54>:     mov    eax,0x0
0x40132b <main+59>:     leave
0x40132c <main+60>:     ret
End of assembler dump.
(gdb)

The equivalent for this command in WinDbg is uf (unassemble function) and u (unassemble):

0:000> .asm no_code_bytes
Assembly options: no_code_bytes
0:000> uf main
test!main [test.cpp @ 3]:
00401000 push    offset test!`string' (004020f4)
00401005 call    dword ptr [test!_imp__puts (004020a0)]
0040100b add     esp,4
0040100e xor     eax,eax
00401010 ret
0:000> uf 00401000
test!main [test.cpp @ 3]:
00401000 push    offset test!`string' (004020f4)
00401005 call    dword ptr [test!_imp__puts (004020a0)]
0040100b add     esp,4
0040100e xor     eax,eax
00401010 ret
0:000> u 00401000
test!main [c:\dmitri\test\test\test.cpp @ 3]:
00401000 push    offset test!`string' (004020f4)
00401005 call    dword ptr [test!_imp__puts (004020a0)]
0040100b add     esp,4
0040100e xor     eax,eax
00401010 ret
test!__security_check_cookie [f:\sp\vctools\crt_bld\self_x86\crt\src\intel\secchk.c @ 52]:
00401011 cmp     ecx,dword ptr [test!__security_cookie (00403000)]
00401017 jne     test!__security_check_cookie+0xa (0040101b)
00401019 rep ret
0:000> u 00401000 00401011
test!main [test.cpp @ 3]:
00401000 push    offset test!`string' (004020f4)
00401005 call    dword ptr [test!_imp__puts (004020a0)]
0040100b add     esp,4
0040100e xor     eax,eax
00401010 ret
0:000> u
test!__security_check_cookie [f:\sp\vctools\crt_bld\self_x86\crt\src\intel\secchk.c @ 52]:
00401011 cmp     ecx,dword ptr [test!__security_cookie (00403000)]
00401017 jne     test!__security_check_cookie+0xa (0040101b)
00401019 rep ret
0040101b jmp     test!__report_gsfailure (004012cd)
test!pre_cpp_init [f:\sp\vctools\crt_bld\self_x86\crt\src\crtexe.c @ 321]:
00401020 push    offset test!_RTC_Terminate (004014fd)
00401025 call    test!atexit (004014c7)
0040102a mov     eax,dword ptr [test!_newmode (00403364)]
0040102f mov     dword ptr [esp],offset test!startinfo (0040302c)
0:000> u eip
ntdll32!DbgBreakPoint:
7d61002d int     3
7d61002e ret
7d61002f nop
7d610030 mov     edi,edi
ntdll32!DbgUserBreakPoint:
7d610032 int     3
7d610033 ret
7d610034 mov     edi,edi
ntdll32!DbgBreakPointWithStatus:
7d610036 mov     eax,dword ptr [esp+4]

The second GDB command is x/[N]i address where N is the number of instructions to disassemble:

(gdb) x/i 0x4012f0
0x4012f0 <main>:        push   ebp
(gdb) x/2i 0x4012f0
0x4012f0 <main>:        push   ebp
0x4012f1 <main+1>:      mov    ebp,esp
(gdb) x/3i 0x4012f0
0x4012f0 <main>:        push   ebp
0x4012f1 <main+1>:      mov    ebp,esp
0x4012f3 <main+3>:      sub    esp,0x8
(gdb) x/4i $pc
0x4012f6 <main+6>:      and    esp,0xfffffff0
0x4012f9 <main+9>:      mov    eax,0x0
0x4012fe <main+14>:     add    eax,0xf
0x401301 <main+17>:     add    eax,0xf
(gdb)

I don’t know the way to disassemble just N instructions in WinDbg. However in WinDbg I can disassemble backwards (ub). This is useful, for example, if we have a return address and we want to see the CALL instruction:

0:000> k
ChildEBP RetAddr
0012ff7c 0040117a test!main [test.cpp @ 3]
0012ffc0 7d4e992a test!__tmainCRTStartup+0×10f [f:\sp\vctools\crt_bld\self_x86\crt\src\crtexe.c @ 597]
0012fff0 00000000 kernel32!BaseProcessStart+0×28
0:000> ub 7d4e992a
kernel32!BaseProcessStart+0×10:
7d4e9912 call    kernel32!BasepReport32bitAppLaunching (7d4e9949)
7d4e9917 push    4
7d4e9919 lea     eax,[ebp+8]
7d4e991c push    eax
7d4e991d push    9
7d4e991f push    0FFFFFFFEh
7d4e9921 call    dword ptr [kernel32!_imp__NtSetInformationThread (7d4d032c)]
7d4e9927 call    dword ptr [ebp+8]

So our next version of the map contains these new commands:

Action                     | GDB           | WinDbg
---------------------------------------------------
Start the process          | run           | g
Exit                       | (q)uit        | q
Disassemble (forward)      | (disas)semble | uf, u
Disassemble N instructions | x/i           | -
Disassemble (backward)     | -             | ub

- Dmitry Vostokov @ DumpAnalysis.org -

When a process dies silently

June 28th, 2007

There are cases when default postmortem debugger doesn’t save a dump file. This is because the default postmortem debugger is called from the crashed application thread on Windows prior to Vista and if a thread stack is exhausted or critical thread data is corrupt there is no user dump.  On Vista the default postmorten debugger is called from WER (Windows Error Reporting) process WerFault.exe so there is a chance that it can save a user dump. During my experiments today on Windows 2003 (x64) I found that if we have a stack overflow inside a 64-bit process then the process silently dies. This doesn’t happen for 32-bit processes on the same server on a native 32-bit OS. Here is the added code from the modified default Win32 API project created in Visual Studio 2005:

...
volatile DWORD dwSupressOptimization;
...
void SoFunction();
...
LRESULT CALLBACK WndProc(HWND hWnd, UINT message, WPARAM wParam, LPARAM lParam)
{
...
  case WM_PAINT:
     hdc = BeginPaint(hWnd, &ps);
     SoFunction();
     EndPaint(hWnd, &ps);
     break;
...
}
...
void SoFunction()
{
  if (++dwSupressOptimization)
  {
     SoFunction();
     WndProc(0,0,0,0);
  }
}

Adding WndProc call to SoFunction is done to eliminate an optimization in Release build when a recursion call is transformed into a loop:

void SoFunction()
{
  if (++dwSupressOptimization)
  {
     SoFunction();
  }
}

0:001> uf SoFunction
00401300 mov     eax,1
00401305 jmp     StackOverflow!SoFunction+0x10 (00401310)
00401310 add     dword ptr [StackOverflow!dwSupressOptimization (00403374)],eax
00401316 mov     ecx,dword ptr [StackOverflow!dwSupressOptimization (00403374)]
0040131c jne     StackOverflow!SoFunction+0x10 (00401310)
0040131e ret

Therefore without WndProc added or more complicated SoFunction there is no stack overflow but a loop with 4294967295 (0xFFFFFFFF) iterations.

If we compile an x64 project with WndProc call included in SoFunction and run it we would never get a dump from any default postmortem debugger although TestDefaultDebugger64 tool crashes with a dump. I also observed a strange behavior that the application disappears only during the second window repaint although it shall crash immediately when we launch it and the main window is shown. What I have seen is when I launch the application it is running and the main window is visible. When I force it to repaint by minimizing and then maximizing, for example, only then it disappears from the screen and the process list.

If we launch 64-bit WinDbg, load and run our application we would hit the first chance exception:

0:000> g
(159c.fc4): Stack overflow - code c00000fd (first chance)
First chance exceptions are reported before any exception handling.
This exception may be expected and handled.
StackOverflow!SoFunction+0x22:
00000001`40001322 e8d9ffffff call StackOverflow!SoFunction (00000001`40001300)

Stack trace looks like normal stack overflow:

0:000> k
Child-SP          RetAddr           Call Site
00000000`00033fe0 00000001`40001327 StackOverflow!SoFunction+0x22
00000000`00034020 00000001`40001327 StackOverflow!SoFunction+0x27
00000000`00034060 00000001`40001327 StackOverflow!SoFunction+0x27
00000000`000340a0 00000001`40001327 StackOverflow!SoFunction+0x27
00000000`000340e0 00000001`40001327 StackOverflow!SoFunction+0x27
00000000`00034120 00000001`40001327 StackOverflow!SoFunction+0x27
00000000`00034160 00000001`40001327 StackOverflow!SoFunction+0x27
00000000`000341a0 00000001`40001327 StackOverflow!SoFunction+0x27
00000000`000341e0 00000001`40001327 StackOverflow!SoFunction+0x27
00000000`00034220 00000001`40001327 StackOverflow!SoFunction+0x27
00000000`00034260 00000001`40001327 StackOverflow!SoFunction+0x27
00000000`000342a0 00000001`40001327 StackOverflow!SoFunction+0x27
00000000`000342e0 00000001`40001327 StackOverflow!SoFunction+0x27
00000000`00034320 00000001`40001327 StackOverflow!SoFunction+0x27
00000000`00034360 00000001`40001327 StackOverflow!SoFunction+0x27
00000000`000343a0 00000001`40001327 StackOverflow!SoFunction+0x27
00000000`000343e0 00000001`40001327 StackOverflow!SoFunction+0x27
00000000`00034420 00000001`40001327 StackOverflow!SoFunction+0x27
00000000`00034460 00000001`40001327 StackOverflow!SoFunction+0x27
00000000`000344a0 00000001`40001327 StackOverflow!SoFunction+0x27

RSP was inside stack guard page during the CALL instruction.

0:000> r
rax=0000000000003eed rbx=00000000000f26fe rcx=0000000077c4080a
rdx=0000000000000000 rsi=000000000000000f rdi=0000000000000000
rip=0000000140001322 rsp=0000000000033fe0 rbp=00000001400035f0
 r8=000000000012fb18 r9=00000001400035f0 r10=0000000000000000
r11=0000000000000246 r12=000000000012fdd8 r13=000000000012fd50
r14=00000000000f26fe r15=0000000000000000
iopl=0 nv up ei pl nz na po nc
cs=0033 ss=002b ds=002b es=002b fs=0053 gs=002b efl=00010206
StackOverflow!SoFunction+0×22:
00000001`40001322 e8d9ffffff call StackOverflow!SoFunction (00000001`40001300)

0:000> uf StackOverflow!SoFunction
00000001`40001300 sub     rsp,38h
00000001`40001304 mov     rax,qword ptr [StackOverflow!__security_cookie (00000001`40003000)]
00000001`4000130b xor     rax,rsp
00000001`4000130e mov     qword ptr [rsp+20h],rax
00000001`40001313 add     dword ptr [StackOverflow!dwSupressOptimization (00000001`400035e4)],1
00000001`4000131a mov     eax,dword ptr [StackOverflow!dwSupressOptimization (00000001`400035e4)]
00000001`40001320 je      StackOverflow!SoFunction+0×37 (00000001`40001337)
00000001`40001322 call    StackOverflow!SoFunction (00000001`40001300)
00000001`40001327 xor     r9d,r9d
00000001`4000132a xor     r8d,r8d
00000001`4000132d xor     edx,edx
00000001`4000132f xor     ecx,ecx
00000001`40001331 call    qword ptr [StackOverflow!_imp_DefWindowProcW (00000001`40002198)]
00000001`40001337 mov     rcx,qword ptr [rsp+20h]
00000001`4000133c xor     rcx,rsp
00000001`4000133f call    StackOverflow!__security_check_cookie (00000001`40001360)
00000001`40001344 add     rsp,38h
00000001`40001348 ret

However this guard page is not the last stack page as can be seen from TEB and the current RSP address (0×33fe0):

0:000> !teb
TEB at 000007fffffde000
    ExceptionList:        0000000000000000
    StackBase:            0000000000130000
    StackLimit:           0000000000031000
    SubSystemTib:         0000000000000000
    FiberData:            0000000000001e00
    ArbitraryUserPointer: 0000000000000000
    Self:                 000007fffffde000
    EnvironmentPointer:   0000000000000000
    ClientId:             000000000000159c . 0000000000000fc4
    RpcHandle:            0000000000000000
    Tls Storage:          0000000000000000
    PEB Address:          000007fffffd5000
    LastErrorValue:       0
    LastStatusValue:      c0000135
    Count Owned Locks:    0
    HardErrorMode:        0

If we continue execution and force the main application window to invalidate (repaint) itself we get another first chance exception instead of second chance:

0:000> g
(159c.fc4): Access violation - code c0000005 (first chance)
First chance exceptions are reported before any exception handling.
This exception may be expected and handled.
StackOverflow!SoFunction+0x22:
00000001`40001322 call StackOverflow!SoFunction (00000001`40001300)

What we see now is that RSP is outside the valid stack region (stack limit) 0×31000:

0:000> k
Child-SP          RetAddr           Call Site
00000000`00030ff0 00000001`40001327 StackOverflow!SoFunction+0×22
00000000`00031030 00000001`40001327 StackOverflow!SoFunction+0×27
00000000`00031070 00000001`40001327 StackOverflow!SoFunction+0×27
00000000`000310b0 00000001`40001327 StackOverflow!SoFunction+0×27
00000000`000310f0 00000001`40001327 StackOverflow!SoFunction+0×27
00000000`00031130 00000001`40001327 StackOverflow!SoFunction+0×27
00000000`00031170 00000001`40001327 StackOverflow!SoFunction+0×27
00000000`000311b0 00000001`40001327 StackOverflow!SoFunction+0×27
00000000`000311f0 00000001`40001327 StackOverflow!SoFunction+0×27
00000000`00031230 00000001`40001327 StackOverflow!SoFunction+0×27
00000000`00031270 00000001`40001327 StackOverflow!SoFunction+0×27
00000000`000312b0 00000001`40001327 StackOverflow!SoFunction+0×27
00000000`000312f0 00000001`40001327 StackOverflow!SoFunction+0×27
00000000`00031330 00000001`40001327 StackOverflow!SoFunction+0×27
00000000`00031370 00000001`40001327 StackOverflow!SoFunction+0×27
00000000`000313b0 00000001`40001327 StackOverflow!SoFunction+0×27
00000000`000313f0 00000001`40001327 StackOverflow!SoFunction+0×27
00000000`00031430 00000001`40001327 StackOverflow!SoFunction+0×27
00000000`00031470 00000001`40001327 StackOverflow!SoFunction+0×27
00000000`000314b0 00000001`40001327 StackOverflow!SoFunction+0×27
0:000> r
rax=0000000000007e98 rbx=00000000000f26fe rcx=0000000077c4080a
rdx=0000000000000000 rsi=000000000000000f rdi=0000000000000000
rip=0000000140001322 rsp=0000000000030ff0 rbp=00000001400035f0
 r8=000000000012faa8  r9=00000001400035f0 r10=0000000000000000
r11=0000000000000246 r12=000000000012fd68 r13=000000000012fce0
r14=00000000000f26fe r15=0000000000000000
iopl=0 nv up ei pl nz na pe nc
cs=0033 ss=002b ds=002b es=002b fs=0053 gs=002b efl=00010202
StackOverflow!SoFunction+0×22:
00000001`40001322 call    StackOverflow!SoFunction (00000001`40001300)

Therefore we expect the second chance exception at the same address here and we get it indeed when we continue execution:

0:000> g
(159c.fc4): Access violation - code c0000005 (!!! second chance !!!)
StackOverflow!SoFunction+0x22:
00000001`40001322 call    StackOverflow!SoFunction (00000001`40001300)

Now we see why the process died silently. There was no stack space left for exception dispatch handler functions and therefore for the default unhandled exception filter that launches the default postmortem debugger to save a process dump. So it looks like on x64 Windows when our process had first chance stack overflow exception there was no second chance exception afterwards and after handling first chance stack overflow exception process execution resumed and finally hit its thread stack limit. This doesn’t happen with 32-bit processes even on x64 Windows where unhandled first chance stack overflow exception results in immediate second chance stack overflow exception at the same stack address and therefore there is a sufficient room for the local variables for exception handler and filter functions.

This is an example of what happened before exception handling changes in Vista.

- Dmitry Vostokov @ DumpAnalysis.org -

GDB for WinDbg Users (Part 2)

June 26th, 2007

The primary motivation for this tutorial is to help WinDbg users starting with FreeBSD or Linux core dump analysis like myself to quickly learn GDB debugger commands because most debugging and crash dump analysis principles and techniques are the same for both worlds. You need to disassemble, dump memory locations, list threads and their stack traces, etc. GDB users starting with Windows crash dump analysis can learn WinDbg commands quickly so this tutorial has a second name: ”WinDbg for GDB users“. I don’t want to create a separate tutorial for this to avoid duplication but I have created a separate blog category “WinDbg for GDB users” to include selected posts where I map WinDbg commands to GDB commands and vice versa.

Although GDB is primarily used on Unix systems it is possible to use it on Windows. For this tutorial I use MinGW (Minimalist GNU for Windows):

http://www.mingw.org

You can download and install the current MinGW package from SourceForge:

http://sourceforge.net/project/showfiles.php?group_id=2435

Next you need to download an install GDB package. At the time of this writing both packages (MinGW-5.1.3.exe and gdb-5.2.1-1.exe) were available at the following location:

http://sourceforge.net/project/showfiles.php?group_id=2435&package_id=82721

When installing MinGW package select MinGW base tools and g++ compiler. This will download necessary components for GNU C/C++ environment. When installing GDB package select the same destination folder you used when installing MinGW package.

Now we can create the first C program we will use for learning GDB commands:

#include <stdio.h>
int main()
{
  puts("Hello World!");
  return 0;
}

Create test.c file, save it in examples folder, compile and link into test.exe:

C:\MinGW>mkdir examples

C:\MinGW\examples>..\bin\gcc -o test.exe test.c

C:\MinGW\examples>test
Hello World!

Now you can run it under GDB: 

C:\MinGW\examples>..\bin\gdb test.exe
GNU gdb 5.2.1
...
...
...
(gdb) run
Starting program: C:\MinGW\examples/test.exe

Program exited normally.
(gdb) q

C:\MinGW\examples>

WinDbg equivalent to GDB run command is g.

Here is the command line to launch WinDbg and load the same program:

C:\MinGW\examples>"c:\Program Files\Debugging Tools for Windows\WinDbg" -y SRV*c:\symbols*http://msdl.microsoft.com/download/symbols test.exe

WinDbg will set the initial breakpoint and you can execute the process with g command:

Microsoft (R) Windows Debugger  Version 6.7.0005.0
Copyright (c) Microsoft Corporation. All rights reserved.

CommandLine: test.exe
Symbol search path is: SRV*c:\symbols*http://msdl.microsoft.com/download/symbols
Executable search path is:
ModLoad: 00400000 00406000   image00400000
ModLoad: 7c900000 7c9b0000   ntdll.dll
ModLoad: 7c800000 7c8f4000   C:\WINDOWS\system32\kernel32.dll
ModLoad: 77c10000 77c68000   C:\WINDOWS\system32\msvcrt.dll
(220.fbc): Break instruction exception - code 80000003 (first chance)
eax=00341eb4 ebx=7ffde000 ecx=00000004 edx=00000010 esi=00341f48 edi=00341eb4
eip=7c901230 esp=0022fb20 ebp=0022fc94 iopl=0 nv up ei pl nz na po nc
cs=001b ss=0023 ds=0023 es=0023 fs=003b gs=0000 efl=00000202
ntdll!DbgBreakPoint:
7c901230 cc              int     3
0:000> g
eax=0022fe60 ebx=00000000 ecx=0022fe68 edx=7c90eb94 esi=7c90e88e edi=00000000
eip=7c90eb94 esp=0022fe68 ebp=0022ff64 iopl=0 nv up ei pl zr na pe nc
cs=001b ss=0023 ds=0023 es=0023 fs=003b gs=0000 efl=00000246
ntdll!KiFastSystemCallRet:
7c90eb94 c3              ret

q command to end a debugging session is the same for both debuggers.  

So our first map between GDB and WinDbg commands contains the following entries:

Action                  GDB     | WinDbg
----------------------------------------
Start the process       run     | g
Exit                    (q)uit  | q

- Dmitry Vostokov @ DumpAnalysis.org -

GDB for WinDbg Users (Part 1)

June 25th, 2007

Recently started using GDB on FreeBSD and found AT&T Intel assembly language syntax uncomfortable. The same is when using GDB on Windows. Source and destination operands are reversed and negative offsets like -4 are represented in hexadecimal format like 0xfffffffc. It is ok for small assembly language fragments but very confusing when looking at several pages of code. Here is an example of AT&T syntax:

C:\MinGW\bin>gdb a.exe
GNU gdb 5.2.1
Copyright 2002 Free Software Foundation, Inc.
GDB is free software, covered by the GNU General Public License, and you are welcome to change it and/or distribute copies of it under certain conditions.
Type "show copying" to see the conditions.
There is absolutely no warranty for GDB. Type "show warranty" for details.
This GDB was configured as "i686-pc-mingw32"...(no debugging symbols found)...
(gdb) disas main
Dump of assembler code for function main:
0x4012f0 <main>:        push   %ebp
0x4012f1 <main+1>:      mov    %esp,%ebp
0x4012f3 <main+3>:      sub    $0x8,%esp
0x4012f6 <main+6>:      and    $0xfffffff0,%esp
0x4012f9 <main+9>:      mov    $0x0,%eax
0x4012fe <main+14>:     add    $0xf,%eax
0x401301 <main+17>:     add    $0xf,%eax
0x401304 <main+20>:     shr    $0x4,%eax
0x401307 <main+23>:     shl    $0x4,%eax
0x40130a <main+26>:     mov    %eax,0xfffffffc(%ebp)
0x40130d <main+29>:     mov    0xfffffffc(%ebp),%eax
0x401310 <main+32>:     call   0x401850 <_alloca>
0x401315 <main+37>:     call   0x4014f0 <__main>
0x40131a <main+42>:     leave
0x40131b <main+43>:     ret
0x40131c <main+44>:     nop
0x40131d <main+45>:     nop
0x40131e <main+46>:     nop
0x40131f <main+47>:     nop
End of assembler dump.

To my relief, I found that I can change AT&T flavour to Intel using the following command:

(gdb) set disassembly-flavor intel

The same function now looks more familiar:

(gdb) disas main
Dump of assembler code for function main:
0x4012f0 <main>:        push   ebp
0x4012f1 <main+1>:      mov    ebp,esp
0x4012f3 <main+3>:      sub    esp,0x8
0x4012f6 <main+6>:      and    esp,0xfffffff0
0x4012f9 <main+9>:      mov    eax,0x0
0x4012fe <main+14>:     add    eax,0xf
0x401301 <main+17>:     add    eax,0xf
0x401304 <main+20>:     shr    eax,0x4
0x401307 <main+23>:     shl    eax,0x4
0x40130a <main+26>:     mov    DWORD PTR [ebp-4],eax
0x40130d <main+29>:     mov    eax,DWORD PTR [ebp-4]
0x401310 <main+32>:     call   0x401850 <_alloca>
0x401315 <main+37>:     call   0x4014f0 <__main>
0x40131a <main+42>:     leave
0x40131b <main+43>:     ret
0x40131c <main+44>:     nop
0x40131d <main+45>:     nop
0x40131e <main+46>:     nop
0x40131f <main+47>:     nop
End of assembler dump.

- Dmitry Vostokov @ DumpAnalysis.org -

Detecting loops in code

June 23rd, 2007

Sometimes when we look at a stack trace and disassembled code we see that a crash couldn’t have happened if the code path was linear. In such cases we need to see if there is any loop that changes some variables. This is greatly simplified if we have source code but in cases where we don’t have access to source code it is still possible to detect loops. We just need to find a direct (JMP) or conditional jump instruction (Jxxx, for example, JE) after the crash point branching to the beginning of the loop before the crash point as shown in the following pseudo code:

set the pointer value

label:

>>> crash when dereferencing the pointer

change the pointer value

jmp label

Let’s look at one example I found very interesting because it also shows __thiscall calling convention for C++ code generated by Visual С++ compiler. Before we look at the dump I quickly remind you about how C++ non-static class methods are called. Let’s first look at non-virtual method call.

class A
{
public:
        int foo() { return i; }
virtual int bar() { return i; }
private:
        int i;
};

Internally class members are accessed via implicit this pointer (passed via ECX):

int A::foo() { return this->i; }

Suppose we have an object instance of class A and we call its foo method:

A obj;
obj.foo();

The compiler has to generate code which calls foo function and the code inside the function has to know which object it is associated with. So internally the compiler passes implicit parameter - a pointer to that object. In pseudo code:

int foo_impl(A *this)
{
return this->i;
}

A obj;
foo_impl(&obj);

In x86 assembly language it should be similar to this code:

lea ecx, obj
call foo_impl

If you have obj declared as a local variable:

lea ecx, [ebp-N]
call foo_impl

If you have a pointer to an obj then the compiler usually generates mov instruction instead of lea instruction:

A *pobj;
pobj->foo();

mov ecx, [ebp-N]
call foo_impl

If you have other function parameters they are pushed on the stack from right to left. This is __thiscall calling convention. For virtual function call we have an indirect call through virtual function table. The pointer to it is the first object layout member and in the latter case where the pointer to obj is declared as the local variable we have the following x86 code:

A *pobj;
pobj->bar();

mov ecx, [ebp-N]
mov eax, [ecx]
call [eax]

Now let’s look at the crash point and stack trace:

0:021> r
eax=020864ee ebx=00000000 ecx=0000005c edx=7518005c esi=020864dc edi=00000000
eip=67dc5dda esp=075de820 ebp=075dea78 iopl=0 nv up ei pl nz na po nc
cs=001b ss=0023 ds=0023 es=0023 fs=003b gs=0000 efl=00010202
component!CDirectory::GetDirectory+0×8a:
67dc5dda 8b03 mov eax,dword ptr [ebx] ds:0023:00000000=????????

0:021> k
ChildEBP RetAddr
075dea78 004074f0 component!CDirectory::GetDirectory+0x8a
075deaac 0040e4fc component!CDirectory::FindFirstFileW+0xd0
075dffb8 77e64829 component!MonitorThread+0x13
075dffec 00000000 kernel32!BaseThreadStart+0x34

If we look at GetDirectory code we would see:

0:021> .asm no_code_bytes
Assembly options: no_code_bytes

0:021> uf component!CDirectory::GetDirectory
component!CDirectory::GetDirectory:
67dc5d50 push    ebp
67dc5d51 mov     ebp,esp
67dc5d53 push    0FFFFFFFFh
67dc5d55 push    offset component!CreateErrorInfo+0x553 (67ded93b)
67dc5d5a mov     eax,dword ptr fs:[00000000h]
67dc5d60 push    eax
67dc5d61 mov     dword ptr fs:[0],esp
67dc5d68 sub     esp,240h
67dc5d6e mov     eax,dword ptr [component!__security_cookie (67e0113c)]
67dc5d73 mov     dword ptr [ebp-10h],eax
67dc5d76 mov     eax,dword ptr [ebp+8]
67dc5d79 test    eax,eax
67dc5d7b push    ebx
67dc5d7c mov     ebx,ecx
67dc5d7e mov     dword ptr [ebp-238h],ebx
67dc5d84 je      component!CDirectory::GetDirectory+0×2a1 (67dc5ff1)

component!CDirectory::GetDirectory+0x3a:
67dc5d8a cmp     word ptr [eax],0
67dc5d8e je      component!CDirectory::GetDirectory+0x2a1 (67dc5ff1)

component!CDirectory::GetDirectory+0x44:
67dc5d94 push    esi
67dc5d95 push    eax
67dc5d96 call    dword ptr [component!_imp__wcsdup (67df050c)]
67dc5d9c add     esp,4
67dc5d9f mov     dword ptr [ebp-244h],eax
67dc5da5 mov     dword ptr [ebp-240h],eax
67dc5dab push    5Ch
67dc5dad lea     ecx,[ebp-244h]
67dc5db3 mov     dword ptr [ebp-4],0
67dc5dba call    component!CStrToken::Next (67dc4f80)
67dc5dbf mov     esi,eax
67dc5dc1 test    esi,esi
67dc5dc3 je      component!CDirectory::GetDirectory+0x28c (67dc5fdc)

component!CDirectory::GetDirectory+0x79:
67dc5dc9 push    edi
67dc5dca lea     ebx,[ebx]

component!CDirectory::GetDirectory+0x80:
67dc5dd0 cmp     word ptr [esi],0
67dc5dd4 je      component!CDirectory::GetDirectory+0x28b (67dc5fdb)

component!CDirectory::GetDirectory+0x8a:
>>> 67dc5dda mov     eax,dword ptr [ebx]
67dc5ddc mov ecx,ebx

If we trace EBX backwards (red) we would see that it comes from ECX (blue) so ECX could be considered as an implicit this pointer according to __thiscall calling convention. Therefore it looks like the caller passed NULL this pointer via ECX.

Let’s look at the caller. To see the code we can either disassemble FindFirstFileW or disassemble backwards at the GetDirectory return address. I’ll do the latter:

0:021> k
ChildEBP RetAddr
075dea78 004074f0 component!CDirectory::GetDirectory+0×8a
075deaac 0040e4fc component!CDirectory::FindFirstFileW+0xd0
075dffb8 77e64829 component!MonitorThread+0×13
075dffec 00000000 kernel32!BaseThreadStart+0×34

0:021> ub 004074f0
component!CDirectory::FindFirstFileW+0xbe:
004074de pop     ebp
004074df clc
004074e0 mov     ecx,dword ptr [esi+8E4h]
004074e6 mov     eax,dword ptr [ecx]
004074e8 push    0
004074ea push    0
004074ec push    edx
004074ed call    dword ptr [eax+10h]

We see that ECX is our this pointer. However the virtual table pointer is taken from the memory it references:

004074e6 mov eax,dword ptr [ecx]


004074ed call dword ptr [eax+10h]

Were ECX a NULL we would have had our crash at this point. However we have our crash in the called function. So it couldn’t be NULL. There is a contradiction here. The only plausible explanation is that in GetDirectory function there is a loop that changes EBX (shown in red in GetDirectory function code above). If we have a second look at the code we would see that EBX is saved in [ebp-238h] local variable before it is used:

0:021> uf component!CDirectory::GetDirectory
component!CDirectory::GetDirectory:
67dc5d50 push    ebp
67dc5d51 mov     ebp,esp
67dc5d53 push    0FFFFFFFFh
67dc5d55 push    offset component!CreateErrorInfo+0x553 (67ded93b)
67dc5d5a mov     eax,dword ptr fs:[00000000h]
67dc5d60 push    eax
67dc5d61 mov     dword ptr fs:[0],esp
67dc5d68 sub     esp,240h
67dc5d6e mov     eax,dword ptr [component!__security_cookie (67e0113c)]
67dc5d73 mov     dword ptr [ebp-10h],eax
67dc5d76 mov     eax,dword ptr [ebp+8]
67dc5d79 test    eax,eax
67dc5d7b push    ebx
67dc5d7c mov     ebx,ecx
67dc5d7e mov     dword ptr [ebp-238h],ebx
67dc5d84 je      component!CDirectory::GetDirectory+0×2a1 (67dc5ff1)

component!CDirectory::GetDirectory+0x3a:
67dc5d8a cmp     word ptr [eax],0
67dc5d8e je      component!CDirectory::GetDirectory+0x2a1 (67dc5ff1)

component!CDirectory::GetDirectory+0x44:
67dc5d94 push    esi
67dc5d95 push    eax
67dc5d96 call    dword ptr [component!_imp__wcsdup (67df050c)]
67dc5d9c add     esp,4
67dc5d9f mov     dword ptr [ebp-244h],eax
67dc5da5 mov     dword ptr [ebp-240h],eax
67dc5dab push    5Ch
67dc5dad lea     ecx,[ebp-244h]
67dc5db3 mov     dword ptr [ebp-4],0
67dc5dba call    component!CStrToken::Next (67dc4f80)
67dc5dbf mov     esi,eax
67dc5dc1 test    esi,esi
67dc5dc3 je      component!CDirectory::GetDirectory+0x28c (67dc5fdc)

component!CDirectory::GetDirectory+0x79:
67dc5dc9 push    edi
67dc5dca lea     ebx,[ebx]

component!CDirectory::GetDirectory+0x80:
67dc5dd0 cmp     word ptr [esi],0
67dc5dd4 je      component!CDirectory::GetDirectory+0x28b (67dc5fdb)

component!CDirectory::GetDirectory+0x8a:
>>> 67dc5dda mov     eax,dword ptr [ebx]
67dc5ddc mov ecx,ebx

If we look further past the crash point we would see that [ebp-238h] value is changed and then used again to change EBX:

component!CDirectory::GetDirectory+0x80:
67dc5dd0 cmp word ptr [esi],0
67dc5dd4 je component!CDirectory::GetDirectory+0×28b (67dc5fdb)

component!CDirectory::GetDirectory+0x8a:
>>> 67dc5dda mov eax,dword ptr [ebx]
67dc5ddc mov ecx,ebx


component!CDirectory::GetDirectory+0×11e:
67dc5e6e mov     eax,dword ptr [ebp-23Ch]
67dc5e74 mov     ecx,dword ptr [eax]
67dc5e76 mov     dword ptr [ebp-238h],ecx
67dc5e7c jmp     component!CDirectory::GetDirectory+0×20e (67dc5f5e)


component!CDirectory::GetDirectory+0×23e:
67dc5f8e cmp     esi,edi
67dc5f90 mov     ebx,dword ptr [ebp-238h]
67dc5f96 jne     component!CDirectory::GetDirectory+0×80 (67dc5dd0)

We see that after changing EBX the code jumps to 67dc5dd0 address and this address is just before our crash point. It looks like a loop. Therefore there is no contradiction. ECX as this pointer was passed as non-NULL and valid pointer. Before the loop started its value was passed to EBX. In the loop body EBX was changed and after some loop iterations the new value became NULL. It could be the case that there were no checks for NULL pointers in the loop code.

- Dmitry Vostokov @ DumpAnalysis.org -

Guessing stack trace

June 21st, 2007

Sometimes instead of looking at raw stack data to identify all modules that might have been involved in a problem thread we can use the following old Windows 2000 kdex2×86 WinDbg extension command that can even work with Windows 2003 or XP kernel memory dumps:

4: kd> !w2kfre\kdex2x86.stack -?
!stack - Do stack trace for specified thread
Usage : !stack [-?ha[0|1]] [address]
Arguments :
 -?,-h - display help information.
 -a - specifies display mode. This option is off, in default. If this option is specified, output stack trace in detail.
 -0,-1 - specifies filter level for display. Default filter level is 0. In level 0, display stackframes that are guessed return-adresses for reason of its value and previous mnemonic. In level 1, display stackframes that call other stackframe or is called by other stackframe, besides level 0.
 address - specifies thread address. When address is omitted, do stack trace for the current thread.

For example:

Loading Dump File [MEMORY.DMP]
Kernel Summary Dump File: Only kernel address space is available
Windows Server 2003 Kernel Version 3790 (Service Pack 2) MP (8 procs) Free x86 compatible
Product: Server, suite: Enterprise TerminalServer
Built by: 3790.srv03_sp2_gdr.070304-2240
Kernel base = 0x80800000 PsLoadedModuleList = 0x808a6ea8
Debug session time: Mon Jun 11 14:49:21.541 2007 (GMT+1)
System Uptime: 0 days 2:10:11.877

4: kd> k
ChildEBP RetAddr
b7a24e84 80949b48 nt!KeBugCheckEx+0x1b
b7a24ea0 80949ba4 nt!PspUnhandledExceptionInSystemThread+0x1a
b7a25ddc 8088e062 nt!PspSystemThreadStartup+0x56
00000000 00000000 nt!KiThreadStartup+0x16

4: kd> !w2kfre\kdex2x86.stack
T. Address  RetAddr  Called Procedure
*2 B7A24E68 80827C63 nt!KeBugCheck2(0000007E, C0000005, BFE5FEEA,...);
*2 B7A24E88 80949B48 nt!KeBugCheckEx(0000007E, C0000005, BFE5FEEA,...);
*2 B7A24EA4 80949BA4 nt!PspUnhandledExceptionInSystemThread(B7A24EC8, 80881801, B7A24ED0,...);
*0 B7A24EAC 80881801 dword ptr EAX(B7A24ED0, 00000000, B7A24ED0,...);
*1 B7A24ED4 8088ED4E dword ptr ECX(B7A25378, B7A25DCC, B7A25074,...);
*1 B7A24EF8 8088ED20 nt!ExecuteHandler2(B7A25378, B7A25DCC, B7A25074,...);
*1 B7A24F1C 80877C0C nt!RtlpExecuteHandlerForException(B7A25378, B7A25DCC, B7A25074,...);
*0 B7A24F5C 808914F7 nt!RtlClearBits(893E3BF8, 0000014A, 00000001,...);
*1 B7A24FA8 8082D58F nt!RtlDispatchException(B7A25378, B7A25074, 00000008,...);
*1 B7A2501C 80A5C456 hal!HalpCheckForSoftwareInterrupt(89267D08, 00000000, 89267D00,...);
*1 B7A25030 80A5C456 hal!HalpCheckForSoftwareInterrupt(00000000, 89267D00, B7A25060,...);
*1 B7A25040 80A5A56D hal!KfLowerIrql(8087C9C0, BC910000, 00000018,...);
*1 B7A25044 8087C9C0 hal!KeReleaseInStackQueuedSpinLock(BC910000, 00000018, BFEBC0A0,...);
*1 B7A25064 8087CA95 nt!ExReleaseResourceLite(B7A253CC, B7A25078, B7A25378,...);
*0 B7A250F4 F346C646 termdd!IcaCallNextDriver(88F9E2A4, 00000002, 00000000,...);
*1 B7A25140 F764C20E termdd!_IcaCallSd(88F9E290, 00000002, B7A251EC,...);
*1 B7A25154 F3464959 termdd!IcaCallNextDriver(88F876B4, 00000002, B7A251EC,...);
*1 B7A25174 F346632D component2+00000830(88F4F990, B7A251EC, 88F876B0,...);
*1 B7A25188 F764C1C7 dword ptr EAX(88F4F990, B7A251EC, 88DFB000,...);
*1 B7A251A4 F764C20E termdd!_IcaCallSd(88F876A0, 00000002, B7A251EC,...);
*1 B7A251B8 F36C9928 termdd!IcaCallNextDriver(88EAEC6C, F773F120, F773F120,...);
*0 B7A251D0 80892853 nt!RtlpInterlockedPushEntrySList(00000000, 00000000, 808B4900,...);
*0 B7A251E8 8081C3DA nt!RtlpInterlockedPushEntrySList(89586178, 00000000, 00000000,...);
*0 B7A251FC 80821967 nt!ObDereferenceObjectDeferDelete(8082196C, 894E8648, 898B0020,...);
*0 B7A25200 8082196C nt!_SEH_epilog(894E8648, 898B0020, 80A5A530,...);
*0 B7A25248 8082196C nt!_SEH_epilog(8082DFC3, 894E8648, B7A25294,...);
*1 B7A2524C 8082DFC3 dword ptr [EBP-14](894E8648, B7A25294, B7A25288,...);
*1 B7A2529C 80A5C199 nt!KiDeliverApc(00000000, 00000000, 00000000,...);
*1 B7A252BC 80A5C3D9 hal!HalpDispatchSoftwareInterrupt(898B0001, 00000000, 00000000,...);
*1 B7A252D8 80A5C456 hal!HalpCheckForSoftwareInterrupt(00000001, 898B0000, B7A25300,...);
*1 B7A252E8 8083129E hal!KfLowerIrql(898B0020, 894E8648, 89468504,...);
*1 B7A25304 8082AB7B nt!KiExitDispatcher(894E8648, 894E8608, 00000000,...);
*1 B7A25318 80864E45 nt!MiFindNodeOrParent(893F8E00, 00000000, B7A2532C,...);
*1 B7A25334 8084D308 nt!MiLocateAddress(C0000000, C0600000, 0000BB40,...);
*1 B7A25360 8088A262 nt!KiDispatchException(B7A25378, 00000000, B7A253CC,...);
*0 B7A253A0 F7648BFE termdd!_SEH_epilog(00000000, C0000005, 00000018,...);
*0 B7A253B8 8088C798 nt!MmAccessFault(00000000, 00000008, 00000000,...);
*1 B7A253C8 8088A216 nt!CommonDispatchException(B7A25488, BFE5FEEA, BADB0D00,...);
*1 B7A25450 BFE7B854 component+0003D5D0(BC048FE0, 00000000, 00000003,...);
*1 B7A2548C BFE6C043 component+00021B70(04048FE0, BC912820, BFEBC0A0,...);
*1 B7A254A8 BFE6CCBD component+0002DFD0(BC912820, BC14A2B4, BC14A018,...);
*1 B7A254CC BFE6FCB6 component+0002EBE0(BFEBC0A0, BFEBC038, BFEBBF80,...);
*1 B7A255C8 80A5C456 hal!HalpCheckForSoftwareInterrupt(00000000, 8CE03500, B7A255F8,...);
*1 B7A255D8 80A5A56D hal!KfLowerIrql(8087C9C0, 88F93F24, E1681348,...);
*1 B7A255DC 8087C9C0 hal!KeReleaseInStackQueuedSpinLock(88F93F24, E1681348, 00000000,...);
*1 B7A255FC F7134586 nt!ExReleaseResourceLite(88F93EF8, B7A2561C, F7134640,...);
*1 B7A25608 F7134640 Ntfs!NtfsReleaseFcb(88F93EF8, 88F93EF8, 00000000,...);
*1 B7A2561C F7133091 Ntfs!NtfsFreeSnapshotsForFcb(88F93EF8, 00000014, 88F93EF8,...);
*1 B7A25638 F7133177 Ntfs!NtfsCleanupIrpContext(88F93EF8, 00000001, 00000000,...);
*1 B7A25650 F7174936 Ntfs!NtfsCompleteRequest(88F93EF8, 00000000, F7174943,...);
*0 B7A2565C F7174943 Ntfs!_SEH_epilog(00000000, B7A257A0, 88F103D8,...);
*1 B7A2568C 80A5C456 hal!HalpCheckForSoftwareInterrupt(00000000, 00000001, 00000001,...);
*1 B7A256D4 80A5C456 hal!HalpCheckForSoftwareInterrupt(00000001, 808B4300, B7A256FC,...);
*1 B7A256E4 8083129E hal!KfLowerIrql(00000000, B7A25C90, 00000000,...);
*1 B7A25700 808281D6 nt!KiExitDispatcher(88F103D8, 00000000, 00000000,...);
*1 B7A25714 8081E1E9 nt!KeSetEvent(00A25C90, 00000001, 00000000,...);
*1 B7A2573C F7133177 Ntfs!NtfsCleanupIrpContext(B7A25750, B7A257A4, 00000000,...);
*1 B7A25780 80A5C456 hal!HalpCheckForSoftwareInterrupt(0000026C, 808B4900, B7A25828,...);
*1 B7A25790 80A5A56D hal!KfLowerIrql(8085712D, 00000000, 00180000,...);
*1 B7A25794 8085712D hal!KeReleaseQueuedSpinLock(00000000, 00180000, 00181000,...);
*1 B7A2582C 8085755D nt!MiProcessValidPteList(B7A25844, 00000002, C0000C08,...);
*1 B7A25890 80A5C456 hal!HalpCheckForSoftwareInterrupt(00000001, 808B4300, F7747120,...);
*0 B7A258C4 F724DA0D fltmgr!FltDecodeParameters(88E3BD2C, B7A25924, 88E62020,...);
*0 B7A258E8 8082CD1F nt!KiEspFromTrapFrame(B7A25D64, 894CA9C8, 7FFDA000,...);
*0 B7A258F8 8082CF40 nt!__security_check_cookie(B7A25D64, 01A5C456, 892373F8,...);
*1 B7A25914 80A5C456 hal!HalpCheckForSoftwareInterrupt(8081C585, B7A25944, B7A25948,...);
*1 B7A25918 8081C585 nt!RtlpGetStackLimits(B7A25944, B7A25948, 00000000,...);
*1 B7A25934 F713320E nt!IoGetStackLimits(000015ED, B7A25764, B7A25A78,...);
*1 B7A25970 80A5C456 hal!HalpCheckForSoftwareInterrupt(8CE03598, 00000000, 8CE03500,...);
*0 B7A2598C 808347E4 nt!ProbeForWrite(0032FD14, 000002E4, 808348C6,...);
*0 B7A25998 808348C6 nt!_SEH_epilog(7FFDA000, 894CA9C8, 00000000,...);
*0 B7A259A8 F713435F Ntfs!ExFreeToNPagedLookasideList(F7150420, 88F93EF8, B7A25ACC,...);
*0 B7A259D8 8082CBCF nt!KiEspFromTrapFrame(C0001978, 83F251EC, 00000000,...);
*0 B7A259F0 80865C32 nt!MiInsertPageInFreeList(C0001978, 00000000, 83F251EC,...);
*1 B7A25A30 80A5C456 hal!HalpCheckForSoftwareInterrupt(C0001980, C0600000, 808B4900,...);
*1 B7A25A44 80A5C456 hal!HalpCheckForSoftwareInterrupt(C0600008, 808B4900, B7A25B2C,...);
*1 B7A25A54 80A5A56D hal!KfLowerIrql(808658FB, 0032FFFF, 890D4198,...);
*1 B7A25A58 808658FB hal!KeReleaseQueuedSpinLock(0032FFFF, 890D4198, 8CB0B7B0,...);
*1 B7A25A7C 80A5C456 hal!HalpCheckForSoftwareInterrupt(C0600018, 808B4900, B7A25B44,...);
*1 B7A25A8C 80A5A56D hal!KfLowerIrql(808658FB, 88E62020, 89293DF0,...);
*1 B7A25A90 808658FB hal!KeReleaseQueuedSpinLock(88E62020, 89293DF0, 88F87718,...);
*0 B7A25AC4 80945FEA nt!ObReferenceObjectByHandle(00000000, 00000018, 0032FE64,...);
*0 B7A25AE0 80892853 nt!RtlpInterlockedPushEntrySList(8CB0B890, 890D4198, 8CB0B7B0,...);
*1 B7A25AF4 80A5C1AE nt!KiDispatchInterrupt(00000000, 00000000, 00000202,...);
*1 B7A25B08 80A5C3D9 hal!HalpDispatchSoftwareInterrupt(00000002, 00000000, 80A5C3F4,...);
*0 B7A25B20 8081C3DA nt!RtlpInterlockedPushEntrySList(89586178, 00000000, 00000000,...);
*0 B7A25B34 80821967 nt!ObDereferenceObjectDeferDelete(8082196C, 8C22B848, 898B0020,...);
*0 B7A25B38 8082196C nt!_SEH_epilog(8C22B848, 898B0020, 80A5A530,...);
*0 B7A25B4C 8081C3DA nt!RtlpInterlockedPushEntrySList(00000000, 00000000, 8C22B808,...);
*0 B7A25B80 8082196C nt!_SEH_epilog(8082DFC3, 8C22B848, B7A25BCC,...);
*1 B7A25B84 8082DFC3 dword ptr [EBP-14](8C22B848, B7A25BCC, B7A25BC0,...);
*1 B7A25BD4 80A5C199 nt!KiDeliverApc(00000000, 00000000, 00000000,...);
*1 B7A25BF4 80A5C3D9 hal!HalpDispatchSoftwareInterrupt(898B0001, 00000000, 00000000,...);
*1 B7A25C10 80A5C456 hal!HalpCheckForSoftwareInterrupt(00000001, 898B0000, B7A25C38,...);
*1 B7A25C20 8083129E hal!KfLowerIrql(898B0020, 8C22B848, 00000010,...);
*1 B7A25C54 80A5C456 hal!HalpCheckForSoftwareInterrupt(F7757000, 00000002, 893F8BB0,...);
*1 B7A25C64 8088DBAC hal!KfLowerIrql(B7A25C88, BFE6BA78, 00000000,...);
*1 B7A25C78 80A5C1AE nt!KiDispatchInterrupt(B7A25CC0, B7A25D00, 00000002,...);
*1 B7A25C8C 80A5C3D9 hal!HalpDispatchSoftwareInterrupt(00000002, B7A25CC0, B7A25CC0,...);
*1 B7A25CA8 80A5C57E nt!KiCheckForSListAddress(BC845018, B7A25CC0, 80A59902,...);
*1 B7A25CB4 80A59902 hal!HalEndSystemInterrupt(898B0000, 000000E1, B7A25D40,...);
*1 B7A25CE0 80A5C456 hal!HalpCheckForSoftwareInterrupt(00000001, 894890F0, 894890D8,...);
*0 B7A25CF4 8087CDDC hal!KeReleaseInStackQueuedSpinLock(894890D8, 00000000, 89489100,...);
*1 B7A25D18 80A5A56D hal!KfLowerIrql(00000001, BC14A018, BC5F9003,...);
*1 B7A25D44 BFE708D4 component+000312D0(BFEBBF80, 00000000, 00000000,...);

Another thread:

4: kd> ~1

1: kd> k
ChildEBP RetAddr
f37fe9b4 f57e8407 tcpip!_IPTransmit+0x172c
f37fea24 f57e861a tcpip!TCPSend+0x604
f37fea54 f57e6edd tcpip!TdiSend+0x242
f37fea90 f57e1d13 tcpip!TCPSendData+0xbf
f37feaac 8081df65 tcpip!TCPDispatchInternalDeviceControl+0x19a
f37feac0 f57305dc nt!IofCallDriver+0x45
8cde7030 8c297030 afd!AfdFastConnectionSend+0x238
WARNING: Frame IP not in any known module. Following frames may be wrong.
8cde7044 8cde70d8 0x8c297030
8cde7048 001a001a 0x8cde70d8
8cde70d8 00000000 0x1a001a

1: kd> !w2kfre\kdex2x86.stack
T. Address  RetAddr  Called Procedure
*1 F37FE8D4 80A5C456 hal!HalpCheckForSoftwareInterrupt(00000000, 00000000, F37FE904,...);
*0 F37FE984 F57DE006 NDIS!NdisCopyBuffer(F37FE9AC, F37FE9B0, 00000000,...);
*2 F37FE9B8 F57E8407 tcpip!IPTransmitBeforeSym(F58224D8, 8C396348, 8C3962E0,...);
*0 F37FE9F0 F5815DB6 tcpip!NeedToOffloadConnection(88EBC720, 00000B55, 00000001,...);
*2 F37FEA28 F57E861A tcpip!TCPSend(8AF6F701, 7FEA6000, 001673CE,...);
*2 F37FEA58 F57E6EDD tcpip!TdiSend(00000000, 00000000, 00000B55,...);
*0 F37FEA88 F5722126 dword ptr [ESI+28](F58203C0, F37FEAAC, F57E1D13,...);
*2 F37FEA94 F57E1D13 tcpip!TCPSendData(88FEE99C, 00EE5FA0, 88EE5EB0,...);
*2 F37FEAB0 8081DF65 tcpip!TCPDispatchInternalDeviceControl+0000019A(8C2D7030, 88EE5EE8, 89242378,...);
*2 F37FEAC4 F57305DC nt!IofCallDriver(F37FEBB8, 00000002, F37FEB1C,...);
*2 F37FEB14 F5726191 afd!AfdFastConnectionSend(89315008, 00000000, F5726191,...);
*1 F37FEB20 F5726191 afd!AfdFastConnectionSend(89315008, F37FEBA8, 00000B55,...);
*1 F37FEB68 80A5C456 hal!HalpCheckForSoftwareInterrupt(8908AE01, 808B4301, F37FEB90,...);
*1 F37FEB78 8083129E hal!KfLowerIrql(88F24A58, 00000000, 8908AE01,...);
*1 F37FEB94 8082B96B nt!KiExitDispatcher(00000000, 8908AE30, 00000000,...);
*0 F37FEBF4 8082196C nt!_SEH_epilog(8082DFC3, 8908AE18, F37FEC40,...);
*0 F37FEBF8 8082DFC3 dword ptr [EBP-14](8908AE18, F37FEC40, F37FEC34,...);
*0 F37FEC2C 8098AA4A nt!ExpLookupHandleTableEntry(E18D5E38, 00000B55, 89315008,...);
*2 F37FEC60 808F5E2F afd!AfdFastIoDeviceControl+000003A3(89435340, 00000001, 00ECFDC4,...);
*1 F37FEC9C 80933491 nt!ExUnlockHandleTableEntry(E18D5E38, 00000001, 00000000,...);
*0 F37FECBC 8081C3DA nt!RtlpInterlockedPushEntrySList(0336E6D8, 0336E6EC, 00000000,...);
*1 F37FECD4 808ED600 nt!ObReferenceObjectByHandle(F37FED01, 89435340, 00000000,...);
*2 F37FED04 808EED08 nt!IopXxxControlFile(00000124, 00000000, 00000000,...);
*2 F37FED38 8088978C nt!NtDeviceIoControlFile+0000002A(00000124, 00000000, 00000000,...);

This command is called “heuristic stack walker” in OSR NT Insider article mentioned in the post about Stack Overflow pattern in kernel space.  

- Dmitry Vostokov @ DumpAnalysis.org -

Repair Clipboard Chain 2.0.1

June 21st, 2007

The new version has been published and available for download from Citrix support:

http://support.citrix.com/article/CTX106226

It allows to repair clipboard chain for individual ICA sessions:

C:\>RepairCBDChain.exe "Sent Items - Microsoft Outlook - \\Remote"
C:\>RepairCBDChain.exe "Weekly report - Message - \\Remote"

You might also repair individual RDP sessions if you specify the window class as the second parameter although I didn’t test this.

MessageHistory tool shows the following RDP client window on my x64 Windows 2003 Server responsible for receiving clipboard change notifications:

HWND: 0x00000000000318A8
Class: "RdpClipRdrWindowClass"
Title: ""
20:31:59:562 S WM_DRAWCLIPBOARD (0x308) wParam: 0x31986 lParam: 0x0

The command line should be:

C:\>RepairCBDChain.exe "" "RdpClipRdrWindowClass"

Inside RDP session on Windows XP the following rdpclip.exe window receives clipboard change notifications:

HWND: 0x0004003A
Class: "CBMonitorClass"
Title: "CB Monitor Window"
19:36:57:484 S WM_DRAWCLIPBOARD (0x308) wParam: 0x50142 lParam: 0x0

and the command line should be:

C:\>RepairCBDChain.exe "CB Monitor Window" "CBMonitorClass"

Please see Clipboard Issues Explained for a background explanation.

- Dmitry Vostokov @ DumpAnalysis.org -

Crash Dump Analysis Patterns (Part 16a)

June 21st, 2007

In this part I will show one example of Stack Overflow pattern in x86 Windows kernel. When it happens in kernel mode we usually have bugcheck 7F with the first argument being EXCEPTION_DOUBLE_FAULT (8):

UNEXPECTED_KERNEL_MODE_TRAP (7f)
This means a trap occurred in kernel mode, and it’s a trap of a kind that the kernel isn’t allowed to have/catch (bound trap) or that is always instant death (double fault). The first number in the bugcheck params is the number of the trap (8 = double fault, etc). Consult an Intel x86 family manual to learn more about what these traps are. Here is a *portion* of those codes:
If kv shows a taskGate
  use .tss on the part before the colon, then kv.
Else if kv shows a trapframe
  use .trap on that value
Else
  .trap on the appropriate frame will show where the trap was taken (on x86, this will be the ebp that goes with the procedure KiTrap)
Endif
kb will then show the corrected stack.
Arguments:
Arg1: 00000008, EXCEPTION_DOUBLE_FAULT
Arg2: f7747fe0
Arg3: 00000000
Arg4: 00000000

The kernel stack size for a thread is limited to 12Kb and is guarded by an invalid page. Therefore when you hit an invalid address on that page the processor generates a page fault, tries to push registers and gets a second page fault. This is what “double fault” means. In this scenario the processor switches to another stack via TSS (task state segment) task switching mechanism because IDT entry for trap 8 contains not an interrupt handler address but a so called TSS segment selector. This selector points to a memory segment that contains a new kernel stack pointer. The difference between normal IDT entry and double fault entry can be seen by inspecting IDT:

5: kd> !pcr 5
KPCR for Processor 5 at f7747000:
    Major 1 Minor 1
 NtTib.ExceptionList: b044e0b8
     NtTib.StackBase: 00000000
    NtTib.StackLimit: 00000000
  NtTib.SubSystemTib: f7747fe0
       NtTib.Version: 00ae1064
   NtTib.UserPointer: 00000020
       NtTib.SelfTib: 7ffdf000
             SelfPcr: f7747000
                Prcb: f7747120
                Irql: 00000000
                 IRR: 00000000
                 IDR: ffffffff
       InterruptMode: 00000000
                 IDT: f774d800
                 GDT: f774d400
                 TSS: f774a2e0
       CurrentThread: 8834c020
          NextThread: 00000000
          IdleThread: f774a090

5: kd> dt _KIDTENTRY f774d800
   +0x000 Offset           : 0x97e8
   +0x002 Selector         : 8
   +0x004 Access           : 0x8e00
   +0x006 ExtendedOffset   : 0x8088

5: kd> ln 0x808897e8
(808897e8)   nt!KiTrap00   |  (808898c0)   nt!Dr_kit1_a
Exact matches:
    nt!KiTrap00

5: kd> dt _KIDTENTRY f774d800+7*8
   +0x000 Offset           : 0xa880
   +0x002 Selector         : 8
   +0x004 Access           : 0x8e00
   +0x006 ExtendedOffset   : 0x8088

5: kd> ln 8088a880
(8088a880)   nt!KiTrap07   |  (8088ab72)   nt!KiTrap08
Exact matches:
    nt!KiTrap07

5: kd> dt _KIDTENTRY f774d800+8*8
   +0×000 Offset           : 0×1238
   +0×002 Selector         : 0×50
   +0×004 Access           : 0×8500
   +0×006 ExtendedOffset   : 0

5: kd> dt _KIDTENTRY f774d800+9*8
  +0x000 Offset : 0xac94
  +0x002 Selector : 8
  +0x004 Access : 0x8e00
  +0x006 ExtendedOffset : 0x8088

5: kd> ln 8088ac94
(8088ac94) nt!KiTrap09 | (8088ad10) nt!Dr_kita_a
Exact matches:
  nt!KiTrap09

If we switch to selector 50 explicitly we will see nt!KiTrap08 function which does bugcheck and saves the dump in KeBugCheck2 function:

5: kd> .tss 50
eax=00000000 ebx=00000000 ecx=00000000 edx=00000000 esi=00000000 edi=00000000
eip=8088ab72 esp=f774d3c0 ebp=00000000 iopl=0 nv up di pl nz na po nc
cs=0008 ss=0010 ds=0023 es=0023 fs=0030 gs=0000 efl=00000000
nt!KiTrap08:
8088ab72 fa              cli

5: kd> .asm no_code_bytes
Assembly options: no_code_bytes

5: kd> uf nt!KiTrap08
nt!KiTrap08:
8088ab72 cli
8088ab73 mov     eax,dword ptr fs:[00000040h]
8088ab79 mov     ecx,dword ptr fs:[124h]
8088ab80 mov     edi,dword ptr [ecx+38h]
8088ab83 mov     ecx,dword ptr [edi+18h]
8088ab86 mov     dword ptr [eax+1Ch],ecx
8088ab89 mov     cx,word ptr [edi+30h]
8088ab8d mov     word ptr [eax+66h],cx
8088ab91 mov     ecx,dword ptr [edi+20h]
8088ab94 test    ecx,ecx
8088ab96 je      nt!KiTrap08+0x2a (8088ab9c)

nt!KiTrap08+0x26:
8088ab98 mov     cx,48h

nt!KiTrap08+0x2a:
8088ab9c mov     word ptr [eax+60h],cx
8088aba0 mov     ecx,dword ptr fs:[3Ch]
8088aba7 lea     eax,[ecx+50h]
8088abaa mov     byte ptr [eax+5],89h
8088abae pushfd
8088abaf and     dword ptr [esp],0FFFFBFFFh
8088abb6 popfd
8088abb7 mov     eax,dword ptr fs:[0000003Ch]
8088abbd mov     ch,byte ptr [eax+57h]
8088abc0 mov     cl,byte ptr [eax+54h]
8088abc3 shl     ecx,10h
8088abc6 mov     cx,word ptr [eax+52h]
8088abca mov     eax,dword ptr fs:[00000040h]
8088abd0 mov     dword ptr fs:[40h],ecx

nt!KiTrap08+0x65:
8088abd7 push    0
8088abd9 push    0
8088abdb push    0
8088abdd push    eax
8088abde push    8
8088abe0 push    7Fh
8088abe2 call    nt!KeBugCheck2 (80826a92)
8088abe7 jmp     nt!KiTrap08+0x65 (8088abd7)

We can inspect the TSS address shown in the !pcr command output above:

5: kd> dt _KTSS f774a2e0
   +0×000 Backlink         : 0×28
   +0×002 Reserved0        : 0
   +0×004 Esp0             : 0xf774d3c0
   +0×008 Ss0              : 0×10
   +0×00a Reserved1        : 0
   +0×00c NotUsed1         : [4] 0
   +0×01c CR3              : 0×646000
   +0×020 Eip              : 0×8088ab72
   +0×024 EFlags           : 0
   +0×028 Eax              : 0
   +0×02c Ecx              : 0
   +0×030 Edx              : 0
   +0×034 Ebx              : 0
   +0×038 Esp              : 0xf774d3c0
   +0×03c Ebp              : 0
   +0×040 Esi              : 0
   +0×044 Edi              : 0
   +0×048 Es               : 0×23
   +0×04a Reserved2        : 0
   +0×04c Cs               : 8
   +0×04e Reserved3        : 0
   +0×050 Ss               : 0×10
   +0×052 Reserved4        : 0
   +0×054 Ds               : 0×23
   +0×056 Reserved5        : 0
   +0×058 Fs               : 0×30
   +0×05a Reserved6        : 0
   +0×05c Gs               : 0
   +0×05e Reserved7        : 0
   +0×060 LDT              : 0
   +0×062 Reserved8        : 0
   +0×064 Flags            : 0
   +0×066 IoMapBase        : 0×20ac
   +0×068 IoMaps           : [1] _KiIoAccessMap
   +0×208c IntDirectionMap  : [32]  “???”

We see that EIP points to nt!KiTrap08 and we see that Backlink value is 28 which is the previous TSS selector value that was before the double fault trap:

5: kd> .tss 28
eax=00000020 ebx=8bef5100 ecx=01404800 edx=8bee4aa8 esi=01404400 edi=00000000
eip=80882e4b esp=b044e000 ebp=b044e034 iopl=0 nv up ei ng nz na po nc
cs=0008 ss=0010 ds=0023 es=0023 fs=0030 gs=0000 efl=00010282
nt!_SEH_prolog+0x1b:
80882e4b push    esi

5: kd> k 100
ChildEBP RetAddr
b044e034 f7b840ac nt!_SEH_prolog+0x1b
b044e054 f7b846e6 Ntfs!NtfsMapStream+0x4b
b044e0c8 f7b84045 Ntfs!NtfsReadMftRecord+0x86
b044e100 f7b840f4 Ntfs!NtfsReadFileRecord+0x7a
b044e138 f7b7cdb5 Ntfs!NtfsLookupInFileRecord+0x37
b044e210 f7b6efef Ntfs!NtfsWriteFileSizes+0x76
b044e260 f7b6eead Ntfs!NtfsFlushAndPurgeScb+0xd4
b044e464 f7b7e302 Ntfs!NtfsCommonCleanup+0x1ca8
b044e5d4 8081dce5 Ntfs!NtfsFsdCleanup+0xcf
b044e5e8 f70fac53 nt!IofCallDriver+0x45
b044e610 8081dce5 fltMgr!FltpDispatch+0x6f
b044e624 f420576a nt!IofCallDriver+0x45
b044e634 f4202621 component2!DispatchEx+0xa4
b044e640 8081dce5 component2!Dispatch+0x53
b044e654 f4e998c7 nt!IofCallDriver+0x45
b044e67c f4e9997c component!PassThrough+0xbb
b044e688 8081dce5 component!Dispatch+0x78
b044e69c f41e72ff nt!IofCallDriver+0x45
WARNING: Stack unwind information not available. Following frames may be wrong.
b044e6c0 f41e71ed ofant+0xc2ff
00000000 00000000 ofant+0xc1ed

This is what !analyze -v does for this dump:

STACK_COMMAND:  .tss 0x28 ; kb

In our case NTFS tries to process an exception and SEH exception handler causes double fault when trying to save registers on the stack. Let’s look at the stack trace and crash point. We see that ESP points to the beginning of the valid stack page but the push decrements ESP before memory access and the previous page is clearly invalid:

TSS:  00000028 -- (.tss 28)
eax=00000020 ebx=8bef5100 ecx=01404800 edx=8bee4aa8 esi=01404400 edi=00000000
eip=80882e4b esp=b044e000 ebp=b044e034 iopl=0  nv up ei ng nz na po nc
cs=0008 ss=0010 ds=0023 es=0023 fs=0030 gs=0000 efl=00010282
nt!_SEH_prolog+0×1b:
80882e4b 56              push    esi

5: kd> dd b044e000-4
b044dffc  ???????? 8bef5100 00000000 00000000
b044e00c  00000000 00000000 00000000 00000000
b044e01c  00000000 00000000 b044e0b8 80880c80
b044e02c  808b6426 80801300 b044e054 f7b840ac
b044e03c  8bece5e0 b044e064 00000400 00000001
b044e04c  b044e134 b044e164 b044e0c8 f7b846e6
b044e05c  b044e480 8bee4aa8 01404400 00000000
b044e06c  00000400 b044e134 b044e164 e143db08

5: kd> !pte b044e000-4
               VA b044dffc
PDE at 00000000C0602C10    PTE at 00000000C0582268
contains 000000010AA3C863  contains 0000000000000000
pfn 10aa3c —DA–KWEV
 

WinDbg was unable to get all stack frames and we don’t see big frame values (”Memory” column below):

5: kd> knf 100
  *** Stack trace for last set context - .thread/.cxr resets it
 #   Memory  ChildEBP RetAddr
00           b044e034 f7b840ac nt!_SEH_prolog+0x1b
01        20 b044e054 f7b846e6 Ntfs!NtfsMapStream+0x4b
02        74 b044e0c8 f7b84045 Ntfs!NtfsReadMftRecord+0x86
03        38 b044e100 f7b840f4 Ntfs!NtfsReadFileRecord+0x7a
04        38 b044e138 f7b7cdb5 Ntfs!NtfsLookupInFileRecord+0x37
05        d8 b044e210 f7b6efef Ntfs!NtfsWriteFileSizes+0x76
06        50 b044e260 f7b6eead Ntfs!NtfsFlushAndPurgeScb+0xd4
07       204 b044e464 f7b7e302 Ntfs!NtfsCommonCleanup+0x1ca8
08       170 b044e5d4 8081dce5 Ntfs!NtfsFsdCleanup+0xcf
09        14 b044e5e8 f70fac53 nt!IofCallDriver+0x45
0a        28 b044e610 8081dce5 fltMgr!FltpDispatch+0x6f
0b        14 b044e624 f420576a nt!IofCallDriver+0x45
0c        10 b044e634 f4202621 component2!DispatchEx+0xa4
0d         c b044e640 8081dce5 component2!Dispatch+0x53
0e        14 b044e654 f4e998c7 nt!IofCallDriver+0x45
0f        28 b044e67c f4e9997c component!PassThrough+0xbb
10         c b044e688 8081dce5 component!Dispatch+0x78
11        14 b044e69c f41e72ff nt!IofCallDriver+0x45
WARNING: Stack unwind information not available. Following frames may be wrong.
12        24 b044e6c0 f41e71ed ofant+0xc2ff
13           00000000 00000000 ofant+0xc1ed

To see all components involved we need to dump raw stack data (12Kb is 0×3000). There we can also see some software exceptions processed and get some partial stack traces for them. Some caution is required because stack traces might be incomplete and misleading due to overwritten stack data.

5: kd> dds b044e000 b044e000+3000


b044ebc4  b044ec74
b044ebc8  b044ec50
b044ebcc  f41f9458 ofant+0x1e458
b044ebd0  b044f140
b044ebd4  b044ef44
b044ebd8  b044f138
b044ebdc  80877290 nt!RtlDispatchException+0x8c
b044ebe0  b044ef44
b044ebe4  b044f138
b044ebe8  b044ec74
b044ebec  b044ec50
b044ebf0  f41f9458 ofant+0x1e458
b044ebf4  8a7668c0
b044ebf8  e16c2e80
b044ebfc  00000000
b044ec00  00000000
b044ec04  00000002
b044ec08  01000000
b044ec0c  00000000
b044ec10  00000000
...
...
...
b044ec60  00000000
b044ec64  b044ef94
b044ec68  8088e13f nt!RtlRaiseStatus+0x47
b044ec6c  b044ef44
b044ec70  b044ec74

b044ec74  00010007


b0450fe8  00000000
b0450fec  00000000
b0450ff0  00000000
b0450ff4  00000000
b0450ff8  00000000
b0450ffc  00000000
b0451000  ????????

5: kd> .exr b044ef44
ExceptionAddress: f41dde6d (ofant+0x00002e6d)
   ExceptionCode: c0000043
  ExceptionFlags: 00000001
NumberParameters: 0

5: kd> .cxr b044ec74
eax=c0000043 ebx=00000000 ecx=89fe1bc0 edx=b044f084 esi=e16c2e80 edi=8a7668c0
eip=f41dde6d esp=b044efa0 ebp=b044f010 iopl=0 nv up ei pl zr na pe nc
cs=0008 ss=0010 ds=0023 es=0023 fs=0030 gs=0000 efl=00000246
ofant+0x2e6d:
f41dde6d e92f010000      jmp     ofant+0x2fa1 (f41ddfa1)

5: kd> knf
  *** Stack trace for last set context - .thread/.cxr resets it
 #   Memory  ChildEBP RetAddr
WARNING: Stack unwind information not available. Following frames may be wrong.
00           b044f010 f41ddce6 ofant+0x2e6d
01        b0 b044f0c0 f41dd930 ofant+0x2ce6
02        38 b044f0f8 f41e88eb ofant+0x2930
03        2c b044f124 f6598eba ofant+0xd8eb
04        24 b044f148 f41dcd40 SYMEVENT!SYMEvent_AllocVMData+0x84da
05        18 b044f160 8081dce5 ofant+0x1d40
06        14 b044f174 f6596741 nt!IofCallDriver+0x45
07        28 b044f19c f659dd70 SYMEVENT!SYMEvent_AllocVMData+0x5d61
08        1c b044f1b8 f65967b9 SYMEVENT!EventObjectCreate+0xa60
09        40 b044f1f8 8081dce5 SYMEVENT!SYMEvent_AllocVMData+0x5dd9
0a        14 b044f20c 808f8255 nt!IofCallDriver+0x45
0b        e8 b044f2f4 80936af5 nt!IopParseDevice+0xa35
0c        80 b044f374 80932de6 nt!ObpLookupObjectName+0x5a9
0d        54 b044f3c8 808ea211 nt!ObOpenObjectByName+0xea
0e        7c b044f444 808eb4ab nt!IopCreateFile+0x447
0f        5c b044f4a0 808edf2a nt!IoCreateFile+0xa3
10        40 b044f4e0 80888c6c nt!NtCreateFile+0x30
11         0 b044f4e0 8082e105 nt!KiFastCallEntry+0xfc
12        a4 b044f584 f657f20d nt!ZwCreateFile+0x11
13        54 b044f5d8 f65570f6 NAVAP+0x2e20d

Therefore, the following components found on raw stack look suspicious:

ofant.sys, SYMEVENT.SYS and NAVAP.sys.

We should check their timestamps using lmv command and contact their vendors for any existing updates. The workaround would be to remove those products. The rest are Microsoft modules and drivers component.sys and component2.sys.

For the latter two we don’t have significant local variable usage in their functions.

OSR NT Insider article provides another example:

http://www.osronline.com/article.cfm?article=254

The following Citrix article provides an example of stack overflow in ICA protocol stack:

http://support.citrix.com/article/CTX106209 

- Dmitry Vostokov @ DumpAnalysis.org -

Crash Dump Analysis Checklist

June 20th, 2007

Sometimes the root cause of a problem is not obvious from a memory dump. Here is the first version of crash dump analysis checklist to help experienced engineers not to miss any important information. The check list doesn’t prescribe any specific steps, just lists all possible points to double check when looking at a memory dump. Of course, it is not complete at the moment and any suggestions are welcome.

General:

  • Symbol servers (.symfix)
  • Internal database(s) search
  • Google or Microsoft search for suspected components as this could be a known issue. Sometimes a simple search immediately points to the fix on a vendor’s site
  • The tool used to save a dump (to flag false positive, incomplete or inconsistent dumps)
  • OS/SP version (version)
  • Language
  • Debug time
  • System uptime
  • Computer name (dS srv!srvcomputername or !envvar COMPUTERNAME)
  • List of loaded and unloaded modules (lmv or !dlls)
  • Hardware configuration (!sysinfo)
  • .kframes 1000

Application or service:

  • Default analysis (!analyze -v or !analyze -v -hang for hangs)
  • Critical sections (!cs -s -l -o, !locks) for both crashes and hangs
  • Component timestamps, duplication and paths. DLL Hell? (lmv and !dlls)
  • Do any newer components exist?
  • Process threads (~*kv or !uniqstack) for multiple exceptions and blocking functions
  • Process uptime
  • Your components on the full raw stack of the problem thread
  • Your components on the full raw stack of the main application thread
  • Process size
  • Number of threads
  • Gflags value (!gflag)
  • Time consumed by threads (!runaway)
  • Environment (!peb)
  • Import table (!dh)
  • Hooked functions (!chkimg)
  • Exception handlers (!exchain)
  • Computer name (!envvar COMPUTERNAME)
  • Process heap stats and validation (!heap -s, !heap -s -v)
  • CLR threads? (mscorwks or clr modules on stack traces) Yes: use .NET checklist below
  • Hidden (unhandled and handled) exceptions on thread raw stacks

System hang:

  • Default analysis (!analyze -v -hang)
  • ERESOURCE contention (!locks)
  • Processes and virtual memory including session space (!vm 4)
  • Important services are present and not hanging
  • Pools (!poolused)
  • Waiting threads (!stacks)
  • Critical system queues (!exqueue f)
  • I/O (!irpfind)
  • The list of all thread stack traces (!process 0 3f)
  • LPC/ALPC chain for suspected threads (!lpc message or !alpc /m after search for “Waiting for reply to LPC” or “Waiting for reply to ALPC” in !process 0 3f output)
  • RPC threads (search for “RPCRT4!OSF” in !process 0 3f output)
  • Mutants (search for “Mutants - owning thread” in !process 0 3f output)
  • Critical sections for suspected processes (!cs -l -o -s)
  • Sessions, session processes (!session, !sprocess)
  • Processes (size, handle table size) (!process 0 0)
  • Running threads (!running)
  • Ready threads (!ready)
  • DPC queues (!dpcs)
  • The list of APCs (!apc)
  • Internal queued spinlocks (!qlocks)
  • Computer name (dS srv!srvcomputername)
  • File cache, VACB (!filecache)
  • File objects for blocked thread IRPs (!irp -> !fileobj)
  • Network (!ndiskd.miniports and !ndiskd.pktpools)
  • Disk (!scsikd.classext -> !scsikd.classext class_device 2)
  • Modules rdbss, mrxdav, mup, mrxsmb in stack traces
  • Functions Ntfs!Ntfs*, nt!Fs* and fltmgr!Flt* in stack traces

BSOD:

  • Default analysis (!analyze -v)
  • Pool address (!pool)
  • Component timestamps (lmv)
  • Processes and virtual memory (!vm 4)
  • Current threads on other processors
  • Raw stack
  • Bugcheck description (including ln exception address for corrupt or truncated dumps)
  • Bugcheck callback data (!bugdump for systems prior to Windows XP SP1)
  • Bugcheck secondary callback data (.enumtag)
  • Computer name (dS srv!srvcomputername)
  • Hardware configuration (!sysinfo)

.NET application or service:

  • CLR module and SOS extension versions (lmv and .chain)
  • Managed exceptions (~*e !pe)
  • Nested managed exceptions (!pe -nested)
  • Managed threads (!Threads -special)
  • Managed stack traces (~*e !CLRStack)
  • Managed execution residue (~*e !DumpStackObjects and !DumpRuntimeTypes)
  • Managed heap (!VerifyHeap, !DumpHeap -stat and !eeheap -gc)
  • GC handles (!GCHandles, !GCHandleLeaks)
  • Finalizer queue (!FinalizeQueue)
  • Sync blocks (!syncblk)

- Dmitry Vostokov @ DumpAnalysis.org + TraceAnalysis.org -

Crash Dump Analysis Patterns (Part 15)

May 24th, 2007

Sometimes when we look at the list of loaded modules in a process address space we see an instance of the pattern that I call Module Variety. It means, literally, that there are so many different loaded modules that we start thinking that their coexistence created the problem. We can also call this pattern Component Variety or DLL Variety but I prefer the former because WinDbg refers to loaded executables, dlls, drivers, ActiveX controls, etc. as modules.

Modules can be roughly classified into 4 broad categories:

  • Application modules - components that were developed specifically for this application, one of them is the main application module

  • 3rd-party modules - you can easily identify them if the company name is the same in the output of lmv WinDbg command

  • Common system modules - Windows dlls supplied by OS implementing native OS calls, Windows API and also C/C++ runtime functions, for example, ntdll.dll, kernel32.dll, user32.dll, gdi32.dll, advapi32.dll, msvcrt.dll, etc.

  • Specific system modules - optional Windows dlls supplied by Microsoft that are specific to the application functionality and implementation, like MFC dlls, .NET runtime or tapi32.dll

Although lmv is verbose for quick check of component timestamps you can use lmt WinDbg command. Here is an example of the great module variety:

Loading Dump File [application.dmp] ... ... ... Windows Server 2003 Version 3790 (Service Pack 1) ... ... ... 0:001> lmt start end module name 00400000 030ba000 app_main Mon Dec 04 21:22:42 2006 04120000 04193000 Dformd Mon Jan 31 02:27:58 2000 041a0000 04382000 sqllib2 Mon May 29 22:50:11 2006 04490000 044d3000 udNet Mon May 29 23:22:43 2006 04e30000 04f10000 abchook Wed Aug 01 20:47:17 2006 05e10000 05e15000 token_manager Fri Mar 12 11:54:17 1999 06030000 06044000 ODBCINT Thu Mar 24 22:59:58 2005 06150000 0618d000 sgl5NET Mon May 29 23:25:22 2006 06190000 0622f000 OPENGL32 Mon Nov 06 21:30:52 2006 06230000 06240000 pwrpc32 Thu Oct 22 16:22:40 1998 06240000 07411000 app_dll_1 Tue Aug 08 12:14:39 2006 07420000 07633000 app_dll_2 Mon Dec 04 22:11:59 2006 07640000 07652000 zlib Fri Aug 30 08:12:24 2002 07660000 07f23000 app_dll_3 Wed Oct 19 11:43:34 2005 0dec0000 0dedc000 app_dll_4 Mon Dec 04 22:11:36 2006 10000000 110be000 des Tue Jul 18 20:42:02 2006 129c0000 12f1b000 xpsp2res Fri Mar 25 00:26:47 2005 1b000000 1b170000 msjet40 Tue Jul 06 19:16:05 2004 1b2c0000 1b2cd000 msjter40 Thu May 09 19:09:53 2002 1b2d0000 1b2ea000 msjint40 Thu May 09 19:09:53 2002 1b570000 1b5c5000 msjetoledb40 Thu Nov 13 23:40:06 2003 1b5d0000 1b665000 mswstr10 Thu May 09 19:09:56 2002 1e000000 1e0f0000 python23 Fri Jan 30 13:03:24 2004 4b070000 4b0c1000 MSCTF Fri Mar 25 02:10:36 2005 4b610000 4b64d000 ODBC32 Fri Mar 25 02:09:33 2005 4b9e0000 4ba59000 OLEDB32 Fri Mar 25 02:09:56 2005 4c310000 4c31d000 OLEDB32R Fri Mar 25 02:09:57 2005 4c3b0000 4c3de000 MSCTFIME Fri Mar 25 02:10:37 2005 5f400000 5f4f2000 mfc42 Wed Oct 27 22:35:22 1999 62130000 6213d000 mfc42loc Wed Mar 26 03:35:58 2003 62460000 6246e000 msadrh15 Fri Mar 25 02:10:29 2005 63050000 63059000 lpk Fri Mar 25 02:09:21 2005 63270000 632c7000 hnetcfg Fri Mar 25 02:09:11 2005 65340000 653d2000 OLEAUT32 Wed Sep 01 00:15:11 1999 68000000 6802f000 rsaenh Fri Mar 25 00:30:55 2005 68a50000 68a70000 glu32 Fri Mar 25 02:09:03 2005 71990000 71998000 wshtcpip Wed Mar 26 03:34:24 2003 719d0000 71a11000 mswsock Fri Mar 25 02:12:06 2005 71a60000 71a6b000 wsock32 Wed Mar 26 03:34:24 2003 71a80000 71a91000 mpr Wed Mar 26 03:34:24 2003 71aa0000 71aa8000 ws2help Fri Mar 25 02:10:19 2005 71ab0000 71ac7000 ws2_32 Fri Mar 25 02:10:18 2005 71ad0000 71ae2000 tsappcmp Fri Mar 25 02:09:56 2005 71af0000 71b48000 netapi32 Fri Aug 11 11:00:07 2006 72ec0000 72ee7000 winspool Fri Mar 25 02:09:48 2005 73290000 73295000 riched32 Wed Mar 26 03:34:14 2003 73ee0000 73ee5000 icmp Wed Mar 26 03:34:09 2003 74920000 7493a000 msdart Fri Mar 25 02:10:48 2005 74b10000 74b80000 riched20 Fri Mar 25 02:09:36 2005 75220000 75281000 usp10 Fri Mar 25 02:09:51 2005 75810000 758d0000 userenv Fri Mar 25 02:09:50 2005 75d00000 75d27000 apphelp Fri Mar 25 02:09:21 2005 76120000 7613d000 imm32 Fri Mar 25 02:09:37 2005 76140000 76188000 comdlg32 Fri Mar 25 02:10:11 2005 76810000 76949000 comsvcs Fri Aug 26 23:19:45 2005 76a60000 76a6b000 psapi Fri Mar 25 02:09:57 2005 76c00000 76c1a000 iphlpapi Fri May 19 04:21:07 2006 76de0000 76e0f000 dnsapi Wed Jul 12 20:02:12 2006 76e20000 76e4e000 wldap32 Fri Mar 25 02:09:59 2005 76e60000 76e73000 secur32 Fri Mar 25 02:10:01 2005 76e80000 76e87000 winrnr Fri Mar 25 02:09:45 2005 76e90000 76e98000 rasadhlp Wed Jul 12 20:02:15 2006 76f20000 77087000 comres Wed Mar 26 03:33:48 2003 77330000 773c7000 comctl32 Mon Aug 28 09:26:02 2006 77470000 775a4000 ole32 Thu Jul 21 04:25:12 2005 77640000 776c3000 clbcatq Thu Jul 21 04:25:13 2005 77b30000 77b38000 version Fri Mar 25 02:09:50 2005 77b40000 77b9a000 msvcrt Fri Mar 25 02:11:59 2005 77ba0000 77be8000 gdi32 Tue Mar 07 03:55:05 2006 77bf0000 77c8f000 rpcrt4 Fri Mar 25 02:09:42 2005 77ca0000 77da3000 comctl32_77ca0000 Mon Aug 28 09:25:59 2006 77db0000 77dc1000 winsta Fri Mar 25 02:09:51 2005 77de0000 77e71000 user32 Fri Mar 25 02:09:49 2005 77e80000 77ed2000 shlwapi Wed Sep 20 01:33:12 2006 77ee0000 77ef1000 regapi Fri Mar 25 02:09:51 2005 77f20000 77fcb000 advapi32 Fri Mar 25 02:09:06 2005 780a0000 780b2000 MSVCIRT Wed Jun 17 19:45:46 1998 780c0000 78121000 MSVCP60 Wed Jun 17 19:52:10 1998 79040000 79085000 fusion Fri Feb 18 20:57:41 2005 79170000 79198000 mscoree Fri Feb 18 20:57:48 2005 791b0000 79417000 mscorwks Fri Feb 18 20:59:56 2005 79510000 79523000 mscorsn Fri Feb 18 20:30:38 2005 79780000 7998c000 mscorlib Fri Feb 18 20:48:36 2005 79990000 79cce000 mscorlib_79990000 Thu Nov 02 04:53:27 2006 7c340000 7c396000 msvcr71 Fri Feb 21 12:42:20 2003 7c800000 7c93e000 kernel32 Tue Jul 25 13:37:16 2006 7c940000 7ca19000 ntdll Fri Mar 25 02:09:53 2005 7ca20000 7d20a000 shell32 Thu Jul 13 13:58:56 2006

Note: you can use lmtD command to take the advantage of WinDbg hypertext commands. In that case you can quickly click on a module name to view its detailed information.

We see that some components are very old, 1998-1999, and some are from 2006. We also see 3rd-party libraries: OpenGL, Visual Fortran RTL, Python language runtime. Common system modules include two versions of C/C++ runtime library, 6.0 and 7.0. Specific system modules include MFC and .NET, MSJET, ODBC and OLE DB support. There is a sign of DLL Hell here too. OLE Automation DLL in system32 folder seems to be very old and doesn’t correspond to Windows 2003 SP1 which should have file version 5.2.3790.1830:

0:001> lmv m OLEAUT32 start end module name 65340000 653d2000 OLEAUT32 (deferred) Image path: C:\WINDOWS\system32\OLEAUT32.DLL Image name: OLEAUT32.DLL Timestamp: Wed Sep 01 00:15:11 1999 (37CC61FF) CheckSum: 0009475A ImageSize: 00092000 File version: 2.40.4277.1 Product version: 2.40.4277.1 File flags: 2 (Mask 3F) Pre-release File OS: 40004 NT Win32 File type: 2.0 Dll File date: 00000000.00000000 Translations: 0409.04e4 CompanyName: Microsoft Corporation ProductName: Microsoft OLE 2.40 for Windows NT(TM) and Windows 95(TM) Operating Systems InternalName: OLEAUT32.DLL ProductVersion: 2.40.4277 FileVersion: 2.40.4277 FileDescription: Microsoft OLE 2.40 for Windows NT(TM) and Windows 95(TM) Operating Systems LegalCopyright: Copyright © Microsoft Corp. 1993-1998. LegalTrademarks: Microsoft® is a registered trademark of Microsoft Corporation. Windows NT(TM) and Windows 95(TM) are trademarks of Microsoft Corporation. Comments: Microsoft OLE 2.40 for Windows NT(TM) and Windows 95(TM) Operating Systems

- Dmitry Vostokov @ DumpAnalysis.org -

ASLR: Address Space Layout Randomization

May 22nd, 2007

From Writing Secure Code for Windows Vista book written by Michael Howard and David LeBlanc I learnt that Vista has the new ASLR feature:

  • Load address randomization (/dynamicbase linker option)
  • Stack address randomization (/dynamicbase linker option)
  • Heap randomization

The first randomization changes addresses across Vista reboots. The second randomization happens every time you launch an application linked with /dynamicbase option. The third randomization happens every time you launch an application linked with or without /dynamicbase option as we will see below.

The book shows some source code that prints addresses of various modules, functions and local parameters to show the feature. I decided to check that using more direct route by attaching WinDbg to calc, notepad and pre-Vista application TestDefaultDebugger. Obviously native Vista applications use ASLR.

Comparison between two calc.exe processes inspected separately before and after reboot shows that the main module and system dlls have different load addresses:

0:000> lm start end module name 009f0000 00a1e000 calc 74710000 748a4000 comctl32 75b10000 75bba000 msvcrt … … … 76f00000 76fbf000 ADVAPI32 770d0000 771a8000 kernel32 771b0000 7724e000 USER32 77250000 7736e000 ntdll

0:000> lm start end module name 00470000 0049e000 calc … … … 743e0000 74574000 comctl32 … 75730000 757da000 msvcrt 757e0000 7589f000 ADVAPI32 … 75e20000 75ebe000 USER32 … 76cf0000 76dc8000 kernel32 76dd0000 76eee000 ntdll …

Main module address has different 3rd byte across reboots. I don’t believe that 0×00 is allowed because then we would have 0×00000000 load address. Therefore we have 255 unique load addresses chosen randomly.

Stack addresses are different:

0:000> k
ChildEBP RetAddr
000ffc8c 771d199a ntdll!KiFastSystemCallRet
000ffc90 771d19cd USER32!NtUserGetMessage+0xc
000ffcac 009f24e8 USER32!GetMessageW+0×33
000ffd08 00a02588 calc!WinMain+0×278
000ffd98 77113833 calc!_initterm_e+0×1a1
000ffda4 7728a9bd kernel32!BaseThreadInitThunk+0xe
000ffde4 00000000 ntdll!_RtlUserThreadStart+0×23

0:000> k
ChildEBP RetAddr
0007fbe4 75e4199a ntdll!KiFastSystemCallRet
0007fbe8 75e419cd USER32!NtUserGetMessage+0xc
0007fc04 004724e8 USER32!GetMessageW+0×33
0007fc60 00482588 calc!WinMain+0×278
0007fcf0 76d33833 calc!_initterm_e+0×1a1
0007fcfc 76e0a9bd kernel32!BaseThreadInitThunk+0xe
0007fd3c 00000000 ntdll!_RtlUserThreadStart+0×23

Because module base addresses are different return addresses on call stacks are different too.

Heap base addresses are different:

0:000> !heap
Index Address
1: 00120000
2: 00010000
3: 00760000
4: 00990000
5: 00700000
6: 00670000
7: 01320000

0:000> !heap
Index Address
1: 001b0000
2: 00010000
3: 00a00000
4: 009c0000
5: 00400000
6: 00900000
7: 01260000

PEB and environment addresses are different:

notepad.exe (PID 1248):

0:000> !peb
PEB at 7ffd4000
...
Environment: 000507e8

notepad.exe (PID 1370):

0:000> !peb
PEB at 7ffd9000
...
Environment: 003a07e8

If we look inside TEB we would see that pointers to exception handler list are different and stack bases are different too:

notepad.exe (PID 1248):

TEB at 7ffdf000 ExceptionList: 0023ff34   StackBase: 00240000   StackLimit: 0022f000   SubSystemTib: 00000000   FiberData: 00001e00   ArbitraryUserPointer: 00000000   Self: 7ffdf000   EnvironmentPointer: 00000000   ClientId: 00001248 . 000004e0   RpcHandle: 00000000   Tls Storage: 7ffdf02c   PEB Address: 7ffd4000   LastErrorValue: 0   LastStatusValue: c0000034   Count Owned Locks: 0   HardErrorMode: 0

notepad.exe (PID 1370):

0:000> !teb TEB at 7ffdf000 ExceptionList: 001ffa00   StackBase: 00200000   StackLimit: 001ef000   SubSystemTib: 00000000   FiberData: 00001e00   ArbitraryUserPointer: 00000000   Self: 7ffdf000   EnvironmentPointer: 00000000   ClientId: 00001370 . 00001454   RpcHandle: 00000000   Tls Storage: 7ffdf02c   PEB Address: 7ffd9000   LastErrorValue: 5   LastStatusValue: c0000008   Count Owned Locks: 0   HardErrorMode: 0

However if we look at old applications that weren’t linked with /dynamicbase option we would see that the main module and old dll base addresses are the same:

0:000> lm
start end module name
00400000 00435000 TestDefaultDebugger
20000000 2000d000 LvHook

To summarize different alternatives I created the following table where

“New” column - processes linked with /dynamicbase option, no reboot
“New/Reboot” column - processes linked with /dynamicbase option, reboot
“Old” column - old processes, no reboot
“Old/Reboot” column - old processes, reboot

Randomization   | New/Reboot | New | Old/Reboot | Old
------------------------------------------------------
Module          |      +     |  -  |      -     |  -
------------------------------------------------------
System DLLs     |      +     |  -  |      +     |  -
------------------------------------------------------
Stack           |      +     |  +  |      -     |  -
------------------------------------------------------
Heap            |      +     |  +  |      +     |  +
------------------------------------------------------
PEB             |      +     |  +  |      +     |  +
------------------------------------------------------
Environment     |      +     |  +  |      +     |  +
------------------------------------------------------
ExceptionList   |      +     |  +  |      -     |  -

From PEB and process heap base addresses we can see that environment addresses are always correlated with the heap:

0:000> !heap Index Address Name Debugging options enabled   1: 005f0000

0:000> !peb PEB at 7ffd7000 ... ... ...   ProcessHeap: 005f0000   ProcessParameters: 005f1540   Environment: 005f07e8

I think the reason why Microsoft didn’t enable ASLR by default is to prevent Changed Environment pattern from appearing.

- Dmitry Vostokov -

Where did the crash dump come from?

May 22nd, 2007

This is the basic check and very useful if your customer complains that the fix you sent yesterday doesn’t work. Check the computer name from the dump. It could be the case that your fix wasn’t applied to all computers. Here is a short summary for different dump types:

1. Complete/kernel memory dumps: dS srv!srvcomputername

1: kd> dS srv!srvcomputername
e17c9078 "COMPUTER-NAME"

2. User dumps: !peb and the subsequent search inside the environment variables

0:000> !peb
PEB at 7ffde000
...
...
...
Environment: 0x10000
...
0:000> s-su 0x10000 0x20000
...
...
000123b2 "COMPUTERNAME=COMPUTER-NAME"
...
...

dS command shown above interpret the address as a pointer to UNICODE_STRING structure widely used inside the Windows kernel space

1: kd> dt _UNICODE_STRING
+0x000 Length : Uint2B
+0x002 MaximumLength : Uint2B
+0x004 Buffer : Ptr32 Uint2B

DDK definition:

typedef struct _UNICODE_STRING {
USHORT Length;
USHORT MaximumLength;
PWSTR Buffer;
} UNICODE_STRING *PUNICODE_STRING;

Let’s dd the name:

1: kd> dd srv!srvcomputername l2
f5e8d1a0 0022001a e17c9078

Such combination of short integers following by an address is usually an indication that you have a UNICODE_STRING structure:

1: kd> du e17c9078
e17c9078 "COMPUTER-NAME   "

We can double-check it with dt command:

1: kd> dt _UNICODE_STRING f5e8d1a0
"COMPUTER-NAME"
+0x000 Length : 0x1a
+0x002 MaximumLength : 0x22
+0x004 Buffer : 0xe17c9078 "COMPUTER-NAME"

- Dmitry Vostokov -

Custom postmortem debuggers on Vista

May 20th, 2007

Motivated by the previous post I decided to try better alternatives because on new Vista installation you don’t have either drwtsn32.exe or NTSD.

Any application that can attach to a process based on its PID and save its memory state in a dump will do. The first obvious candidate is userdump.exe which actually can setup itself in the registry properly. Here is the detailed instruction. If you already have the latest version of userdump.exe you can skip the first two steps:

1. Download the latest User Mode Process Dumper from Microsoft. At the time of this writing it has version 8.1

2. Run the downloaded executable file and it will prompt to unzip. By default the current version unzips to c:\kktools\userdump8.1. Do not run setup afterwards because it is not needed for our purposes.

3. Create kktools folder in system32 folder

4. Create the folder where userdump will save your dumps; I use c:\UserDumps in my example

5. Copy dbghelp.dll and userdump.exe from x86 or x64 folder depending on the version of Windows you use to system32\kktools folder you created in step 3.

6. Run the elevated command prompt and enter the following command:

C:\Windows\System32\kktools>userdump -I -d c:\UserDumps
User Mode Process Dumper (Version 8.1.2929.5)
Copyright (c) Microsoft Corp. All rights reserved.
Userdump set up Aedebug registry key.

7. Check the following registry key:

HKEY_LOCAL_MACHINE\SOFTWARE\Microsoft\Windows NT\CurrentVersion\AeDebug
Debugger=C:\Windows\system32\kktools\userdump -E %ld %ld -D c:\UserDumps\
Auto=0

You can set Auto to 1 if you want to see the following dialog every time you have a crash:

8. Test the new settings by using TestDefaultDebugger

9. When you have a crash userdump.exe will show a window on top of your screen while saving the dump file:

Of course, you can setup userdump.exe as the postmortem debugger on other Windows platforms. The problem with userdump.exe is that it overwrites the previous process dump because it uses the module name for the dump file name, for example, TestDefaultDebugger.dmp, so you need to rename or save the dump if you have multiple crashes for the same application.

Other programs can be setup instead of userdump.exe. One of them is WinDbg. Here is the article I wrote about WinDbg so I won’t repeat its content here, except the registry key I tested on Vista:

HKEY_LOCAL_MACHINE\SOFTWARE\Microsoft\Windows NT\CurrentVersion\AeDebug
Debugger="C:\Program Files\Debugging Tools for Windows\windbg.exe" -p %ld -e %ld -g -c '.dump /o /ma /u c:\UserDumps\new.dmp; q' -Q -QS -QY -QSY

Finally you can use command line CDB user mode debugger from Debugging Tools for Windows. Here is the registry key:

HKEY_LOCAL_MACHINE\SOFTWARE\Microsoft\Windows NT\CurrentVersion\AeDebug
Debugger="C:\Program Files\Debugging Tools for Windows\cdb.exe" -p %ld -e %ld -g -c ".dump /o /ma /u c:\UserDumps\new.dmp; q"

When you have a crash cdb.exe will be launched and the following console window will appear:

The advantage of using CDB or WinDbg is that you can omit q from the -c command line option and leave your debugger window open for further process inspection.

- Dmitry Vostokov -