Resurrecting Dr. Watson on Vista
Feeling nostalgic about pre-Vista times I recalled that one month before upgrading my Windows XP to Vista I saved the copy of Dr. Watson (drwtsn32.exe). Of course, during upgrade, drwtsn32.exe was removed from system32 folder. Now I copied it back and set it as the default postmortem debugger from the elevated command prompt:
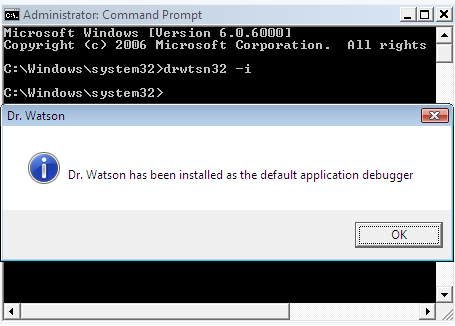
When I looked at the registry I found the correctly set key values:
HKEY_LOCAL_MACHINE\SOFTWARE\Microsoft\Windows NT\CurrentVersion\AeDebug

Debugger=drwtsn32 -p %ld -e %ld -g

Auto=1
Auto=1 means do not show the error message box, just go ahead and dump the process. Actually with Auto=0 Dr. Watson doesn’t work on my Vista.
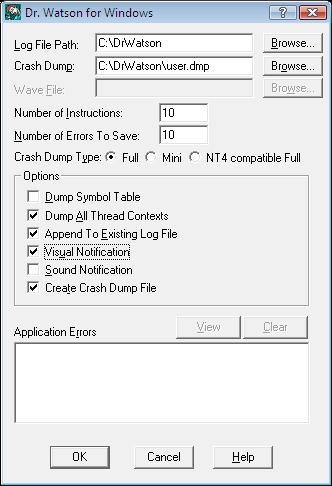
Also I configured Dr. Watson to store the log and full user dump in c:\DrWatson folder by running drwtsn32.exe from the same elevated command prompt:
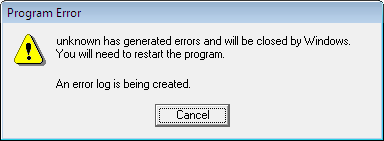
Next I launched TestDefaultDebugger and hit the big crash button. Access violation happened and I saw familiar “Program Error” message box:
The log was created and the user dump was saved in the specified folder. All subsequent crashes were appended to the log and user.dmp was updated. When I opened the dump in WinDbg I got the following output:
Loading Dump File [C:DrWatsonuser.dmp]

User Mini Dump File with Full Memory: Only application data is available

Comment: ‘Dr. Watson generated MiniDump’

Symbol search path is: SRV*c:\websymbols*http://msdl.microsoft.com/download/symbols

Executable search path is:

Windows Vista Version 6000 UP Free x86 compatible

Product: WinNt, suite: SingleUserTS

Debug session time: Sat May 19 20:52:23.000 2007 (GMT+1)

System Uptime: 5 days 20:00:04.062

Process Uptime: 0 days 0:00:03.000

This dump file has an exception of interest stored in it.

The stored exception information can be accessed via .ecxr.

(1f70.1e0c): Access violation - code c0000005 (first/second chance not available)

eax=00000000 ebx=00000001 ecx=0012fe70 edx=00000000 esi=00425ae8 edi=0012fe70

eip=004014f0 esp=0012f8a8 ebp=0012f8b4 iopl=0 nv up ei ng nz ac pe cy

cs=001b ss=0023 ds=0023 es=0023 fs=003b gs=0000 efl=00010297

TestDefaultDebugger!CTestDefaultDebuggerDlg::OnBnClickedButton1:

004014f0 c7050000000000000000 mov dword ptr ds:[0],0 ds:0023:00000000=???????
Therefore I believe that if I saved ntsd.exe before upgrading to Vista I would have been able to set it as a default postmortem debugger too.
- Dmitry Vostokov -
June 14th, 2007 at 1:57 pm
Where do you put the string “Debugger=drwtsn32 -p %ld -e %ld -g”?
June 20th, 2007 at 8:37 am
Under
HKEY_LOCAL_MACHINE\SOFTWARE\Microsoft\Windows NT\CurrentVersion\AeDebug
registry key
July 23rd, 2007 at 8:37 am
Hi Dmitry,
I am not able to exactly understand what this one means:
“SRV*c:websymbols*http://msdl.microsoft.com/download/symbols;c:”
Does it mean download from symbols MS and store it in c:\websymbols and c:\ ? And why there is no “\” in “c:websymbols” ?
Thanks
July 23rd, 2007 at 3:24 pm
This means that WinDbg will download symbols from MS symbol server automatically. It will store them in c:\websymbols. There is no “\” in “c:websymbols” because I forgot to add one… The second “c:” is left from some debugging session in the past where I put one symbol file on C:\. Forgot to remove it I corrected the post.
July 23rd, 2007 at 3:28 pm
Comment to my post:
> Therefore I believe that if I saved ntsd.exe before upgrading to Vista…
Actually NTSD is available if you install the latest Debugging Tools for Windows
November 2nd, 2007 at 11:18 am
Hello Dmitry,
I’m still having problems getting dr. watson to work on vista, I’m not sure if I setup the registry correctly. I Created a variable called Debuger, set it equal to the directory of dr.watson, then made an auto variable, set it’s value to one, after all that, ran a crash test, but still no luck. Could you possibly post a snapshot of your debug registry?
November 2nd, 2007 at 12:49 pm
I’ll check later today but in the mean time could you please check whether you configured crash dump folder in Dr. Watson? The default Dr. Watson folder might not exist on Vista or may have different permissions
Thanks,
Dmitry
January 27th, 2010 at 12:49 am
[…] failed, 0×80070026 memory analysis intelligence minidump analyzer dxg.sys crash dump vista dr watson vista calling+kernel+functions+from+userspace crash dump analyzer how to open corrupt memory dump […]