Crash Dump Analysis Patterns (Part 23a)

August 19th, 2007

Double-free bugs lead to Dynamic Memory Corruption. The reason why Double Free deserves its own pattern name is the fact that either debug runtime libraries or even OS itself detect such bugs and save crash dumps immediately.

For some heap implementations double free doesn’t lead to an immediate heap corruption and subsequent crash. For example, if you allocate 3 blocks in a row and then free the middle one twice there will be no crash as the second free call is able to detect that the block was already freed and does nothing. The following program loops forever and never crashes:

#include "stdafx.h"
#include <windows.h>

int _tmain(int argc, _TCHAR* argv[])
{
  while (true)
  {
    puts("Allocate: p1");
    void *p1 = malloc(100);
    puts("Allocate: p2");
    void *p2 = malloc(100);
    puts("Allocate: p3");
    void *p3 = malloc(100);

    puts("Free: p2");
    free(p2);
    puts(”Double-Free: p2″);
    free(p2);

    puts(”Free: p1″);
    free(p1);
    puts(”Free: p3″);
    free(p3);

    Sleep(100);
  }

  return 0;
}

The output of the program: 

...
...
...
Allocate: p1
Allocate: p2
Allocate: p3
Free: p2
Double-Free: p2
Free: p1
Free: p3
Allocate: p1
Allocate: p2
Allocate: p3
Free: p2
Double-Free: p2
Free: p1
Free: p3
Allocate: p1
Allocate: p2
Allocate: p3
Free: p2
Double-Free: p2
...
...
...

However if a free call triggered heap coalescence (adjacent free blocks form the bigger free block) then we have a heap corruption crash on the next double-free call because the coalescence triggered by the previous free call erased free block information:

#include "stdafx.h"
#include <windows.h>

int _tmain(int argc, _TCHAR* argv[])
{
  while (true)
  {
    puts("Allocate: p1");
    void *p1 = malloc(100);
    puts("Allocate: p2");
    void *p2 = malloc(100);
    puts("Allocate: p3");
    void *p3 = malloc(100);

    puts("Free: p3");
    free(p3);
    puts("Free: p1");
    free(p1);
    puts("Free: p2");
    free(p2);
    puts(”Double-Free: p2″);
    free(p2);

    Sleep(100);
  }

  return 0;
}

The output of the program:

Allocate: p1
Allocate: p2
Allocate: p3
Free: p3
Free: p1
Free: p2
Double-Free: p2
Crash!

If we open a crash dump we would see the following stack trace:

0:000> r
eax=00922130 ebx=00920000 ecx=10101010 edx=10101010 esi=00922128 edi=00921fc8
eip=76ee1ad5 esp=0012fd6c ebp=0012fd94 iopl=0 nv up ei pl zr na pe nc
cs=001b ss=0023 ds=0023 es=0023 fs=003b gs=0000 efl=00010246
ntdll!RtlpCoalesceFreeBlocks+0x6ef:
76ee1ad5 8b4904          mov     ecx,dword ptr [ecx+4] ds:0023:10101014=????????

0:000> kL
ChildEBP RetAddr
0012fd94 76ee1d37 ntdll!RtlpCoalesceFreeBlocks+0x6ef
0012fe8c 76ee1c21 ntdll!RtlpFreeHeap+0x1e2
0012fea8 758d7a7e ntdll!RtlFreeHeap+0x14e
0012febc 6cff4c39 kernel32!HeapFree+0x14
0012ff08 0040107b msvcr80!free+0xcd
0012ff5c 004011f1 DoubleFree!wmain+0x7b
0012ffa0 758d3833 DoubleFree!__tmainCRTStartup+0x10f
0012ffac 76eba9bd kernel32!BaseThreadInitThunk+0xe
0012ffec 00000000 ntdll!_RtlUserThreadStart+0x23

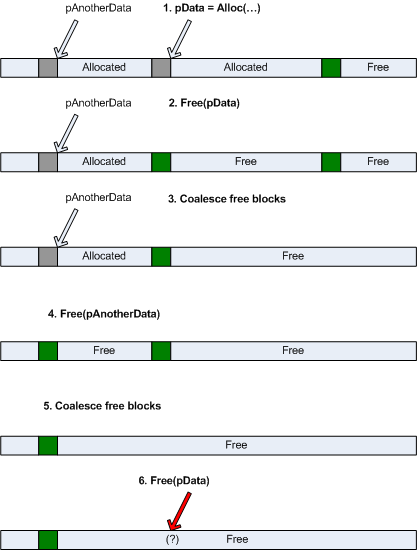
This is illustrated on the following picture where free calls result in heap coalescence and the subsequent double-free call corrupts the heap:
The problem here is that heap coalescence can be triggered some time after the double free so we need some solution to diagnose double-free bugs earlier, ideally at the first double-free call. For example, the following program crashes during the normal free operation long after the first double-free happened:

#include "stdafx.h"
#include <windows.h>

int _tmain(int argc, _TCHAR* argv[])
{
  while (true)
  {
    puts("Allocate: p1");
    void *p1 = malloc(100);
    puts("Allocate: p2");
    void *p2 = malloc(100);
    puts("Allocate: p3");
    void *p3 = malloc(100);

    puts("Free: p1");
    free(p1);
    puts("Free: p2");
    free(p2);
    puts(”Double-Free: p2″);
    free(p2);

    puts(”Double-Free: p3″);
    free(p3);

    Sleep(100);
  }

  return 0;
}

The output of the program:

Allocate: p1
Allocate: p2
Allocate: p3
Free: p1
Free: p2
Double-Free: p2
Free: p3
Allocate: p1
Allocate: p2
Allocate: p3
Free: p1
Free: p2
Double-Free: p2
Free: p3
Allocate: p1
Allocate: p2
Allocate: p3
Free: p1
Free: p2
Double-Free: p2
Free: p3
Allocate: p1
Allocate: p2
Allocate: p3
Free: p1
Free: p2
Double-Free: p2
Free: p3
Crash!

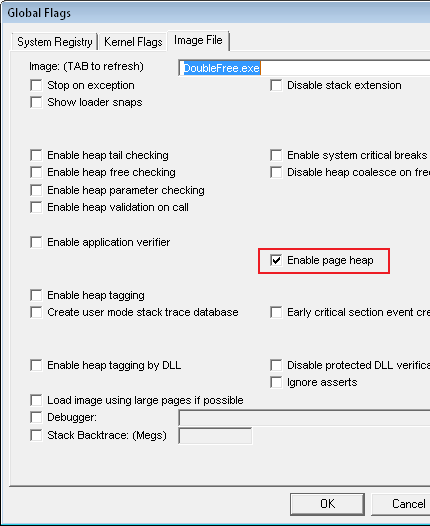
If we enable full page heap using gflags.exe from Debugging Tools for Windows the program crashes immediately on the double free call:
Allocate: p1
Allocate: p2
Allocate: p3
Free: p1
Free: p2
Double-Free: p2
Crash!

The crash dump shows the following stack trace:

0:000> kL
ChildEBP RetAddr
0012f810 71aa4ced ntdll!DbgBreakPoint+0x1
0012f834 71aa9fc2 verifier!VerifierStopMessage+0x1fd
0012f890 71aaa4da verifier!AVrfpDphReportCorruptedBlock+0x102
0012f8a4 71ab2c98 verifier!AVrfpDphCheckNormalHeapBlock+0x18a
0012f8b8 71ab2a0e verifier!_EH4_CallFilterFunc+0x12
0012f8e0 76ee1039 verifier!_except_handler4+0x8e
0012f904 76ee100b ntdll!ExecuteHandler2+0x26
0012f9ac 76ee0e97 ntdll!ExecuteHandler+0x24
0012f9ac 71aaa3ad ntdll!KiUserExceptionDispatcher+0xf
0012fcf0 71aaa920 verifier!AVrfpDphCheckNormalHeapBlock+0x5d
0012fd0c 71aa879b verifier!AVrfpDphNormalHeapFree+0x20
0012fd60 76f31c8f verifier!AVrfDebugPageHeapFree+0x1cb
0012fda8 76efd9fa ntdll!RtlDebugFreeHeap+0x2f
0012fe9c 76ee1c21 ntdll!RtlpFreeHeap+0x5f
0012feb8 758d7a7e ntdll!RtlFreeHeap+0x14e
0012fecc 6cff4c39 kernel32!HeapFree+0x14
0012ff18 0040105f msvcr80!free+0xcd
0012ff5c 004011f1 DoubleFree!wmain+0x5f
0012ffa0 758d3833 DoubleFree!__tmainCRTStartup+0x10f
0012ffac 76eba9bd kernel32!BaseThreadInitThunk+0xe

0:000> !gflag
Current NtGlobalFlag contents: 0x02000000
    hpa - Place heap allocations at ends of pages

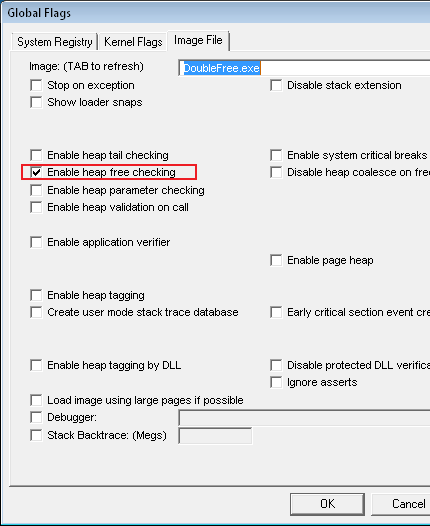
If we enable heap free checking instead of page heap we get our crash on the first double free call immediately too:
Allocate: p1
Allocate: p2
Allocate: p3
Free: p1
Free: p2
Double-Free: p2
Crash!

The crash dump shows the following stack trace:

0:000> r
eax=feeefeee ebx=001b2040 ecx=001b0000 edx=001b2040 esi=d4476047 edi=001b2038
eip=76ee2086 esp=0012fe68 ebp=0012fe9c iopl=0 nv up ei ng nz na pe nc
cs=001b ss=0023 ds=0023 es=0023 fs=003b gs=0000 efl=00010286
ntdll!RtlpLowFragHeapFree+0x31:
76ee2086 8b4604          mov     eax,dword ptr [esi+4] ds:0023:d447604b=????????

0:000> kL
ChildEBP RetAddr
0012fe9c 76ee18c3 ntdll!RtlpLowFragHeapFree+0x31
0012feb0 758d7a7e ntdll!RtlFreeHeap+0x101
0012fec4 6cff4c39 kernel32!HeapFree+0x14
0012ff10 0040106d msvcr80!free+0xcd
0012ff5c 004011f1 DoubleFree!wmain+0x6d
0012ffa0 758d3833 DoubleFree!__tmainCRTStartup+0x10f
0012ffac 76eba9bd kernel32!BaseThreadInitThunk+0xe
0012ffec 00000000 ntdll!_RtlUserThreadStart+0x23

0:000> !gflag
Current NtGlobalFlag contents: 0x00000020
    hfc - Enable heap free checking

- Dmitry Vostokov @ DumpAnalysis.org -

Security and Static Code Analysis

August 19th, 2007

Almost finished reading the book and wrote a short review:

Secure Programming with Static Analysis

- Dmitry Vostokov @ DumpAnalysis.org -

Crash Dump Analysis Patterns (Part 20b)

August 19th, 2007

Sometimes the process size constantly grows but there is no difference in the process heap size. In such cases we need to check whether the process uses Microsoft .NET runtime (CLR). If one of the loaded modules is mscorwks.dll or mscorsvr.dll then it is most likely. Then we should check CLR heap statistics.

In .NET world dynamically allocated objects are garbage collected (GC) and therefore simple allocate-and-forget memory leaks are not possible. To simulate that I created the following C# program:

using System;

namespace CLRHeapLeak
{
    class Leak
    {
        private byte[] m_data;


        public Leak()
        {
            m_data = new byte[1024];
        }
    }

    class Program
    {
        static void Main(string[] args)
        {
            Leak leak = new Leak();

            while (true)
            {
                leak = new Leak();
                System.Threading.Thread.Sleep(100);
            }
        }
    }
}

If we run it the process size will never grow. GC thread will collect and free unreferenced Leak classes. This can be seen from inspecting memory dumps taken with userdump.exe after the start, 2, 6 and 12 minutes. The GC heap never grows higher than 1Mb and the number of CLRHeapLeak.Leak and System.Byte[] objects always fluctuates between 100 and 500. For example, on 12th minute we have the following statistics:

0:000> .loadby sos mscorwks

0:000> !eeheap -gc
Number of GC Heaps: 1
generation 0 starts at 0x0147160c
generation 1 starts at 0x0147100c
generation 2 starts at 0x01471000
ephemeral segment allocation context: (0x014dc53c, 0x014dd618)
 segment    begin allocated     size
004aedb8 790d7ae4  790f7064 0x0001f580(128384)
01470000 01471000  014dd618 0x0006c618(443928)
Large object heap starts at 0x02471000
 segment    begin allocated     size
02470000 02471000  02473250 0x00002250(8784)
Total Size   0x8dde8(581096)
------------------------------
GC Heap Size   0×8dde8(581096)

0:000> !dumpheap -stat
total 2901 objects
Statistics:
Count    TotalSize Class Name
    1           12 System.Security.Permissions.SecurityPermission
    1           24 System.OperatingSystem
    1           24 System.Version
    1           24 System.Reflection.Assembly
    1           28 System.SharedStatics
    1           36 System.Int64[]
    1           40 System.AppDomainSetup
    3           60 System.RuntimeType
    5           60 System.Object
    2           72 System.Security.PermissionSet
    1           72 System.ExecutionEngineException
    1           72 System.StackOverflowException
    1           72 System.OutOfMemoryException
    1          100 System.AppDomain
    7          100      Free
    2          144 System.Threading.ThreadAbortException
    4          328 System.Char[]
  418         5016 CLRHeapLeak.Leak
    5         8816 System.Object[]
 2026       128632 System.String
  418       433048 System.Byte[]
Total 2901 objects

However, if we make Leak objects always referenced by introducing the following changes into the program:

using System;

namespace CLRHeapLeak
{
    class Leak
    {
        private byte[] m_data;
        private Leak m_prevLeak;

        public Leak()
        {
            m_data = new byte[1024];
        }

        public Leak(Leak prevLeak)
        {
            m_prevLeak = prevLeak;
            m_data = new byte[1024];
        }
    }

    class Program
    {
        static void Main(string[] args)
        {
            Leak leak = new Leak();

            while (true)
            {
                leak = new Leak(leak);
                System.Threading.Thread.Sleep(100);
            }
        }
    }
}

then if we run the program we would see in Task Manager that it grows over time. Taking consecutive memory dumps after the start, 10 and 16 minutes, shows that Win32 heap segments have always the same size:

0:000> !heap 0 0
Index   Address  Name      Debugging options enabled
  1:   00530000
    Segment at 00530000 to 00630000 (0003d000 bytes committed)
  2:   00010000
    Segment at 00010000 to 00020000 (00003000 bytes committed)
  3:   00520000
    Segment at 00520000 to 00530000 (00003000 bytes committed)
  4:   00b10000
    Segment at 00b10000 to 00b50000 (00001000 bytes committed)
  5:   001a0000
    Segment at 001a0000 to 001b0000 (00003000 bytes committed)
  6:   00170000
    Segment at 00170000 to 00180000 (00008000 bytes committed)
  7:   013b0000
    Segment at 013b0000 to 013c0000 (00003000 bytes committed)

but GC heap and the number of Leak and System.Byte[] objects in it were growing significantly: 

Process Uptime: 0 days 0:00:04.000

0:000> !eeheap -gc
Number of GC Heaps: 1
generation 0 starts at 0x013c1018
generation 1 starts at 0x013c100c
generation 2 starts at 0x013c1000
ephemeral segment allocation context: (0x013cd804, 0x013cdff4)
 segment    begin allocated     size
0055ee08 790d7ae4  790f7064 0x0001f580(128384)
013c0000 013c1000  013cdff4 0x0000cff4(53236)
Large object heap starts at 0x023c1000
 segment    begin allocated     size
023c0000 023c1000  023c3250 0x00002250(8784)
Total Size   0x2e7c4(190404)
------------------------------
GC Heap Size   0×2e7c4(190404)

0:000> !dumpheap -stat
total 2176 objects
Statistics:
Count    TotalSize Class Name
...
...
...
   46          736 CLRHeapLeak.Leak
    5         8816 System.Object[]
   46        47656 System.Byte[]
 2035       129604 System.String
Total 2176 objects

Process Uptime: 0 days 0:09:56.000

0:000> !eeheap -gc
Number of GC Heaps: 1
generation 0 starts at 0x018cddbc
generation 1 starts at 0x01541ec4
generation 2 starts at 0x013c1000
ephemeral segment allocation context: (0x0192d668, 0x0192ddc8)
 segment    begin allocated     size
0055ee08 790d7ae4  790f7064 0x0001f580(128384)
013c0000 013c1000  0192ddc8 0x0056cdc8(5688776)
Large object heap starts at 0x023c1000
 segment    begin allocated     size
023c0000 023c1000  023c3240 0x00002240(8768)
Total Size  0x58e588(5825928)
------------------------------
GC Heap Size  0×58e588(5825928)

0:000> !dumpheap -stat
total 12887 objects
Statistics:
Count    TotalSize Class Name
...
...
...
    5         8816 System.Object[]
 5403        86448 CLRHeapLeak.Leak
 2026       128632 System.String
 5403      5597508 System.Byte[]
Total 12887 objects

Process Uptime: 0 days 0:16:33.000

0:000> !eeheap -gc
Number of GC Heaps: 1
generation 0 starts at 0x01c59cb4
generation 1 starts at 0x0194fd20
generation 2 starts at 0x013c1000
ephemeral segment allocation context: (0x01cd3050, 0x01cd3cc0)
 segment    begin allocated     size
0055ee08 790d7ae4  790f7064 0x0001f580(128384)
013c0000 013c1000  01cd3cc0 0x00912cc0(9514176)
Large object heap starts at 0x023c1000
 segment    begin allocated     size
023c0000 023c1000  023c3240 0x00002240(8768)
Total Size  0x934480(9651328)
------------------------------
GC Heap Size  0×934480(9651328)

0:000> !dumpheap -stat
total 20164 objects
Statistics:
Count    TotalSize Class Name
    5         8816 System.Object[]
 2026       128632 System.String
 9038       144608 CLRHeapLeak.Leak
 9038      9363368 System.Byte[]
Total 20164 objects

This is not the traditional memory leak because we have the reference chain. However, uncontrolled memory growth can be considered as a memory leak too, caused by poor application design, bad input validation or error handling, etc.

There are situations when customers think there is a memory leak but it is not. One of them is unusually big size of a process when running it on a multi-processor server. If dllhost.exe hosting typical .NET assembly DLL occupies less than 100Mb on a local workstation starts consuming more than 300Mb on a 4 processor server than it can be the case that the server version of CLR uses per processor GC heaps:

0:000> .loadby sos mscorsvr

0:000> !EEHeap -gc
generation 0 starts at 0×05c80154
generation 1 starts at 0×05c7720c
generation 2 starts at 0×102d0030

generation 0 starts at 0×179a0444
generation 1 starts at 0×1799b7a4
generation 2 starts at 0×142d0030

generation 0 starts at 0×0999ac88
generation 1 starts at 0×09990cc4
generation 2 starts at 0×182d0030

generation 0 starts at 0×242eccb0
generation 1 starts at 0×242d0030
generation 2 starts at 0×1c2d0030


GC Heap Size  0×109702ec(278332140)

or if this is CLR 1.x the old extension will tell you the same too: 

0:000> !.\clr10\sos.eeheap -gc
Loaded Son of Strike data table version 5 from "C:\WINDOWS\Microsoft.NET\Framework\v1.1.4322\mscorsvr.dll"
Number of GC Heaps: 4
------------------------------
Heap 0 (0x000f9af0)
generation 0 starts at 0x05c80154
generation 1 starts at 0x05c7720c
generation 2 starts at 0x102d0030
...
...
...
Heap Size  0x515ed60(85,323,104)
------------------------------
Heap 1 (0x000fa070)
generation 0 starts at 0x179a0444
generation 1 starts at 0x1799b7a4
generation 2 starts at 0x142d0030
...
...
...
Heap Size  0x37c7bf0(58,489,840)
------------------------------
Heap 2 (0x000fab80)
generation 0 starts at 0x0999ac88
generation 1 starts at 0x09990cc4
generation 2 starts at 0x182d0030
...
...
...
Heap Size  0x485de34(75,882,036)
------------------------------
Heap 3 (0x000fb448)
generation 0 starts at 0x242eccb0
generation 1 starts at 0x242d0030
generation 2 starts at 0x1c2d0030
...
...
...
Heap Size  0x41ea570(69,117,296)
------------------------------
Reserved segments:
------------------------------
GC Heap Size  0x1136ecf4(288,812,276)

The more processors you have the more heaps are contributing to the overall VM size. Although the process occupies almost 400Mb if it doesn’t grow constantly over time beyond that value then it is normal.

- Dmitry Vostokov @ DumpAnalysis.org -
Book: Advanced Windows Debugging

August 17th, 2007

Waiting for this book to be released:

Advanced Windows Debugging by Mario Hewardt and Daniel Pravat

Buy from Amazon

Already ordered it and will post my review as soon as it arrives.

- Dmitry Vostokov @ DumpAnalysis.org -

Crash Dump Analysis Patterns (Part 22)

August 16th, 2007

Sometimes we suspect that a problem was caused by some module but WinDbg lmv command doesn’t show the company name and other verbose information for it and Google search has no results for the file name. I call this pattern Unknown Component.

In such cases additional information can be obtained by dumping the module resource section or the whole module address range and looking for ASCII and UNICODE strings. For example (byte values in db output are omitted for clarity):

2: kd> lmv m driver
start    end        module name
f5022000 f503e400   driver   (deferred)
    Image path: \SystemRoot\System32\drivers\driver.sys
    Image name: driver.sys
    Timestamp:        Tue Jun 12 11:33:16 2007 (466E766C)
    CheckSum:         00021A2C
    ImageSize:        0001C400
    Translations:     0000.04b0 0000.04e0 0409.04b0 0409.04e0

2: kd> db f5022000 f503e400
f5022000  MZ..............
f5022010  ........@.......
f5022020  ................
f5022030  ................
f5022040  ........!..L.!Th
f5022050  is program canno
f5022060  t be run in DOS
f5022070  mode....$.......
f5022080  .g,._.B._.B._.B.
f5022090  _.C.=.B..%Q.X.B.
f50220a0  _.B.].B.Y%H.|.B.
f50220b0  ..D.^.B.Rich_.B.
f50220c0  ........PE..L...
f50220d0  lvnF............
...
...
...
f503ce30  ................
f503ce40  ................
f503ce50  ................
f503ce60  ............0...
f503ce70  ................
f503ce80  ....H...........
f503ce90  ..........4...V.
f503cea0  S._.V.E.R.S.I.O.
f503ceb0  N._.I.N.F.O.....
f503cec0  ................
f503ced0  ........?.......
f503cee0  ................
f503cef0  ....P.....S.t.r.
f503cf00  i.n.g.F.i.l.e.I.
f503cf10  n.f.o...,.....0.
f503cf20  4.0.9.0.4.b.0...
f503cf30  4.....C.o.m.p.a.
f503cf40  n.y.N.a.m.e.....
f503cf50  M.y.C.o.m.p. .A.
f503cf60  G...p.$...F.i.l.
f503cf70  e.D.e.s.c.r.i.p.
f503cf80  t.i.o.n.....M.y.
f503cf90  .B.i.g. .P.r.o.
f503cfa0  d.u.c.t. .H.o.o.
f503cfb0  k...............
f503cfc0  ................
f503cfd0  ....4.....F.i.l.
f503cfe0  e.V.e.r.s.i.o.n.
f503cff0  ....5...1...0...
f503d000  ????????????????
f503d010  ????????????????
f503d020  ????????????????
f503d030  ????????????????
...
...
...

We see that CompanyName is MyComp AG, FileDescription is My Big Product Hook and FileVersion is 5.0.1.

In our example the same information can be retrieved by dumping the image file header and then finding and dumping the resource section:

2: kd> lmv m driver
start    end        module name
f5022000 f503e400   driver   (deferred)
    Image path: \SystemRoot\System32\drivers\driver.sys
    Image name: driver.sys
    Timestamp:        Tue Jun 12 11:33:16 2007 (466E766C)
    CheckSum:         00021A2C
    ImageSize:        0001C400
    Translations:     0000.04b0 0000.04e0 0409.04b0 0409.04e0

2: kd> !dh f5022000 -f

File Type: EXECUTABLE IMAGE
FILE HEADER VALUES
     14C machine (i386)
       6 number of sections
466E766C time date stamp Tue Jun 12 11:33:16 2007

       0 file pointer to symbol table
       0 number of symbols
      E0 size of optional header
     10E characteristics
            Executable
            Line numbers stripped
            Symbols stripped
            32 bit word machine

OPTIONAL HEADER VALUES
     10B magic #
    6.00 linker version
   190A0 size of code
    30A0 size of initialized data
       0 size of uninitialized data
   1A340 address of entry point
     2C0 base of code
         ----- new -----
00010000 image base
      20 section alignment
      20 file alignment
       1 subsystem (Native)
    4.00 operating system version
    0.00 image version
    4.00 subsystem version
   1C400 size of image
     2C0 size of headers
   21A2C checksum
00100000 size of stack reserve
00001000 size of stack commit
00100000 size of heap reserve
00001000 size of heap commit
       0 [       0] address [size] of Export Directory
   1A580 [      50] address [size] of Import Directory
   1AE40 [     348] address [size] of Resource Directory
       0 [       0] address [size] of Exception Directory
       0 [       0] address [size] of Security Directory
   1B1A0 [    1084] address [size] of Base Relocation Directory
     420 [      1C] address [size] of Debug Directory
       0 [       0] address [size] of Description Directory
       0 [       0] address [size] of Special Directory
       0 [       0] address [size] of Thread Storage Directory
       0 [       0] address [size] of Load Configuration Directory
       0 [       0] address [size] of Bound Import Directory
     2C0 [     15C] address [size] of Import Address Table Directory
       0 [       0] address [size] of Delay Import Directory
       0 [       0] address [size] of COR20 Header Directory
       0 [       0] address [size] of Reserved Directory

2: kd> db f5022000+1AE40 f5022000+1AE40+348
f503ce40  ................
f503ce50  ................
f503ce60  ............0...
f503ce70  ................
f503ce80  ....H...........
f503ce90  ..........4...V.
f503cea0  S._.V.E.R.S.I.O.
f503ceb0  N._.I.N.F.O.....
f503cec0  ................
f503ced0  ........?.......
f503cee0  ................
f503cef0  ....P.....S.t.r.
f503cf00  i.n.g.F.i.l.e.I.
f503cf10  n.f.o...,.....0.
f503cf20  4.0.9.0.4.b.0...
f503cf30  4.....C.o.m.p.a.
f503cf40  n.y.N.a.m.e.....
f503cf50  M.y.C.o.m.p. .A.
f503cf60  G...p.$...F.i.l.
f503cf70  e.D.e.s.c.r.i.p.
f503cf80  t.i.o.n.....M.y.
f503cf90  .B.i.g. .P.r.o.
f503cfa0  d.u.c.t. .H.o.o.
f503cfb0  k...............
f503cfc0  ................
f503cfd0  ....4.....F.i.l.
f503cfe0  e.V.e.r.s.i.o.n.
f503cff0  ....5...1...0...
f503d000  ????????????????
f503d010  ????????????????
...
...
...

- Dmitry Vostokov @ DumpAnalysis.org -
Memory Visualization and Security

August 15th, 2007

This security warning is related to sound files and pictures produced by Dump2Wave, Dump2Picture and WinDbg scripts based on them.

These tools do not change computer memory data and it is present in resulting WAV and BMP files unmodified. Do not publish these files on Internet, otherwise you might expose your private or sensitive data.

If you use lossy compression afterwards, like MP3 or JPEG, all original computer memory content is lost and becomes non-recoverable.

Therefore, if you create a piece of modern art using Dump2Picture and want to publish it electronically always transform it into JPEG, for example.

- Dmitry Vostokov @ DumpAnalysis.org -

Picturing Computer Memory

August 15th, 2007

An alternative to converting memory dumps to picture files is to save a memory range to a binary file and then convert it to a BMP file. Thus you can view the particular DLL or driver mapped into address space, heap or pool region, etc.

To save a memory range to a file use WinDbg .writemem command:

.writemem d2p-range.bin 00800000 0085e000

or

.writemem d2p-range.bin 00400000 L20000

I wrote a WinDbg script that saves a specified memory range and then calls a shell script which automatically converts saved binary file to a BMP file and then runs whatever picture viewer is registered for .bmp extension.

The WinDbg script code (mempicture.txt):

.writemem d2p-range.bin ${$arg1} ${$arg2}
.if (${/d:$arg3})
{
  .shell -i- mempicture.cmd d2p-range ${$arg3}
}
.else
{
  .shell -i- mempicture.cmd d2p-range
}

The shell script (mempicture.cmd):

dump2picture %1.bin %1.bmp %2
%1.bmp

Because WinDbg installation folder is assumed to be the default directory for both scripts and Dump2Picture.exe they should be copied to the same folder where windbg.exe is located. On my system it is

C:\Program Files\Debugging Tools for Windows

Both scripts are now included in Dump2Picture package available for free download:

Dump2Picture package

To call the script from WinDbg use the following command:

$$>a< mempicture.txt Range [bits-per-pixel]

where Range can be in Address1 Address2 or Address Lxxx format, bits-per-pixel can be 8, 16, 24 or 32. By default it is 32.

For example, I loaded a complete Windows x64 memory dump and visualized HAL (hardware abstraction layer) module:

kd> lm
start             end                 module name
fffff800`00800000 fffff800`0085e000   hal
fffff800`01000000 fffff800`0147b000   nt
fffff97f`ff000000 fffff97f`ff45d000   win32k
...
...
...

kd> $$>a< mempicture.txt fffff800`00800000 fffff800`0085e000
Writing 5e001 bytes...

C:\Program Files\Debugging Tools for Windows>dump2picture d2p-range.bin d2p-range.bmp

Dump2Picture version 1.1
Written by Dmitry Vostokov, 2007

d2p-range.bmp
d2p-range.bin
        1 file(s) copied.

C:\Program Files\Debugging Tools for Windows>d2p-range.bmp
<.shell waiting 10 second(s) for process>
.shell: Process exited
kd>

and Windows Picture and Fax Viewer application was launched and displayed the following picture:

Enjoy :-)

- Dmitry Vostokov @ DumpAnalysis.org -

Unicode Illuminated

August 14th, 2007

I generated a memory dump with plenty of Unicode and ASCII strings “Hello World!” to see how they look on a picture. I assume you know the difference between Unicode (UTF-16) and ASCII encodings: wide characters from the former occupy two bytes:

0:000> db 008c7420 l20
008c7420  48 00 65 00 6c 00 6c 00-6f 00 20 00 57 00 6f 00  H.e.l.l.o. .W.o.
008c7430  72 00 6c 00 64 00 21 00-00 00 00 00 00 00 00 00  r.l.d.!.........

and characters from the latter occupy one byte of memory:

0:000> db 008c72b4 l10
008c72b4  48 65 6c 6c 6f 20 57 6f-72 6c 64 21 00 00 00 00  Hello World!....

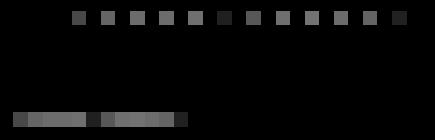
You can see that the second byte for Unicode English characters is zero. I converted that memory dump into 8 bits-per-pixel bitmap using Dump2Picture and after zooming it sufficiently in Vista Photo Viewer until pixels become squares I got the following picture that illustrates the difference between Unicode and ASCII strings:

Incidentally the same memory dump converted to 32 bits-per-pixel bitmap shows Unicode “Hello World!” strings in green colors :-)

- Dmitry Vostokov @ DumpAnalysis.org -

Dump2Picture update (version 1.1)

August 13th, 2007

Previously announced Dump2Picture has been updated to version 1.1 with the following improvements to handle 8 bits-per-pixel images correctly:

- Saves grey scale palette

- Calculates right bitmap width and file size

The update can be downloaded from the same link:

Download Dump2Picture

Now 8 bits-per-pixel Vista kernel dump looks much better:

- Dmitry Vostokov @ DumpAnalysis.org -
Visualizing Memory Leaks

August 12th, 2007

Dump2Picture can be used to explore memory leaks visually. I created the following small program in Visual C++ that leaks 64Kb every second:

#include "stdafx.h"
#include <windows.h>

int _tmain(int argc, _TCHAR* argv[])
{
  while (true)
  {
    printf("%x\n", (UINT_PTR)malloc(0xFFFF));
    Sleep(1000);
  }

  return 0;
}

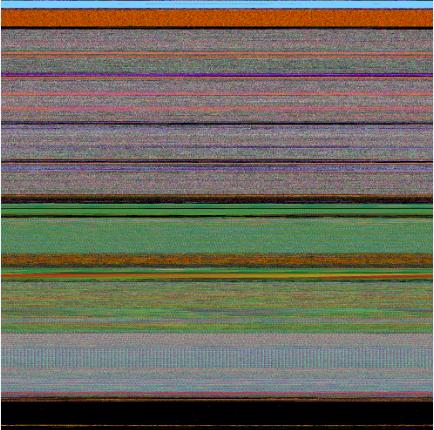
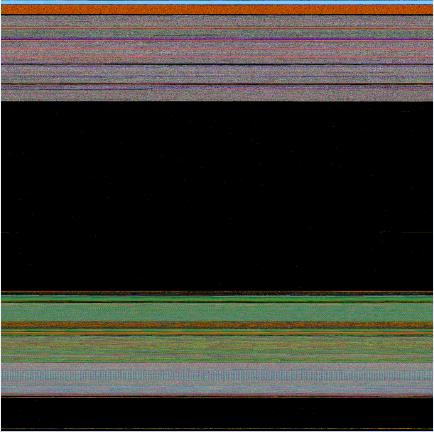
Then I sampled 3 dumps at 7Mb, 17Mb and 32Mb process virtual memory size and converted them as 16 bits-per-pixel bitmaps. On the pictures below we can see that the middle black memory area grows significantly. Obviously malloc function allocates zeroed memory and therefore we see black color.

7Mb process memory dump:

17Mb process memory dump:

32Mb process memory dump:

If we zoom in the black area we would see the following pattern:


Colored lines inside are heap control structures that are created for every allocated block of memory. If this is correct then allocating smaller memory blocks would create a hatched pattern. And this is true indeed. The following program leaks 256 byte memory blocks:

#include "stdafx.h"
#include <windows.h>

int _tmain(int argc, _TCHAR* argv[])
{
  while (true)
  {
    printf("%x\n", (UINT_PTR)malloc(0xFF));
    Sleep(1000/0xFF);
  }

  return 0;
}

The corresponding process memory picture and zoomed heap area are the following:

Making allocations 4 times smaller makes heap area to look hatched and zoomed picture is more densely packed by heap control structures:

#include "stdafx.h"
#include <windows.h>

int _tmain(int argc, _TCHAR* argv[])
{
  while (true)
  {
    printf("%x\n", (UINT_PTR)malloc(0xFF/4));
    Sleep((1000/0xFF)/4);
  }

  return 0;
}


Here is another example. One service was increasing its memory constantly. The crash dump picture shows huge hatched dark region in the middle:


and if we zoom in this region:

Because the pattern and allocation size look uniform it could be the true heap memory leak for some operation that allocates constant size buffers. After opening the dump and looking at heap segments that had grown the most we see the same allocation size indeed:

0:000> !.\w2kfre\ntsdexts.heap -h 5
HEAPEXT: Unable to get address of NTDLL!NtGlobalFlag.
Index   Address  Name      Debugging options enabled
  1:   00140000
  2:   00240000
  3:   00310000
  4:   00330000
  5:   00370000
    Segment at 00370000 to 00380000 (00010000 bytes committed)
    Segment at 01680000 to 01780000 (00100000 bytes committed)
    Segment at 019C0000 to 01BC0000 (00200000 bytes committed)
    Segment at 01BC0000 to 01FC0000 (00400000 bytes committed)
    Segment at 01FC0000 to 027C0000 (00800000 bytes committed)
    Segment at 027C0000 to 037C0000 (01000000 bytes committed)
    Segment at 037C0000 to 057C0000 (02000000 bytes committed)

    Segment at 057C0000 to 097C0000 (00155000 bytes committed)


    057B96E0: 01048 . 01048 [07] - busy (1030), tail fill
    057BA728: 01048 . 01048 [07] - busy (1030), tail fill
    057BB770: 01048 . 01048 [07] - busy (1030), tail fill
    057BC7B8: 01048 . 01048 [07] - busy (1030), tail fill
    057BD800: 01048 . 01048 [07] - busy (1030), tail fill
    057BE848: 01048 . 01048 [07] - busy (1030), tail fill
    057BF890: 01048 . 00770 [14] free fill
  Heap entries for Segment07 in Heap 370000
    057C0040: 00040 . 01048 [07] - busy (1030), tail fill
    057C1088: 01048 . 01048 [07] - busy (1030), tail fill
    057C20D0: 01048 . 01048 [07] - busy (1030), tail fill
    057C3118: 01048 . 01048 [07] - busy (1030), tail fill
    057C4160: 01048 . 01048 [07] - busy (1030), tail fill
    057C51A8: 01048 . 01048 [07] - busy (1030), tail fill


- Dmitry Vostokov @ DumpAnalysis.org -
Crash Dump Analysis Patterns (Part 21)

August 12th, 2007

Sometimes it is possible that a process crash dump doesn’t have all usual threads inside. For example, you expect at least 4 threads including the main process thread but in the dump you see only 3. If you know that some access violations were reported in the event log before (not necessarily for the same PID) you might suspect that one of threads had been terminated due to some reason. I call this pattern Missing Thread.

In order to simulate this problem I created a small multithreaded program in Visual C++:

#include "stdafx.h"
#include <process.h>

void thread_request(void *param)
{
    while (true);
}

int _tmain(int argc, _TCHAR* argv[])
{
    _beginthread(thread_request, 0, NULL);

    try
    {
        if (argc == 2)
        {
            *(int *)NULL = 0;
        }
    }
    catch (...)
    {
        _endthread();
    }

    while (true);

    return 0;
}

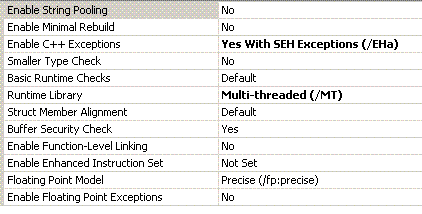
If there is a command line argument then the main thread simulates access violation and finishes in the exception handler. In order to use SEH exceptions with C++ try/catch blocks you have to enable /EHa option in C++ Code Generation properties:

If we run the program without command line parameter and take a manual dump from it we would see 2 threads:

0:000> ~*kL

.  0  Id: 1208.fdc Suspend: 1 Teb: 7efdd000 Unfrozen
ChildEBP RetAddr
0012ff70 00401403 MissingThread!wmain+0x58
0012ffc0 7d4e7d2a MissingThread!__tmainCRTStartup+0x15e
0012fff0 00000000 kernel32!BaseProcessStart+0x28

   1  Id: 1208.102c Suspend: 1 Teb: 7efda000 Unfrozen
ChildEBP RetAddr
005dff7c 004010ef MissingThread!thread_request
005dffb4 00401188 MissingThread!_callthreadstart+0x1b
005dffb8 7d4dfe21 MissingThread!_threadstart+0x73
005dffec 00000000 kernel32!BaseThreadStart+0x34

0:000> ~
.  0  Id: 1208.fdc Suspend: 1 Teb: 7efdd000 Unfrozen
   1  Id: 1208.102c Suspend: 1 Teb: 7efda000 Unfrozen

0:000> dd 7efdd000 l4
7efdd000  0012ff64 00130000 0012e000 00000000

I also dumped TEB of the main thread. However if we run the program with any command line parameter and look at its manual dump we would see only one thread with the main thread missing:

0:000> ~*kL

.  0  Id: 1004.12e8 Suspend: 1 Teb: 7efda000 Unfrozen
ChildEBP RetAddr
005dff7c 004010ef MissingThread!thread_request
005dffb4 00401188 MissingThread!_callthreadstart+0x1b
005dffb8 7d4dfe21 MissingThread!_threadstart+0x73
005dffec 00000000 kernel32!BaseThreadStart+0x34

0:000> ~
.  0  Id: 1004.12e8 Suspend: 1 Teb: 7efda000 Unfrozen

If we try to dump TEB address and stack data from the missing main thread we would see that the memory was already decommitted:

0:000> dd 7efdd000 l4
7efdd000  ???????? ???????? ???????? ????????

0:000> dds 0012e000  00130000
0012e000  ????????
0012e004  ????????
0012e008  ????????
0012e00c  ????????
0012e010  ????????
0012e014  ????????
0012e018  ????????
0012e01c  ????????
0012e020  ????????
0012e024  ????????

The same effect can be achieved in the similar program that exits the thread in the custom unhandled exception filter:

#include "stdafx.h"
#include <process.h>
#include <windows.h>

LONG WINAPI CustomUnhandledExceptionFilter(struct _EXCEPTION_POINTERS* ExceptionInfo)
{
    ExitThread(-1);
}

void thread_request(void *param)
{
    while (true);
}

int _tmain(int argc, _TCHAR* argv[])
{
    _beginthread(thread_request, 0, NULL);
    SetUnhandledExceptionFilter(CustomUnhandledExceptionFilter);

    *(int *)NULL = 0;

    while (true);

    return 0;
}

The solution to catch an exception that results in a thread termination would be to run the program under WinDbg or any other debugger:

CommandLine: C:\MissingThread\MissingThread.exe 1
Symbol search path is: SRV*c:\websymbols*http://msdl.microsoft.com/download/symbols
Executable search path is:
ModLoad: 00400000 0040f000   MissingThread.exe
ModLoad: 7d4c0000 7d5f0000   NOT_AN_IMAGE
ModLoad: 7d600000 7d6f0000   C:\W2K3\SysWOW64\ntdll32.dll
ModLoad: 7d4c0000 7d5f0000   C:\W2K3\syswow64\kernel32.dll
(df0.12f0): Break instruction exception - code 80000003 (first chance)
eax=7d600000 ebx=7efde000 ecx=00000005 edx=00000020 esi=7d6a01f4 edi=00221f38
eip=7d61002d esp=0012fb4c ebp=0012fcac iopl=0 nv up ei pl nz na po nc
cs=0023 ss=002b ds=002b es=002b fs=0053 gs=002b efl=00000202
ntdll32!DbgBreakPoint:
7d61002d cc              int     3

0:000> g
ModLoad: 71c20000 71c32000   C:\W2K3\SysWOW64\tsappcmp.dll
ModLoad: 77ba0000 77bfa000   C:\W2K3\syswow64\msvcrt.dll
ModLoad: 00410000 004ab000   C:\W2K3\syswow64\ADVAPI32.dll
ModLoad: 7da20000 7db00000   C:\W2K3\syswow64\RPCRT4.dll
ModLoad: 7d8d0000 7d920000   C:\W2K3\syswow64\Secur32.dll
(df0.12f0): Access violation - code c0000005 (first chance)
First chance exceptions are reported before any exception handling.
This exception may be expected and handled.
eax=000007a0 ebx=7d4d8df9 ecx=78b842d9 edx=00000000 esi=00000002 edi=00000ece
eip=00401057 esp=0012ff50 ebp=0012ff70 iopl=0 nv up ei pl zr na pe nc
cs=0023 ss=002b ds=002b es=002b fs=0053 gs=002b efl=00010246
MissingThread!wmain+0x47:
00401057 c7050000000000000000 mov dword ptr ds:[0],0  ds:002b:00000000=????????

0:000> kL
ChildEBP RetAddr
0012ff70 00401403 MissingThread!wmain+0x47
0012ffc0 7d4e7d2a MissingThread!__tmainCRTStartup+0x15e
0012fff0 00000000 kernel32!BaseProcessStart+0x28

If live debugging is not possible and you are interested in crash dumps saved upon a first chance exception before it is processed in an exception handler you can also use MS userdump after you install it and enable All Exceptions in the Process Monitoring Rules dialog box. Another tool can be used is ADPlus in crash mode from Debugging Tools for Windows.

- Dmitry Vostokov @ DumpAnalysis.org -
BIOS Internals

August 10th, 2007

The life of OS starts with BIOS and if you are curious about BIOS technology, x86 computer architecture and security the following book that I recently discovered and bought will help you:

BIOS Disassembly Ninjutsu Uncovered

- Dmitry Vostokov @ DumpAnalysis.org -

Another look at page faults

August 9th, 2007

Recently observed this bugcheck with reported “valid” address (in blue):

DRIVER_IRQL_NOT_LESS_OR_EQUAL (d1)
An attempt was made to access a pageable (or completely invalid) address at an
interrupt request level (IRQL) that is too high.  This is usually
caused by drivers using improper addresses.
If kernel debugger is available get stack backtrace.
Arguments:
Arg1: e16623fc, memory referenced
Arg2: 00000002, IRQL
Arg3: 00000000, value 0 = read operation, 1 = write operation
Arg4: ae2b222e, address which referenced memory

TRAP_FRAME:  a54a4a40 -- (.trap 0xffffffffa54a4a40)
ErrCode = 00000000
eax=00000000 ebx=00000000 ecx=e16623f0 edx=00000000 esi=ae2ce428 edi=a54a4b4c
eip=ae2b222e esp=a54a4ab4 ebp=a54a4ac4 iopl=0 nv up ei pl nz ac po nc
cs=0008 ss=0010 ds=0023 es=0023 fs=0030 gs=0000 efl=00010212
driver!ProcessCommand+0x44:
ae2b222e 39590c cmp dword ptr [ecx+0Ch],ebx ds:0023:e16623fc=00000000

1: kd> dd e16623fc l4
e16623fc 00000000 00790000 004c4c44 00010204

The address belongs to a paged pool:

1: kd> !pool e16623fc
Pool page e16623fc region is Paged pool
 e1662000 size:  3a8 previous size:    0  (Allocated)  NtfF
 e16623a8 size:   10 previous size:  3a8  (Free)       ….
 e16623b8 size:   28 previous size:   10  (Allocated)  Ntfo
 e16623e0 size:    8 previous size:   28  (Free)       CMDa
*e16623e8 size:   20 previous size:    8  (Allocated) *DRV

So why do we have the bugcheck here if the memory wasn’t paged out? This is because page faults occur when pages are marked as invalid in page tables and not only when they are paged out to a disk. We can check whether an address belongs to an invalid page by using !pte command:

1: kd> !pte e16623fc
               VA e16623fc
PDE at 00000000C0603858    PTE at 00000000C070B310
contains 00000000F5434863  contains 00000000E817A8C2
pfn f5434 ---DA--KWEV                           not valid
                       Transition: e817a
                       Protect: 6 - ReadWriteExecute

Let’s check our PTE (page table entry):

1: kd> .formats 00000000E817A8C2
Evaluate expression:
  Hex: e817a8c2
  Decimal: -401102654
  Octal: 35005724302
  Binary: 11101000 00010111 10101000 11000010

We see that 0th (Valid) bit is cleared and this means that PTE marks the page as invalid and also 11th bit (Transition) is set which marks that page as on standby or modified lists. When referenced and IRQL is less than 2 the page will be made valid and added to a process working set. We see the address as “valid” in WinDbg  because that page was not paged out and present in a crash dump. But it is marked as invalid and therefore triggers the page fault. Page fault handler sees that IRQL == 2 and generates D1 bugcheck.

- Dmitry Vostokov @ DumpAnalysis.org -
Reading Windows-based Code (Part 4)

August 9th, 2007

The HTML version of the presentation is located here:

Reading Windows-based Code (Part 4)

I had to postpone a detailed overview of Windows specific types and the structure of a typical Windows GUI program for 5th part.

- Dmitry Vostokov @ DumpAnalysis.org -

Basic Windows Crash Dump Analysis (Part 1)

August 7th, 2007

I have published the HTML version (with minor updates) of the original training presentation created in 2005. 

The first part explains various concepts like process, thread, crash, hang, etc. and introduces memory dump classification from memory type and procedure perspectives. It also covers crash dump gathering and verification, explains symbols and lists common scenarios. Here is the link: 

Basic Windows Crash Dump Analysis (Part 1)

- Dmitry Vostokov @ DumpAnalysis.org -
Memory Dump Analysis Patterns

August 6th, 2007

Because the number of crash dump analysis patterns is growing I created a page that lists them and new will be added to it as soon as I write them. Some patterns are not really related to crashes, for example, memory leaks or CPU spikes so it would be better to call all of them memory dump analysis patterns instead. 

Memory Dump Analysis Patterns

- Dmitry Vostokov @ DumpAnalysis.org -

Crash Dump Analysis Patterns (Part 20a)

August 6th, 2007

Memory Leak is another pattern that may be finally manifested as Insufficient Memory pattern in a crash dump. In this part I’ll cover process heap memory leaks. They are usually identified when the process virtual memory size grows over time. It starts with 80Mb and instead of fluctuating normally below 100Mb it suddenly starts growing to 150Mb after some time and then to 300Mb next day and then grows to 600Mb and so on.

Usually a process heap is under suspicion here. To confirm this we need to sample 2-3 consecutive user memory dumps at process sizes 100Mb, 200Mb and 300Mb, for example. This can be done by using Microsoft userdump.exe command line tool. Then we can see whether there is any heap growth by using !heap -s WinDbg command:

1st dump

0:000> !heap -s
  Heap     Flags   Reserv  Commit  Virt
                    (k)     (k)    (k)
---------------------------------------
00140000 00000002    2048   1048   1112
00240000 00008000      64     12     12
00310000 00001002    7232   4308   4600
00420000 00001002    1024    520    520
00340000 00001002     256     40     40
00720000 00001002      64     32     32
00760000 00001002      64     48     48
01020000 00001002     256     24     24
02060000 00001002      64     16     16
02070000 00001003     256    120    120
020b0000 00001003     256      4      4
020f0000 00001003     256      4      4
02130000 00001003     256      4      4
02170000 00001003     256      4      4
021f0000 00001002    1088     76     76
021e0000 00001002      64     16     16
02330000 00001002    1088    428    428
02340000 00011002     256     12     12
02380000 00001002      64     12     12
024c0000 00001003      64      8      8
028d0000 00001002    7232   3756   6188
02ce0000 00001003      64      8      8
07710000 00001002      64     20     20
07b20000 00001002      64     16     16
07f30000 00001002      64     16     16
09050000 00001002     256     12     12
09c80000 00001002  130304 102340 102684
007d0000 00001003     256    192    192
00810000 00001003     256      4      4
0bdd0000 00001003     256      4      4
0be10000 00001003     256      4      4
0be50000 00001003     256      4      4
0be90000 00001003     256     56     56
0bed0000 00001003     256      4      4
0bf10000 00001003     256      4      4
0bf50000 00001003     256      4      4
0bf90000 00001003     256      4      4
00860000 00001002      64     20     20
00870000 00001002      64     20     20
0d760000 00001002     256     12     12
0dc60000 00001002    1088    220    220
0c3a0000 00001002      64     12     12
0c3d0000 00001002    1088    160    364
08420000 00001002      64     64     64

2nd dump

0:000> !heap -s
  Heap     Flags   Reserv  Commit  Virt
                    (k)     (k)    (k)
---------------------------------------
00140000 00000002    8192   4600   4600
00240000 00008000      64     12     12
00310000 00001002    7232   4516   4600
00420000 00001002    1024    520    520
00340000 00001002     256     44     44
00720000 00001002      64     32     32
00760000 00001002      64     48     48
01020000 00001002     256     24     24
02060000 00001002      64     16     16
02070000 00001003     256    124    124
020b0000 00001003     256      4      4
020f0000 00001003     256      4      4
02130000 00001003     256      4      4
02170000 00001003     256      4      4
021f0000 00001002    1088     76     76
021e0000 00001002      64     16     16
02330000 00001002    1088    428    428
02340000 00011002     256     12     12
02380000 00001002      64     12     12
024c0000 00001003      64      8      8
028d0000 00001002    7232   3796   6768
02ce0000 00001003      64      8      8
07710000 00001002      64     20     20
07b20000 00001002      64     16     16
07f30000 00001002      64     16     16
09050000 00001002     256     12     12
09c80000 00001002  261376 221152 221928
007d0000 00001003     256    192    192
00810000 00001003     256      4      4
0bdd0000 00001003     256      4      4
0be10000 00001003     256      4      4
0be50000 00001003     256      4      4
0be90000 00001003     256     60     60
0bed0000 00001003     256      4      4
0bf10000 00001003     256      4      4
0bf50000 00001003     256      4      4
0bf90000 00001003     256      4      4
00860000 00001002      64     20     20
00870000 00001002      64     20     20
0d760000 00001002     256     12     12
0dc60000 00001002    1088    228    228
0c3a0000 00001002      64     12     12
0c3d0000 00001002    1088    168    224
08450000 00001002      64     64     64

We see that the only significant heap growth is at 09c80000 address, from 130Mb to 260Mb. However this doesn’t say which code uses it. In order to find the code we need to enable the so called user mode stack trace database. Please refer to the following Citrix article:

http://support.citrix.com/article/CTX106970

The example in the article is for Citrix IMA service but you can replace ImaSrv.exe with any other executable name.

Suppose that after enabling user mode stack trace database and restarting the program or service we see the growth and we get memory dumps with the following suspicious heap highlighted in red:

0:000> !gflag
Current NtGlobalFlag contents: 0x00001000
ust - Create user mode stack trace database

0:000> !heap -s
NtGlobalFlag enables following debugging aids for new heaps:
  stack back traces
LFH Key: 0x2687ed29
  Heap     Flags   Reserv  Commit  Virt
                    (k)     (k)    (k)
---------------------------------------
00140000 58000062    4096    488    676
00240000 58008060      64     12     12
00360000 58001062    3136   1152   1216
003b0000 58001062      64     32     32
01690000 58001062     256     32     32
016d0000 58001062    1024    520    520
003e0000 58001062      64     48     48
02310000 58001062     256     24     24
02b30000 58001062      64     16     16
02b40000 58001063     256     64     64
02b80000 58001063     256      4      4
02bc0000 58001063     256      4      4
02c00000 58001063     256      4      4
02c40000 58001063     256      4      4
02c80000 58001063     256      4      4
02cc0000 58001063     256      4      4
02d30000 58001063      64      4      4
03140000 58001062    7232   4160   4896
03550000 58001063      64      4      4
07f70000 58001062      64     12     12
08380000 58001062      64     12     12
08790000 58001062      64     12     12
091d0000 58011062     256     12     12
09210000 58001062      64     16     16
09220000 58001062      64     12     12
092a0000 58001062      64     12     12
09740000 58001062     256     12     12
0b1a0000 58001062      64     12     12
0b670000 58001062   64768  39508  39700
0b7b0000 58001062      64     12     12
0c650000 58001062    1088    192    192

Every heap is subdivided into several segments and to see which segments have grown the most we can use !heap -m <heap address> command:

0:000> !heap -m 0b670000
Index   Address  Name      Debugging options enabled
29:   0b670000
    Segment at 0b670000 to 0b6b0000 (00040000 bytes committed)
    Segment at 0c760000 to 0c860000 (00100000 bytes committed)
    Segment at 0c980000 to 0cb80000 (001fe000 bytes committed)
    Segment at 0cb80000 to 0cf80000 (003cc000 bytes committed)
    Segment at 0dc30000 to 0e430000 (00800000 bytes committed)
    Segment at 12330000 to 13330000 (01000000 bytes committed)
    Segment at 13330000 to 15330000 (0078b000 bytes committed)


If we use !heap -a <heap address> command then in addition to the list of heap segments individual heap allocation entries will be dumped as well. This could be very big output and we should open the log file in advance by using .logopen <file name> command.

The output can be like this (taken from another dump):

0:000> !heap -a 000a0000
...
...
...
    Segment00 at 000a0000:
        Flags:           00000000
        Base:            000a0000
        First Entry:     000a0580
        Last Entry:      000b0000
        Total Pages:     00000010
        Total UnCommit:  00000002
        Largest UnCommit:00000000
        UnCommitted Ranges: (1)

    Heap entries for Segment00 in Heap 000a0000
        000a0000: 00000 . 00580 [101] - busy (57f)
        000a0580: 00580 . 00240 [101] - busy (23f)
        000a07c0: 00240 . 00248 [101] - busy (22c)
        000a0a08: 00248 . 00218 [101] - busy (200)
        000a0c20: 00218 . 00ce0 [100]
        000a1900: 00ce0 . 00f88 [101] - busy (f6a)
        000a2888: 00f88 . 04418 [101] - busy (4400)
        000a6ca0: 04418 . 05958 [101] - busy (5940)
        000ac5f8: 05958 . 00928 [101] - busy (90c)
        000acf20: 00928 . 010c0 [100]
        000adfe0: 010c0 . 00020 [111] - busy (1d)
        000ae000:      00002000      - uncommitted bytes.

Then we can inspect individual entries to see stack traces that allocated them by using !heap -p -a <heap entry address> command:

0:000> !heap -p -a 000a6ca0
    address 000a6ca0 found in
    _HEAP @ a0000
      HEAP_ENTRY Size Prev Flags    UserPtr UserSize - state
        000a6ca0 0b2b 0000  [00]   000a6cb8    05940 - (busy)
        Trace: 2156ac
        7704dab4 ntdll!RtlAllocateHeap+0x0000021d
        75c59b12 USP10!UspAllocCache+0x0000002b
        75c62381 USP10!AllocSizeCache+0x00000048
        75c61c74 USP10!FindOrCreateSizeCacheWithoutRealizationID+0x00000124
        75c61bc0 USP10!FindOrCreateSizeCacheUsingRealizationID+0x00000070
        75c59a97 USP10!UpdateCache+0x0000002b
        75c59a61 USP10!ScriptCheckCache+0x0000005c
        75c59d04 USP10!ScriptStringAnalyse+0x0000012a
        7711140f LPK!LpkStringAnalyse+0x00000114
        7711159e LPK!LpkCharsetDraw+0x00000302
        77111488 LPK!LpkDrawTextEx+0x00000044
        76a4beb3 USER32!DT_DrawStr+0x0000013a
        76a4be45 USER32!DT_DrawJustifiedLine+0x0000005f
        76a49d68 USER32!AddEllipsisAndDrawLine+0x00000186
        76a4bc31 USER32!DrawTextExWorker+0x000001b1
        76a4bedc USER32!DrawTextExW+0x0000001e
        746051d8 uxtheme!CTextDraw::GetTextExtent+0x000000be
        7460515a uxtheme!GetThemeTextExtent+0x00000065
        74611ed4 uxtheme!CThemeMenuBar::MeasureItem+0x00000124
        746119c1 uxtheme!CThemeMenu::OnMeasureItem+0x0000003f
        74611978 uxtheme!CThemeWnd::_PreDefWindowProc+0x00000117
        74601ea5 uxtheme!_ThemeDefWindowProc+0x00000090
        74601f61 uxtheme!ThemeDefWindowProcW+0x00000018
        76a4a09e USER32!DefWindowProcW+0x00000068
        931406 notepad!NPWndProc+0x00000084
        76a51a10 USER32!InternalCallWinProc+0x00000023
        76a51ae8 USER32!UserCallWinProcCheckWow+0x0000014b
        76a51c03 USER32!DispatchClientMessage+0x000000da
        76a3bc24 USER32!__fnINOUTLPUAHMEASUREMENUITEM+0x00000027
        77040e6e ntdll!KiUserCallbackDispatcher+0x0000002e
        76a51d87 USER32!RealDefWindowProcW+0x00000047
        74601f2f uxtheme!_ThemeDefWindowProc+0x000001b8

If we want to dump all heap entries with their corresponding stack traces we can use !heap -k -h <heap address> command.

Note: sometimes all these commands don’t work. In such cases we can use old Windows 2000 extension.

Some prefer to use umdh.exe and get text file logs but the advantage of embedding heap allocation stack traces in a dump is that we are not concerned with sending and configuring symbol files at a customer side.

- Dmitry Vostokov @ DumpAnalysis.org -
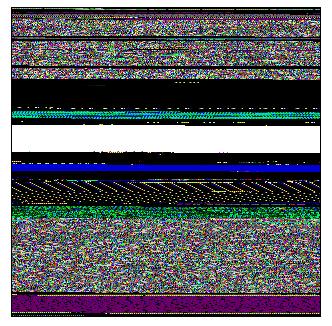
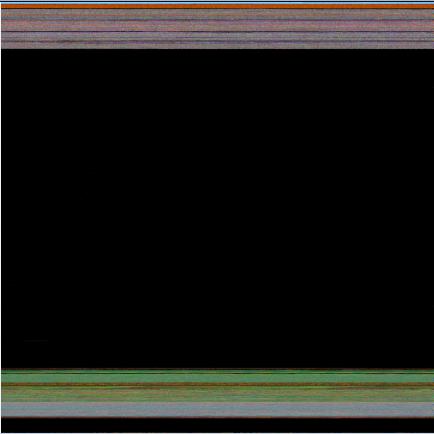
Visualizing Memory Dumps

August 4th, 2007

As the first step towards Memory Dump Tomography I created a small program that interprets a memory dump as a picture. You can visualize crash dumps with it. The tool is available for free download:

Download Dump2Picture

Simply run it from the command prompt and specify full paths to a dump file and an output BMP file. The memory dump file will be converted by default into true color, 32 bits-per-pixel bitmap. You can specify other values: 8, 16 and 24.

C:\Dump2Picture>Dump2Picture.exe

Dump2Picture version 1.0
Written by Dmitry Vostokov, 2007

Usage: Dump2Picture dumpfile bmpfile [8|16|24|32]

For example:

C:\Dump2Picture>Dump2Picture.exe MEMORY.DMP MEMORY.BMP 8

Dump2Picture version 1.0
Written by Dmitry Vostokov, 2007

MEMORY.BMP
MEMORY.DMP
        1 file(s) copied.

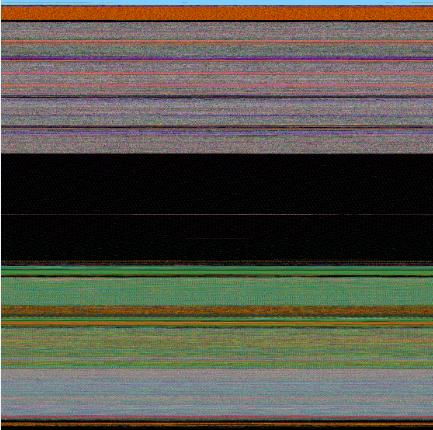
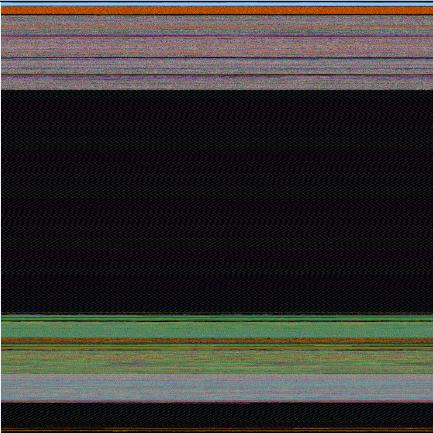
Below are some screenshots of bitmap files created by the tool. Think about them as visualized kernel or user address spaces. 

Vista kernel memory dump (8 bits-per-pixel):

Vista kernel memory dump (16 bits-per-pixel):

Vista kernel memory dump (24 bits-per-pixel):

Vista kernel memory dump (32 bits-per-pixel):

Notepad process user memory dump (8 bits-per-pixel):

Notepad process user memory dump (16 bits-per-pixel):

Notepad process user memory dump (24 bits-per-pixel):

Notepad process user memory dump (32 bits-per-pixel):

Mspaint process user memory dump (32 bits-per-pixel):

Mspaint process user memory dump after loading “Toco Toucan.jpg” from Vista Sample Pictures folder (32 bits-per-pixel):

Citrix ICA client process (wfica32.exe) user memory dump (32 bits-per-pixel):

Enjoy :-)

- Dmitry Vostokov @ DumpAnalysis.org -
Listening to Computer Memory

July 29th, 2007

An alternative to converting memory dumps to sound files is to save a memory range to a binary file and then convert it to a wave file. The latter is better for complete memory dumps which can be several Gb in size.

To save a memory range to a file use WinDbg .writemem command:

.writemem d2w-range.bin 00400000 00433000

or

.writemem d2w-range.bin 00400000 L200

I wrote a WinDbg script that saves a specified memory range and then calls a shell script which automatically converts saved binary file to a wave file and then runs whatever sound program is registered for .wav extension. On many systems it is Microsoft Media Player unless you installed any other third-party player.

The WinDbg script code (memsounds.txt):

.writemem d2w-range.bin ${$arg1} ${$arg2}
.if (${/d:$arg5})
{
  .shell -i- memsounds.cmd d2w-range ${$arg3} ${$arg4} ${$arg5}
}
.elsif (${/d:$arg4})
{
  .shell -i- memsounds.cmd d2w-range ${$arg3} ${$arg4}
}
.elsif (${/d:$arg3})
{
  .shell -i- memsounds.cmd d2w-range ${$arg3}
}
.else
{
  .shell -i- memsounds.cmd d2w-range
}

The shell script (memsounds.cmd):

dump2wave %1.bin %1.wav %2 %3 %4
%1.wav

Because WinDbg installation folder is assumed to be the default directory for both scripts and Dump2Wave.exe they should be copied to the same folder where windbg.exe is located. On my system it is

C:\Program Files\Debugging Tools for Windows

Both scripts are included in Dump2Wave package available for free download:

Dump2Wave package

To call the script from WinDbg use the following command:

$$>a< memsounds.txt Range [Freq] [Bits] [Channels]

where Range can be in Address1 Address2 or Address Lxxx format, Freq can be 44100, 22050, 11025 or 8000, Bits can be 8 or 16, Channels can be 1 or 2. By default it is 44100, 16, 2.

If you have a live debugging session or loaded a crash dump you can listen to a memory range immediately. For example, the range of memory from 00400000 to 00433000 interpreted as 44.1KHz 16bit stereo:

0:000> $$>a< memsounds.txt 00400000 00433000
Writing 33001 bytes...

C:\Program Files\Debugging Tools for Windows>dump2wave d2w-range.bin d2w-range.wav

Dump2Wave version 1.2.1
Written by Dmitry Vostokov, 2006

d2w-range.wav
d2w-range.bin
        1 file(s) copied.

C:\Program Files\Debugging Tools for Windows>d2w-range.wav
.shell: Process exited
0:000>

or the same range interpreted as 8KHz 8bit mono:

0:000> $$>a< memsounds.txt 00400000 00433000 8000 8 1
Writing 33001 bytes...

C:\Program Files\Debugging Tools for Windows>dump2wave d2w-range.bin d2w-range.wav 8000 8 1

Dump2Wave version 1.2.1
Written by Dmitry Vostokov, 2006

d2w-range.wav
d2w-range.bin
        1 file(s) copied.

C:\Program Files\Debugging Tools for Windows>d2w-range.wav
.shell: Process exited
0:000>

The script starts Windows Media Player on my system and I only need to push the play button to start listening.

Enjoy :-)

- Dmitry Vostokov @ DumpAnalysis.org -
Crash Dump Analysis Patterns (Part 9c)

July 28th, 2007

This is another variant of Deadlock pattern when we have mixed synchronization objects, for example, events and critical sections. An event may be used to signal the availability of some work item for processing it, the fact that the queue is not empty and a critical section may be used to protect some shared data. 

The typical deadlock scenario here is when one thread resets an event by calling WaitForSingleObject and tries to acquire a critical section. In the mean time the second thread has already acquired that critical section and now is waiting for the event to be set:

Thread A     |  Thread B
..           |  ..
reset Event  |  ..
..           |  acquire CS
wait for CS  |  ..
             |  wait for Event

The classical fix to this bug is to acquire the critical section and wait for the event in the same order in both threads.

In our example crash dump we can easily identify the second thread that acquied the critical section and is waiting for the event 0×480:

0:000> !locks

CritSec ntdll!LdrpLoaderLock+0 at 7c889d94
WaiterWoken        No
LockCount          9
RecursionCount     1
OwningThread       2038
EntryCount         0
ContentionCount    164
*** Locked

  13  Id: 590.2038 Suspend: 1 Teb: 7ffaa000 Unfrozen
ChildEBP RetAddr  Args to Child
0483fd5c 7c822124 77e6bad8 00000480 00000000 ntdll!KiFastSystemCallRet
0483fd60 77e6bad8 00000480 00000000 00000000 ntdll!NtWaitForSingleObject+0xc
0483fdd0 77e6ba42 00000480 ffffffff 00000000 kernel32!WaitForSingleObjectEx+0xac
0483fde4 776cfb30 00000480 ffffffff 777904f8 kernel32!WaitForSingleObject+0×12
0483fe00 776adfaa 00000480 00000000 00000080 ole32!CDllHost::ClientCleanupFinish+0×2a
0483fe2c 776adf1a 00000000 0483fe7c 77790828 ole32!DllHostProcessUninitialize+0×80
0483fe4c 776b063f 00000000 00000000 0c9ecee0 ole32!ApartmentUninitialize+0xf8
0483fe64 776b06e3 0483fe7c 00000000 00000001 ole32!wCoUninitialize+0×48
0483fe80 776e43f5 00000001 77670000 776afef0 ole32!CoUninitialize+0×65
0483fe8c 776afef0 0483feb4 776b5cb8 77670000 ole32!DoThreadSpecificCleanup+0×63
0483fe94 776b5cb8 77670000 00000003 00000000 ole32!ThreadNotification+0×37
0483feb4 776b5c1b 77670000 00000003 00000000 ole32!DllMain+0×176
0483fed4 7c82257a 77670000 00000003 00000000 ole32!_DllMainCRTStartup+0×52
0483fef4 7c83c195 776b5bd3 77670000 00000003 ntdll!LdrpCallInitRoutine+0×14
0483ffa8 77e661d6 00000000 00000000 0483ffec ntdll!LdrShutdownThread+0xd2
0483ffb8 77e66090 00000000 00000000 00000000 kernel32!ExitThread+0×2f
0483ffec 00000000 77c5de6d 0ab24f68 00000000 kernel32!BaseThreadStart+0×39

0:000> !handle 480 ff
Handle 00000480
  Type          Event
  Attributes    0
  GrantedAccess 0×1f0003:
         Delete,ReadControl,WriteDac,WriteOwner,Synch
         QueryState,ModifyState
  HandleCount   2
  PointerCount  4
  Name          <none>
  No object specific information available

It is difficult to find the first thread, the one which has reset the event and is waiting for the critical section. In our dump we have 9 such threads from !locks command output:

LockCount          9

Event as a synchronization primitive doesn’t have an owner. Despite this we can try to find 0×480 and WaitForSingleObject address near on some other thread raw stack if that information wasn’t overwritten. Let’s do a memory search:

0:000> s -d 0 L4000000 00000480
000726ec 00000480 00000022 000004a4 00000056
008512a0 00000480 00000480 00000000 00000000
008512a4 00000480 00000000 00000000 01014220
0085ab68 00000480 00000480 00000092 00000000
0085ab6c 00000480 00000092 00000000 01014234
00eb12a0 00000480 00000480 00000000 00000000
00eb12a4 00000480 00000000 00000000 0101e614
00ebeb68 00000480 00000480 00000323 00000000
00ebeb6c 00000480 00000323 00000000 0101e644
03ffb4fc 00000480 d772c13b ce753966 00fa840f
040212a0 00000480 00000480 00000000 00000000
040212a4 00000480 00000000 00000000 01063afc
0402ab68 00000480 00000480 00000fb6 00000000
0402ab6c 00000480 00000fb6 00000000 01063b5c
041312a0 00000480 00000480 00000000 00000000
041312a4 00000480 00000000 00000000 01065b28
0413eb68 00000480 00000480 00001007 00000000
0413eb6c 00000480 00001007 00000000 01065b7c
043412a0 00000480 00000480 00000000 00000000
043412a4 00000480 00000000 00000000 01066b44
0434ab68 00000480 00000480 00001033 00000000
0434ab6c 00000480 00001033 00000000 01066b9c
0483fd68 00000480 00000000 00000000 00000000
0483fdd8 00000480 ffffffff 00000000 0483fe00
0483fdec 00000480 ffffffff 777904f8 77790738
0483fe08 00000480 00000000 00000080 776b0070
0483fe20 00000480 00000000 00000000 0483fe4c

05296f58 00000480 ffffffff ffffffff ffffffff
05297eb0 00000480 00000494 000004a4 000004c0
0557cf9c 00000480 00000000 00000000 00000000
05580adc 00000480 00000000 00000000 00000000
0558715c 00000480 00000000 00000000 00000000
0558d3cc 00000480 00000000 00000000 00000000
0559363c 00000480 00000000 00000000 00000000
0559ee0c 00000480 00000000 00000000 00000000
055a507c 00000480 00000000 00000000 00000000
056768ec 00000480 00000000 00000000 00000000
0568ef14 00000480 00000000 00000000 00000000
0581ff88 00000480 07ca7ee0 0581ff98 776cf2a3
05ed1260 00000480 00000480 00000000 00000000
05ed1264 00000480 00000000 00000000 01276efc
05ed8b68 00000480 00000480 00005c18 00000000
05ed8b6c 00000480 00005c18 00000000 01276f74
08f112a0 00000480 00000480 00000000 00000000
08f112a4 00000480 00000000 00000000 00000000
08f1ab68 00000480 00000480 00007732 00000000
08f1ab6c 00000480 00007732 00000000 01352db0

In blue color I highlighted the thread #13 raw stack occurrences and in red color I highlighted memory locations that belong to another thread raw stack. In fact, these are the only memory locations from search results that make any sense from code perspective. The only meaningful stack traces can be found in memory locations highlighted in blue and red above.

This can be seen if we feed search results to WinDbg dds command (not all output is shown for clarity):

0:000> .foreach (place { s-[1]d 0 L4000000 00000480 }) { dds place -30; .printf "\n" }
000726bc  00000390
000726c0  00000022
000726c4  000003b4
000726c8  00000056
000726cc  00000004
000726d0  6dc3f6fd
000726d4  0000040c
000726d8  0000001e
000726dc  0000042c
000726e0  00000052
000726e4  00000004
000726e8  eacb0f6d
000726ec  00000480
000726f0  00000022
000726f4  000004a4
000726f8  00000056
000726fc  00000004
00072700  62b796d2
00072704  000004fc
00072708  0000001e
0007270c  0000051c
00072710  00000052
00072714  00000004
00072718  2a615cff
0007271c  00000570
00072720  00000024
00072724  00000598
00072728  00000058
0007272c  00000004
00072730  51913e59
00072734  000005f0
00072738  00000016
...
...
...
0568eee4  05680008 xpsp2res+0x1b0008
0568eee8  01200000
0568eeec  00001010
0568eef0  00200001
0568eef4  00000468
0568eef8  00000121
0568eefc  00000000
0568ef00  00000028
0568ef04  00000030
0568ef08  00000060
0568ef0c  00040001
0568ef10  00000000
0568ef14  00000480
0568ef18  00000000
0568ef1c  00000000
0568ef20  00000000
0568ef24  00000000
0568ef28  00000000
0568ef2c  00800000
0568ef30  00008000
0568ef34  00808000
0568ef38  00000080
0568ef3c  00800080
0568ef40  00008080
0568ef44  00808080
0568ef48  00c0c0c0
0568ef4c  00ff0000
0568ef50  0000ff00
0568ef54  00ffff00
0568ef58  000000ff
0568ef5c  00ff00ff
0568ef60  0000ffff

0581ff58  0581ff70
0581ff5c  776b063f ole32!wCoUninitialize+0x48
0581ff60  00000001
0581ff64  00007530
0581ff68  77790438 ole32!gATHost
0581ff6c  00000000
0581ff70  0581ff90
0581ff74  776cf370 ole32!CDllHost::WorkerThread+0xdd
0581ff78  0581ff8c
0581ff7c  00000001
0581ff80  77e6ba50 kernel32!WaitForSingleObjectEx
0581ff84  0657cfe8
0581ff88  00000480

0581ff8c  07ca7ee0
0581ff90  0581ff98
0581ff94  776cf2a3 ole32!DLLHostThreadEntry+0xd
0581ff98  0581ffb8
0581ff9c  776b2307 ole32!CRpcThread::WorkerLoop+0×1e
0581ffa0  77790438 ole32!gATHost
0581ffa4  00000000
0581ffa8  0657cfe8
0581ffac  77670000 ole32!_imp__InstallApplication <PERF> (ole32+0×0)
0581ffb0  776b2374 ole32!CRpcThreadCache::RpcWorkerThreadEntry+0×20
0581ffb4  00000000
0581ffb8  0581ffec
0581ffbc  77e6608b kernel32!BaseThreadStart+0×34
0581ffc0  0657cfe8
0581ffc4  00000000
0581ffc8  00000000
0581ffcc  0657cfe8
0581ffd0  3cfb5963
0581ffd4  0581ffc4

05ed1230  0101f070
05ed1234  05ed1274
05ed1238  05ed1174
05ed123c  05ed0000
05ed1240  05ed1280
05ed1244  00000000
05ed1248  00000000
05ed124c  00000000
05ed1250  05ed8b80
05ed1254  05ed8000
05ed1258  00002000
05ed125c  00001000
05ed1260  00000480
05ed1264  00000480
05ed1268  00000000
05ed126c  00000000
05ed1270  01276efc
05ed1274  05ed12b4
05ed1278  05ed1234
05ed127c  05ed0000
05ed1280  05ed2d00
05ed1284  05ed1240
05ed1288  05ed1400
05ed128c  00000000
05ed1290  05edade0
05ed1294  05eda000
05ed1298  00002000
05ed129c  00001000
05ed12a0  00000220
05ed12a4  00000220
05ed12a8  00000000
05ed12ac  00000000
...
...
...
08f1ab3c  00000000
08f1ab40  00000000
08f1ab44  00000000
08f1ab48  00000000
08f1ab4c  00000000
08f1ab50  00000000
08f1ab54  00000000
08f1ab58  00000000
08f1ab5c  00000000
08f1ab60  abcdbbbb
08f1ab64  08f11000
08f1ab68  00000480
08f1ab6c  00000480
08f1ab70  00007732
08f1ab74  00000000
08f1ab78  01352db0
08f1ab7c  dcbabbbb
08f1ab80  ffffffff
08f1ab84  c0c00ac1
08f1ab88  00000000
08f1ab8c  c0c0c0c0
08f1ab90  c0c0c0c0
08f1ab94  c0c0c0c0
08f1ab98  c0c0c0c0
08f1ab9c  c0c0c0c0
08f1aba0  c0c0c0c0
08f1aba4  ffffffff
08f1aba8  c0c00ac1
08f1abac  00000000
08f1abb0  c0c0c0c0
08f1abb4  c0c0c0c0
08f1abb8  c0c0c0c0

We see that address 0581ff88 is the most meaningful and it also has WaitForSingleObjectEx nearby. This address belongs to the raw stack of the following thread #16:

  16  Id: 590.1a00 Suspend: 1 Teb: 7ffa9000 Unfrozen
ChildEBP RetAddr
0581fc98 7c822124 ntdll!KiFastSystemCallRet
0581fc9c 7c83970f ntdll!NtWaitForSingleObject+0xc
0581fcd8 7c839620 ntdll!RtlpWaitOnCriticalSection+0x19c
0581fcf8 7c83a023 ntdll!RtlEnterCriticalSection+0xa8
0581fe00 77e67bcd ntdll!LdrUnloadDll+0x35
0581fe14 776b46fb kernel32!FreeLibrary+0x41
0581fe20 776b470f ole32!CClassCache::CDllPathEntry::CFinishObject::Finish+0x2f
0581fe34 776b44a0 ole32!CClassCache::CFinishComposite::Finish+0x1d
0581ff0c 776b0bfd ole32!CClassCache::CleanUpDllsForApartment+0x1d0
0581ff38 776b0b1f ole32!FinishShutdown+0xd7
0581ff58 776b063f ole32!ApartmentUninitialize+0x94
0581ff70 776cf370 ole32!wCoUninitialize+0x48
0581ff90 776cf2a3 ole32!CDllHost::WorkerThread+0xdd
0581ff98 776b2307 ole32!DLLHostThreadEntry+0xd
0581ffac 776b2374 ole32!CRpcThread::WorkerLoop+0×1e
0581ffb8 77e6608b ole32!CRpcThreadCache::RpcWorkerThreadEntry+0×20
0581ffec 00000000 kernel32!BaseThreadStart+0×34

And if we disassemble ole32!CRpcThread::WorkerLoop function which is found below WaitForSingleObjectEx on both stack trace and raw stack data from search results we would see that the former function calls the latter function indeed:

0:000> uf ole32!CRpcThread::WorkerLoop
ole32!CRpcThread::WorkerLoop:
776b22e9 mov     edi,edi
776b22eb push    esi
776b22ec mov     esi,ecx
776b22ee cmp     dword ptr [esi+4],0
776b22f2 jne     ole32!CRpcThread::WorkerLoop+0x67 (776b234d)

ole32!CRpcThread::WorkerLoop+0xb:
776b22f4 push    ebx
776b22f5 push    edi
776b22f6 mov     edi,dword ptr [ole32!_imp__WaitForSingleObjectEx (77671304)]
776b22fc mov     ebx,7530h

ole32!CRpcThread::WorkerLoop+0x18:
776b2301 push    dword ptr [esi+0Ch]
776b2304 call    dword ptr [esi+8]
776b2307 call    dword ptr [ole32!_imp__GetCurrentThread (7767130c)]
776b230d push    eax
776b230e call    dword ptr [ole32!_imp__RtlCheckForOrphanedCriticalSections (77671564)]
776b2314 xor     eax,eax
776b2316 cmp     dword ptr [esi],eax
776b2318 mov     dword ptr [esi+8],eax
776b231b mov     dword ptr [esi+0Ch],eax
776b231e je      ole32!CRpcThread::WorkerLoop+0x65 (776b234b)

ole32!CRpcThread::WorkerLoop+0x37:
776b2320 push    esi
776b2321 mov     ecx,offset ole32!gRpcThreadCache (7778fc28)
776b2326 call    ole32!CRpcThreadCache::AddToFreeList (776de78d)

ole32!CRpcThread::WorkerLoop+0x55:
776b232b push    0
776b232d push    ebx
776b232e push    dword ptr [esi]
776b2330 call    edi

776b2332 test    eax,eax
776b2334 je      ole32!CRpcThread::WorkerLoop+0×60 (776cf3be)

ole32!CRpcThread::WorkerLoop+0x44:
776b233a push    esi
776b233b mov     ecx,offset ole32!gRpcThreadCache (7778fc28)
776b2340 call    ole32!CRpcThreadCache::RemoveFromFreeList (776e42de)
776b2345 cmp     dword ptr [esi+4],0
776b2349 je      ole32!CRpcThread::WorkerLoop+0x55 (776b232b)

ole32!CRpcThread::WorkerLoop+0x65:
776b234b pop     edi
776b234c pop     ebx

ole32!CRpcThread::WorkerLoop+0x67:
776b234d pop     esi
776b234e ret

ole32!CRpcThread::WorkerLoop+0x60:
776cf3be cmp     dword ptr [esi+4],eax
776cf3c1 je      ole32!CRpcThread::WorkerLoop+0x18 (776b2301)

ole32!CRpcThread::WorkerLoop+0x69:
776cf3c7 jmp     ole32!CRpcThread::WorkerLoop+0x65 (776b234b)

Therefore we have possibly identified the thread #16 that resets the event by calling WaitForSingleObjectEx and tries to acquire the critical section. We also know the second thread #13 that has already acquired that critical section and now is waiting for the event to be signaled.

- Dmitry Vostokov @ DumpAnalysis.org -