Archive for the ‘Tools’ Category
Monday, September 28th, 2009
Every PID has its twitter account. Processes emit short trace messages (STM) and others subscribe to them. This is the technical support of the future, the concept of SoftWeet (*):
www.SoftWeet.com
(*) to weet
to know; to wit (archaic)
- Dmitry Vostokov @ DumpAnalysis.org -
Posted in Announcements, Debugged! MZ/PE, Debugging, Software Architecture, Software Engineering, Software Technical Support, Software Trace Analysis, Tools, Troubleshooting Methodology | 1 Comment »
Saturday, September 26th, 2009
This is a revised, edited, cross-referenced and thematically organized volume of selected DumpAnalysis.org blog posts about crash dump analysis and debugging written in October 2008 - June 2009 for software engineers developing and maintaining products on Windows platforms, quality assurance engineers testing software on Windows platforms and technical support and escalation engineers dealing with complex software issues. The third volume features:
- 15 new crash dump analysis patterns
- 29 new pattern interaction case studies
- Trace analysis patterns
- Updated checklist
- Fully cross-referenced with Volume 1 and Volume 2
- New appendixes
Product information:
- Title: Memory Dump Analysis Anthology, Volume 3
- Author: Dmitry Vostokov
- Language: English
- Product Dimensions: 22.86 x 15.24
- Paperback: 404 pages
- Publisher: Opentask (20 December 2009)
- ISBN-13: 978-1-906717-43-8
- Hardcover: 404 pages
- Publisher: Opentask (30 January 2010)
- ISBN-13: 978-1-906717-44-5

Back cover features 3D computer memory visualization image.
- Dmitry Vostokov @ DumpAnalysis.org -
Posted in Announcements, AntiPatterns, Art, Assembly Language, Books, C and C++, CDF Analysis Tips and Tricks, Certification, Citrix, Code Reading, Common Mistakes, Computational Ghosts and Bug Hauntings, Computer Science, Countefactual Debugging, Crash Dump Analysis, Crash Dump Patterns, Crash Dumps for Dummies, DebugWare Patterns, Debugging, Debugging Slang, Deep Down C++, Education and Research, Escalation Engineering, Fun with Crash Dumps, Futuristic Memory Dump Analysis, Games for Debugging, Hardware, Horrors of Computation, Hyper-V, Intelligent Memory Movement, Kernel Development, Mathematics of Debugging, Memiotics (Memory Semiotics), Memoidealism, Memoretics, Memory Analysis Culture, Memory Analysis Forensics and Intelligence, Memory Dreams, Memory Dump Analysis Jobs, Memory Space Music, Memory Visualization, Memuonics, Minidump Analysis, Multithreading, Music for Debugging, New Acronyms, New Words, Occult Debugging, Philosophy, Poetry, Psi-computation, Publishing, Science of Memory Dump Analysis, Science of Software Tracing, Security, Software Architecture, Software Defect Construction, Software Engineering, Software Generalist, Software Narratology, Software Technical Support, Software Trace Analysis, Software Tracing for Dummies, Testing, Tools, Trace Analysis Patterns, Training and Seminars, Troubleshooting Methodology, Virtualization, Vista, Visual Dump Analysis, WinDbg Scripts, WinDbg Tips and Tricks, WinDbg for GDB Users, Windows 7, Windows Server 2008, Windows System Administration | No Comments »
Saturday, September 26th, 2009
DumpAnalysis.org accepts hardware such as laptops for reviewing in relation to their suitability for extreme debugging, virtualization, trace analysis, computer forensics, memory dump analysis, visualization and auralization. If you work for a H/W company like HP, Apple, Dell, Acer, Sony or any other respectable manufacturer please don’t hesitate to forward this post to your management: it could be your company brand or laptop model that debugging and software technical support community chooses next time of upgrade or for T&D / R&D! H/W reviews will be posted on the main portal page which currently has an audience of more than 200,000 unique visitors per year from more than 30,000 network locations (*).
If your company is interested please don’t hesitate to use this contact form:
http://www.dumpanalysis.org/contact
(*) From Google Analytics report.
- Dmitry Vostokov @ DumpAnalysis.org -
Posted in Announcements, Crash Dump Analysis, Debugging, Hardware, Memory Analysis Forensics and Intelligence, Memory Auralization, Memory Visualization, Security, Software Engineering, Software Technical Support, Software Trace Analysis, Testing, Tools, Virtualization, Vista, Visual Dump Analysis, Windows 7, Windows Server 2008, Windows System Administration | No Comments »
Thursday, September 24th, 2009
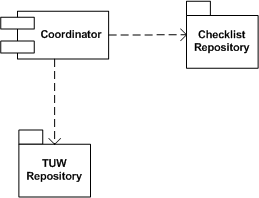
Real troubleshooting is usually done by combining several units of work chosen from a manual. Checklist pattern summarizes this recurrent practice. Checklist Coordinator orchestrates troubleshooting units of work (TUWs) components from TUW Repository according to checklists from Checklist Repository (in the simple case it can be just one checklist). This is illustrated on the following UML component diagram:
- Dmitry Vostokov @ DumpAnalysis.org -
Posted in DebugWare Patterns, Debugging, Software Architecture, Software Technical Support, Tools, Troubleshooting Methodology | 2 Comments »
Tuesday, September 22nd, 2009
Citrix released the powerful GUI CDF trace analyzer tool that can work with hundred Mb trace files with millions of trace messages:
http://support.citrix.com/article/CTX122741
I use it on day-to-day basis while analyzing CDF traces from terminal services environments and highly recommend. Its ability to quick filter out modules is indispensable when dealing with messages from hundreds of processes and thousands of threads. I haven’t tried it yet with MS TMF files though.
- Dmitry Vostokov @ DumpAnalysis.org -
Posted in Announcements, CDF Analysis Tips and Tricks, Citrix, Debugging, Software Technical Support, Software Trace Analysis, Tools, Trace Analysis Patterns | 1 Comment »
Monday, September 21st, 2009
Troubleshooting Unit of Work is another pattern frequently used in manual troubleshooting and debugging. This is usually some independent and self-sufficient list of steps to perform to check something from a troubleshooting checklist or a manual and can be implemented as a separate loadable module, a class to reuse or a function to call. Output from such units of work can be stored in a blackboard system or processed by tools implementing Checklist DebugWare pattern. Typical example is an implementation of the following document:
Required Permissions and Rights for the Ctx_CpsvcUser Account
as a tool:
CTX_CpsvcUser Re-creation Tool for 32-Bit and 64-Bit Versions of Presentation Server 4.5
- Dmitry Vostokov @ DumpAnalysis.org -
Posted in DebugWare Patterns, Debugging, Software Architecture, Software Technical Support, Tools, Troubleshooting Methodology | 3 Comments »
Thursday, September 10th, 2009
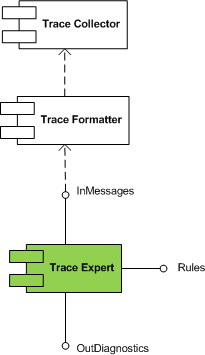
Trace Expert pattern came to my mind when I was writing about software trace patterns. It is a very lightweight expert system relying on trace collector and trace formatter (patterns to be written about soon). It is a module that takes a preformatted software trace message file or a buffer and a set of built in rules and uses simple search (peharps involving regular expressions) to dig out diagnostic information and provide troubleshooting and debugging directions.
This module is schematically depicted on the following UML component diagram:
- Dmitry Vostokov @ DumpAnalysis.org -
Posted in DebugWare Patterns, Debugging, Software Architecture, Software Technical Support, Software Trace Analysis, Tools, Trace Analysis Patterns, Troubleshooting Methodology | No Comments »
Tuesday, September 8th, 2009
Responding to numerous requests and suggestions I plan to make magazine interior excluding promotional vouchers available for free download. If someone needs covers including back covers where I put tips and tables to be used as posters or certification vouchers printed inside then they should buy the magazine from Amazon or other bookshops.
This initiative will be accompanied by a smart marketing trick that I plan to unveil in a few days together with the magazine website.
- Dmitry Vostokov @ DumpAnalysis.org -
Posted in Announcements, Books, Crash Dump Analysis, Debugged! MZ/PE, Debugging, Education and Research, Publishing, Security, Software Engineering, Software Technical Support, Software Trace Analysis, Testing, Tools, Training and Seminars | 1 Comment »
Wednesday, August 12th, 2009
Previously introduced RADII software development process acquires definite shape as a product supportability driven software support tools development process. In summary, supportability of a product gives rise to Requirements, they expand into Architecture segments, then into Design segments, then into Implementation segments, and finally, into several Improvement phases. In short, RADII:
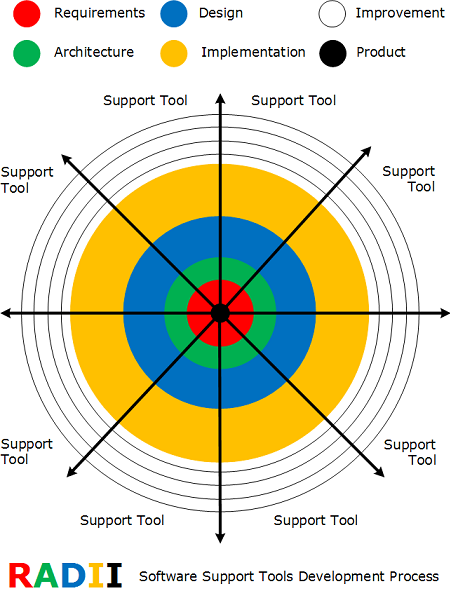
Every segment is a separate troubleshooting or debugging tool. All segments share elements of RADII via DebugWare patterns and can be further refined via iterative and incremental SDLC if needed.
- Dmitry Vostokov @ DumpAnalysis.org -
Posted in Announcements, DebugWare Patterns, Software Architecture, Software Engineering, Tools | 1 Comment »
Saturday, August 8th, 2009
The digital version of the book is finally available:
x64 Windows Debugging: Practical Foundations
Paperback should be available in 1-2 weeks on Amazon and other stores. When working on the book I fixed errors in the previous x86 version. Errata file for it should be available tomorrow.
- Dmitry Vostokov @ DumpAnalysis.org -
Posted in Announcements, Assembly Language, Books, C and C++, Certification, Code Reading, Crash Dump Analysis, Debugging, Education and Research, Memory Dump Analysis Jobs, Publishing, Security, Software Engineering, Software Technical Support, Testing, Tools, Training and Seminars, Vista, Windows 7, Windows Server 2008 | No Comments »
Friday, August 7th, 2009
While I was listening to Klaus Schulze In Blue album a colleague sent me the link to a tool that reconstructs blue screens from minidumps (small memory dumps):
BlueScreenView (written by Nir Sofer)
I immediately downloaded it at it works even with kernel dumps but without pointing to a module that triggered the bugcheck (it shows modules for minidumps):
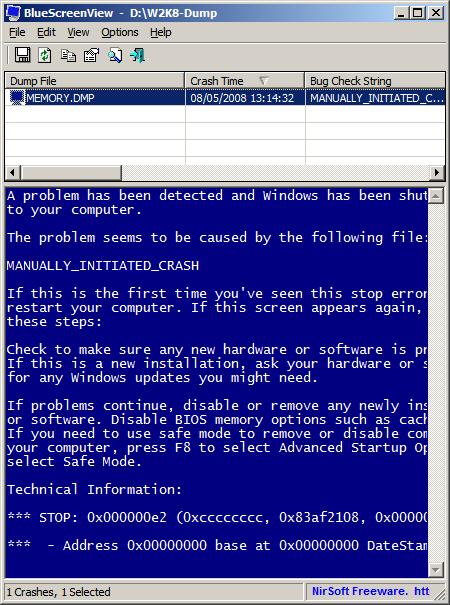
It ignores memory dumps and minidumps from x64 Windows so the next version I hope should do it 
PS. Long time ago I was thinking about writing a kernel driver that saves BSOD screen and embeds it in a memory dump.
- Dmitry Vostokov @ DumpAnalysis.org -
Posted in Announcements, Crash Dump Analysis, Crash Dumps for Dummies, Fun with Crash Dumps, Minidump Analysis, Software Technical Support, Tools, Windows System Administration | No Comments »
Tuesday, August 4th, 2009
OpenTask plans to expand its Practical Foundations series and publish the following 2 books for the forthcoming Memory Dump Analysis Fundamentals certification (Unix track) being developed by Memory Analysis and Debugging Institute:
Linux, FreeBSD and Mac OS X Debugging: Practical Foundations (ISBN: 978-1906717773)
64-bit Linux, FreeBSD and Mac OS X Debugging: Practical Foundations (ISBN: 978-1906717780)
- Dmitry Vostokov @ DumpAnalysis.org -
Posted in Announcements, Assembly Language, Books, Certification, Crash Dump Analysis, Debugging, Education and Research, FreeBSD Crash Corner, GDB for WinDbg Users, Linux Crash Corner, Mac Crash Corner, Memory Dump Analysis Jobs, Publishing, Software Engineering, Software Technical Support, Testing, Tools, Training and Seminars | No Comments »
Friday, July 31st, 2009
Mark Russinovich and Bryce Cogswell published a graphical virtual memory visualization tool: VMMap. Since more and more tools appear I attempted to classify them into 2 major categories or memory views they can provide:
1. Traditional or synthetic memory visualization tools: show derived characteristics, like colors or computed values and graphs, from memory ranges.
2. Natural memory visualization tools: treat memory as a bitmap but can also include image annotations. Image annotation was one of my main interests when I worked at Accusoft (now Accusoft Pegasus) a decade ago.
- Dmitry Vostokov @ DumpAnalysis.org -
Posted in Debugging, Memory Visualization, Tools | 1 Comment »
Thursday, July 23rd, 2009
Finally the issue is available on Amazon and through other sellers:
Debugged! MZ/PE: Modeling Software Defects

I’m now planning the September issue and post details later.
- Dmitry Vostokov @ DumpAnalysis.org -
Posted in Announcements, Books, Certification, Citrix, Crash Dump Analysis, Debugged! MZ/PE, Debugging, Education and Research, Publishing, Software Defect Construction, Software Engineering, Software Technical Support, Testing, Tools, Training and Seminars, Troubleshooting Methodology, WinDbg Tips and Tricks | No Comments »
Thursday, July 23rd, 2009
Jamie Fenton has finally made available for beta testing fantastic memory visualization system HayWire & Barn Burner I use often for mining curious pictures from virtual memory space, like “cosmic rays“. Besides providing artistic pleasure, real-time natural memory visualization can have other applications including visual debugging. Looking forward to seeing more wonders in this area of research!
- Dmitry Vostokov @ DumpAnalysis.org -
Posted in Announcements, Crash Dump Analysis, Debugging, Education and Research, Fun with Crash Dumps, Futuristic Memory Dump Analysis, Memory Visualization, Tools | 2 Comments »
Friday, July 17th, 2009
I resumed this week my reading notebook on Software Generalist blog with a top priority book to read every working day: Windows Internals, 5th edition. In reading notes I put what I find interesting for me (at this time) or related to Windows memory dump analysis or debugging and troubleshooting in general. For the latter case, sometimes I put additional references or even WinDbg examples from user, kernel and complete memory dumps in full color. Hope you find these notes useful too.
- Dmitry Vostokov @ DumpAnalysis.org -
Posted in Announcements, Books, Crash Dump Analysis, Debugging, Kernel Development, Reading Notebook, Software Architecture, Software Technical Support, Tools, Vista, Windows Server 2008 | No Comments »
Monday, July 13th, 2009
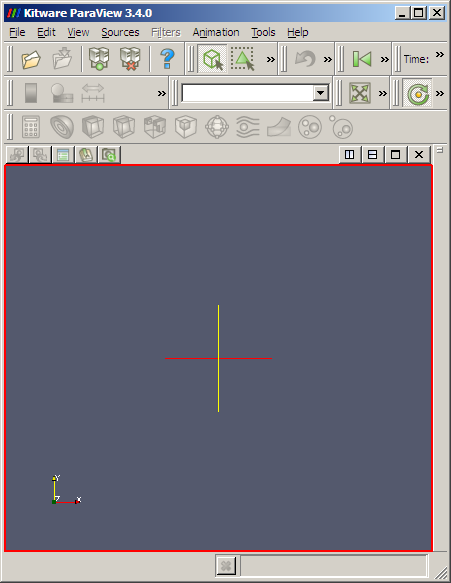
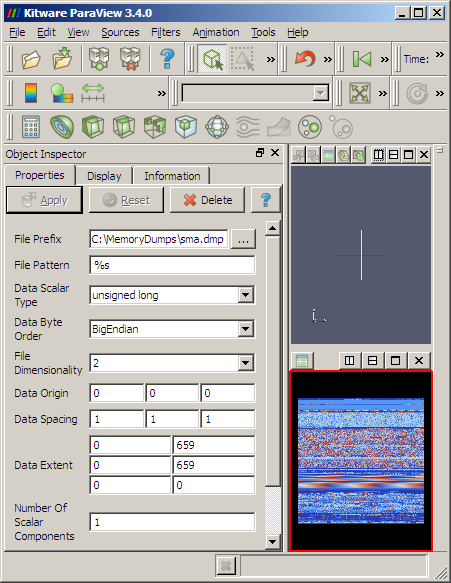
In this part we see how we can load memory dumps into ParaView data analysis and visualization system. First we need to download the latest version from here. If we have a memory dump we need first to calculate its dimensions and for a square we can use this simple formula: (int)sqrt(file_size/4). For example, the dump file I use here has the size of 1,746,853 bytes, therefore we have 660×660.
1. Launch ParaView:
2. Go to File \ Open and select All Files (*.*) and choose your .dmp file. The following dialog appears:
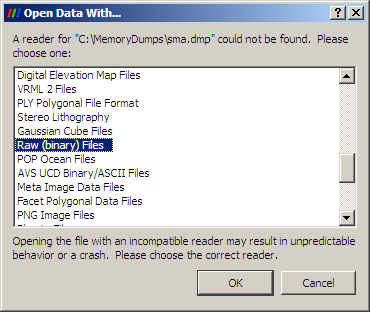
Choose Raw (binary) Files option.
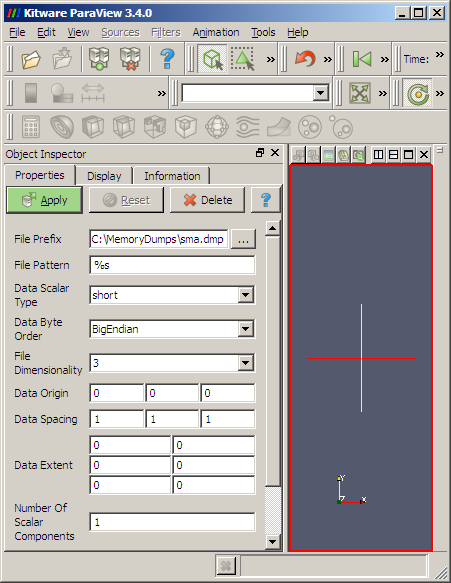
3. If nothing changes on the screen go to View menu and select Object Inspector. The following panel should appear:
4. Here we should carefully specify parameters for our dump file:
Data Scalar Type: unsigned long
File Dimensionality: 2
Data Extent:
0 659
0 659
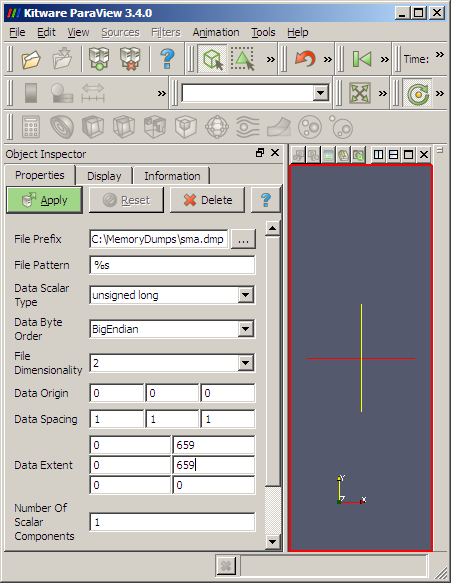
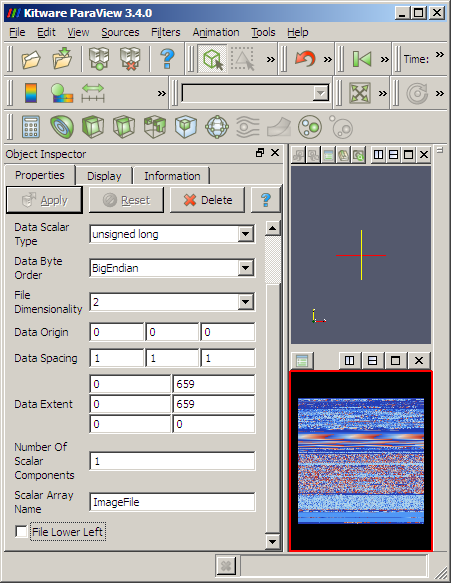
5. We then Apply and get the dump loaded:
6. We might want to uncheck File Lower Left at the bottom of the Object Inspector properties to get lower memory addresses start from the left-top corner of the image:
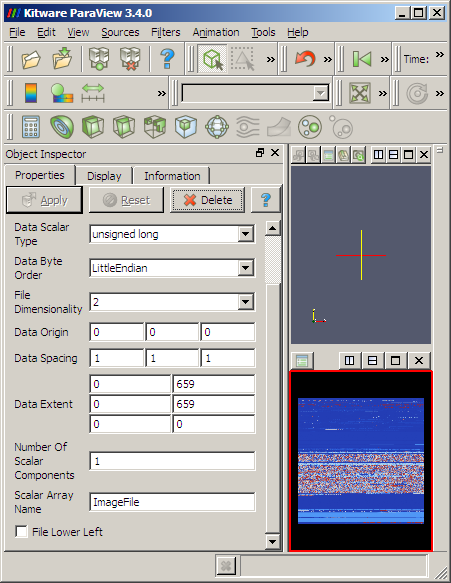
7. Also Data Byte Order LittleEndian obviously changes the color of RGB triplets or RGBA quadruplets but the large scale structure remains the same:
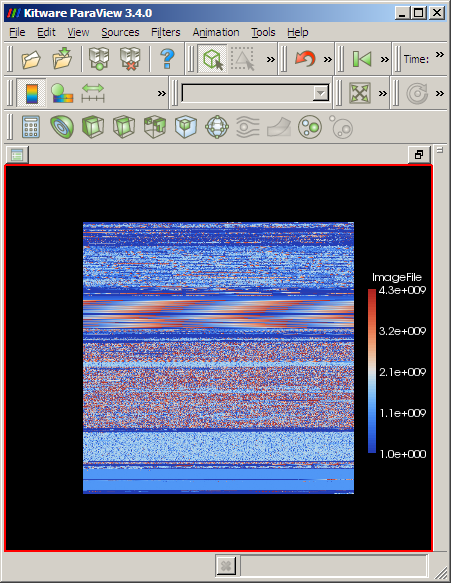
8. We can select View \ Show Color Legend to see how unsigned long values from the dump file are mapped continuously to colors:
I prefer to choose BigEndian because we get similar layout as we get from ImageMagick RGBA conversion or from Dump2Picture:

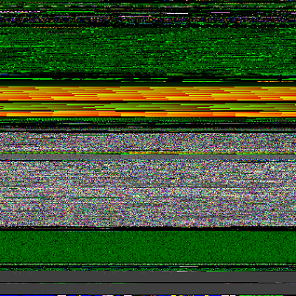
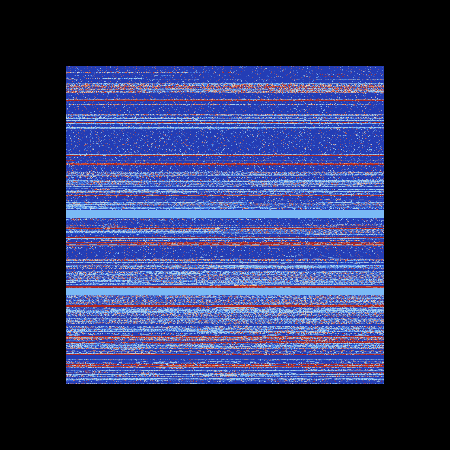
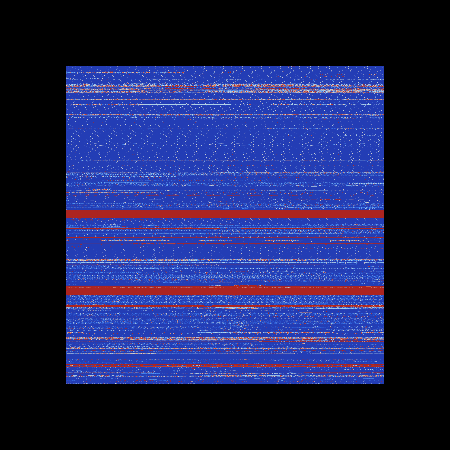
9. ParaView can even load large dumps, for example, this is a screenshot of 1.5Gb dump in big endian and little endian byte orderings respectively:
- Dmitry Vostokov @ DumpAnalysis.org -
Posted in Fun with Crash Dumps, Memory Visualization, Tools | 3 Comments »
Sunday, July 12th, 2009
The second issue of the magazine was put into production today and should be available after one or two weeks on Amazon, B&N and other booksellers worldwide.

Title: Debugged! MZ/PE: Modeling Software Defects
Authors: Konstantin Chebotarev, Kapildev Ramlal, Dmitry Vostokov
ISBN: 1906717680
ISBN-13: 978-1906717681
Annotation: Welcome to the second issue of Debugged! MZ/PE magazine! It brings fault injection into new light and features articles discussing software defect construction via DLL injection, modeling CPU spikes and runaway exception processing. This issue also includes a memory dump analysis certification voucher. Back cover features WinDbg breakpoint and tracing command summary for easy desk reference. - Dmitry Vostokov - Editor-in-Chief
- Dmitry Vostokov @ DumpAnalysis.org -
Posted in Announcements, Books, Certification, Citrix, Crash Dump Analysis, Debugged! MZ/PE, Debugging, Education and Research, Publishing, Software Defect Construction, Software Engineering, Software Technical Support, Testing, Tools, Training and Seminars, Troubleshooting Methodology, WinDbg Tips and Tricks | No Comments »
Wednesday, July 8th, 2009
If we want to use gflags.exe to enable page heap settings (or any other image file execution options) for a 32-bit executable running on x64 Windows we should use 32-bit version of gflags.exe from 32-bit Debugging Tools for Windows (see windbg.org for quick download links) or if we want to set appropriate registry key manually we should use Wow6432Node branch:
HKEY_LOCAL_MACHINE\SOFTWARE\Wow6432Node\Microsoft\Windows NT\CurrentVersion\Image File Execution Options\<process name with .exe extension>
Name: GlobalFlag

Type: REG_DWORD

Value: 0x02000000
Name: PageHeapFlags

Type: REG_DWORD

Value: 0x00000003
- Dmitry Vostokov @ DumpAnalysis.org -
Posted in Crash Dump Analysis, Debugging, Software Technical Support, Testing, Tools | 4 Comments »
Saturday, July 4th, 2009
Got it in the post yesterday shipped via courier from Amazon:
Windows® Internals: Including Windows Server 2008 and Windows Vista, Fifth Edition (PRO-Developer)

I originally expected it to be a paperback book but as a publisher myself I welcome the final MS Press decision to make it a hardcover. It is more solid. I plan to read it from cover to cover again, starting from tomorrow. I would like to thank authors for including the reference to www.dumpanalysis.org in the conclusion part of the last chapter 14 dedicated to crash dump analysis. This came as a nice surprise for me and I’m going to install a special plaque in the office and put its picture later on my blog.
- Dmitry Vostokov @ DumpAnalysis.org -
Posted in Announcements, Books, Certification, Crash Dump Analysis, Debugging, Software Architecture, Software Technical Support, Tools, Vista, Windows Server 2008, Windows System Administration | 4 Comments »