Archive for the ‘Tools’ Category

Dumping Vista

Sunday, February 4th, 2007

32-bit Vista

If you need to dump a running 32-bit Vista system you can do it with Citrix SystemDump tool. You just need to run it with elevated administrator rights:

  • right click SystemDump.exe in appropriate Computer explorer folder and choose “Run as administrator”

  • if you use command line options run SystemDump.exe from elevated command prompt (Start -> All Programs -> Accessories, right click Command Prompt, and then select “Run as administrator”)

Here is a screenshot before dumping my Vista and WinDbg output from saved kernel dump:

Loading Dump File [C:\Windows\MEMORY.DMP]
Kernel Summary Dump File: Only kernel address space is available
Windows Vista Kernel Version 6000 UP Free x86 compatible
Product: WinNt, suite: TerminalServer SingleUserTS
Built by: 6000.16386.x86fre.vista_rtm.061101-2205
Kernel base = 0x81800000 PsLoadedModuleList = 0x81908ab0
Debug session time: Sat Jan 27 20:13:10.917 2007 (GMT+0)
System Uptime: 0 days 1:33:13.589
Loading Kernel Symbols
Loading User Symbols
Loading unloaded module list
BugCheck E2, {cccccccc, 83286f08, 1a, 0}
Probably caused by : SystemDump.sys

64-bit Vista

Currently in order to use 64-bit SystemDump you have to disable “Driver Signature Enforcement” by:

  • F8 Advanced Boot Option
  • command line tool BCDedit
  • attaching an active kernel debugger

Then you need to run SystemDump64.exe as administrator.

- Dmitry Vostokov -

SystemDump 3.1

Tuesday, January 23rd, 2007

New version of SystemDump for 32-bit and 64-bit platforms has been released. What’s new in this version:

  • Fixed the bug that prevented SystemDump to bugcheck second time after the first bugcheck and reboot happened (the known workaround was to run it twice second time)
  • Easter egg (hold key and click on About button)

The tool can be downloaded from Citrix support web site.

- Dmitry Vostokov -

MessageHistory 2.0

Wednesday, January 17th, 2007

MessageHistory for 32-bit and 64-bit platforms has been extended and improved to make it better for troubleshooting and debugging GUI. What’s new in this version:

  • Added more filtering to reduce log size for default options
  • Shows names for messages sent to the following controls:
    • edit
    • static
    • button
    • listbox
    • combobox
    • scrollbar  
  • Added Spy++-style log for bulk messages sorted by time
  • Easter egg (hold <Shift> key and click on About button) 

It can be downloaded from Citrix support web site.

The picture from my recent presentation shows schematically the difference between sent and posted messages:  

and the following diagram depicts relationship between processes, threads and windows:


- Dmitry Vostokov -

WindowHistory Mobile update (version 2.2)

Thursday, January 4th, 2007

Code changes and bug fixes from the latest WindowHistory 3.0 have been integrated. Also users reported that mobile version doesn’t track parent window handle and this has been fixed too.

- Dmitry Vostokov -

WindowHistory 3.0

Monday, January 1st, 2007

WindowHistory tool has been significantly rewritten and improved to make it better for troubleshooting and debugging GUI. What’s new in this version:

  • Real-time support: windows are tracked as they are created and destroyed, their position and size are changed, etc.
  • Dramatically improved speed, no matter how many windows you have in your session WindowHistory is fast and has minimum impact on the system (O(log(n)))
  • Better formatted output
  • Fixed bugs found in previous version
  • Easter egg (hold <Shift> key and click on About button)


It is a native Windows application written in C++/STL/MFC/Win32.

There are two packages: WindowHistory32 and WindowHistory64. Both can be downloaded from Citrix support web site:

To use download, unpack and run WindowHistory(64).exe.

To uninstall just remove files.

Note: although 32-bit version will run on x64 Windows too, real-time support for 64-bit application windows will not be available. For x64 Windows please use WindowHistory64 which correctly handles both 64-bit and 32-bit application windows.

The following UML collaboration diagram depicts schematically how WindowHistory64 gets notifications from 32-bit windows:

If you want to track window messages and processes simultaneously run it with MessageHistory and ProcessHistory tools.

 - Dmitry Vostokov -

Using scripts to process hundreds of user dumps

Thursday, December 28th, 2006

Suppose you have 100 - 200 user dumps from various user processes in the system and you want to quickly check their thread stacks, locks, etc. to see something suspicious related to your product or its environment your customers complaining about. It is much easier to collect such information into text files and browse them quickly than open every dump in WinDbg. I used shell script (VBScript) to automate loading dumps into WinDbg and used WinDbg scripts to run complex commands against loaded user dumps. For example, I used the following shell script:

'
' UDumps2Txt.vbs
'
Set fso = CreateObject("Scripting.FileSystemObject")
Set Folder = fso.GetFolder(".")
Set Files = Folder.Files
Set WshShell = CreateObject("WScript.Shell")
For Each File In Files
  Set oExec = WshShell.Exec("C:\Program Files\Debugging Tools for Windows\WinDbg.exe -y ""srv*c:\mss*http://msdl.microsoft.com/download/symbols"" -z " + File.Name + " -c ""$$><c:\scripts\UDmp2Txt.txt;q"" -Q -QS -QY –QSY")
  Do While oExec.Status = 0
     WScript.Sleep 1000
  Loop
Next
'
' UDumps2Txt.vbs: End of File
'

and the following WinDbg script:

$$
$$ UDmp2Txt: Dump information from user dump into log
$$
.logopen /d
!analyze -v
!locks
~*kv
lmv
.logclose
$$
$$ UDmp2Txt: End of File
$$

The following command launches multiple Dmp2Txt conversions:

C:\UserDumps>cscript /nologo c:\scripts\UDumps2Txt.vbs

You can also use CDB from Debugging Tools for Windows (console debugger) instead of WinDbg. I just use WinDbg uniformly instead of using separately CDB for user process dumps and KD for kernel and complete memory dumps. 

Now when you have text files you can search for patterns using regular expressions. I will write more about applying them later. There is a very good book about them from practical point of view I read 6 years ago when I needed to understand them beyond wildcards and question marks. Since that time the book has undergone another two editions:

Mastering Regular Expressions, 3rd edition

Buy from Amazon

Or you can process text files further and feed them into your database - part of automated crash dump analysis system.

- Dmitry Vostokov -

Clipboard Issues Explained

Saturday, December 9th, 2006

I believe every Citrix user experienced clipboard breaks at least once. I remember my frustration when I coudn’t copy between Outlook and Vantive sessions and so 2.5 years ago I wrote RepairCBDChain tool to help to temporary restore clipboard functionality. Recently this feature was incorporated into ICA client. You can read about it in the client readme file (1. … [From 9.100][#112636]). However it is not enabled by default and if you experience clipboard breaks on the server side or you want to restore clipboard functionality immediately on your client without closing your session to apply changes to appsrv.ini or simply you are still using an old client then you can still benefit from this tool.

A month ago I promised to explain how my tool works. You all know that primary method for notifying windows about various events is window message mechanism. One of these notification events is clipboard notification message: WM_DRAWCLIPBOARD. Usually applications do not know whether clipboard content has changed if another program copied new data. Generally if you open Edit menu you see Paste enabled if there is data in the clipboard. This is done by application code itself by checking if clipboard is non-empty. If the application finds that clipboard is non-empty indeed it enables Paste menu item or disables it otherwise. In case of ICA client (wfica32.exe) it needs to know whether clipboard contains new data in order to send it down via ICA channel to a server session.

Windows has a mechanism to notify applications about clipboard changes. An application interested in such notifications has to register itself in the so called clipboard chain. Windows inserts it on top of that chain and that application is responsible to propagate changes down the chain:

rc1.jpg

If a 3rd-party application forgets to forward notifications down then we have a broken clipboard chain and clipboard changes are not sent via ICA protocol:

rc2.jpg

If you run RepairCBDChain.exe it tries to find the window of wfica32.exe and registers it for clipboard notifications again:

rc3.jpg 

However if it finds the second instance of wfica32.exe (as on the picture above) the first instance will be still cut off from notifications and this explains why RepairCBDChain.exe doesn’t work sometimes.

On the server session side the picture is similar (the registered application is wfshell.exe):

rc4.jpg

rc5.jpg

rc6.jpg

You can see WM_DRAWCLIPBOARD messages in MessageHistory logs for wfica32.exe process:

PID.TID: c20.c0c

HWND: 0x002501D4
Class: "wMFService006600CA004"
Title: "Microsoft Outlook7718 - MetaFrame Presentation Server Client [SpeedScreen On]"

HWND: 0x003F08DC
Class: "Transparent Windows Client"
Title: "^P ^b24 of 24 - Clipboard^b^SItem collected. - \\Remote"

HWND: 0x004E0332
Class: "WFClip"
Title: "WFClip"
17:58:53:484 S WM_DRAWCLIPBOARD (0×308) wParam: 0xd0aa0 lParam: 0×0

HWND: 0x0094036E
Class: "TWI Link"
Title: ""

Hope this little excursion explained clipboard chain, how it becomes broken and how it is repaired.

- Dmitry Vostokov -

Dmp2Txt: Solving Security Problem

Saturday, December 9th, 2006

This is a follow up to my previous Q&A about crash dumps and security issues like exposing confidential information stored in memory: Crash Dumps and Security. It seems a solution exists which allows to do some sort of crash dump analysis or at least identify problem components without sending complete or kernel memory dumps.

This solution takes advantage of WinDbg ability to execute scripts of arbitrary complexity. Couple of months ago I wrote about scripts and they really help me in pulling out various information from complete memory dumps:

WinDbg scripts
Yet another Windbg script
Critical sections

Now I created the bigger script that combines together all frequent commands used for identification of potential problems in memory dumps:

  • !analyze -v
  • !vm 4
  • lmv
  • !locks
  • !poolused 3
  • !poolused 4
  • !exqueue f
  • !irpfind
  • !stacks
  • List of all processes’ thread stacks, loaded modues and critical sections (for complete memory dump)

Other commands can be added if necessary.

How does all this work? A customer has to install Debugging Tools for Windows from Microsoft. This can be done on any workstation and not necessarily in a production environment. Then the customer has to run WinDbg.exe with some parameters including path(s) to symbols (-y), a path to memory dump (-z) and a path to script (-c):

C:\Program Files\Debugging Tools for Windows>WinDbg.exe -y "srv*c:\mss*http://msdl.microsoft.com/download/symbols" -z MEMORY.DMP -c "$$><c:\WinDbgScripts\Dmp2Txt.txt;q" -Q -QS -QY –QSY

Once WinDbg.exe finishes (it can run for couple of hours if you have many processes in your complete memory dump) you can copy the .log file created in “C:\Program Files\Debugging Tools for Windows” folder, archive it and send it to support for analysis. Kernel and process data and cached files are not exposed in the log! And because this is a text file the customer can inspect it before sending.

Here are the contents of Dmp2Txt.txt file:

$$
$$ Dmp2Txt: Dump all necessary information from complete full memory dump into log
$$
.logopen /d
!analyze -v
!vm 4
lmv
!locks
!poolused 3
!poolused 4
!exqueue f
!irpfind
!stacks
r $t0 = nt!PsActiveProcessHead
.for (r $t1 = poi(@$t0); (@$t1 != 0) & (@$t1 != @$t0); r $t1 = poi(@$t1))
{
    r? $t2 = #CONTAINING_RECORD(@$t1, nt!_EPROCESS, ActiveProcessLinks);
    .process @$t2
    .reload
    !process @$t2
    !ntsdexts.locks
    lmv
}
.logclose
$$
$$ Dmp2Txt: End of File
$$

For kernel dumps the script is simpler: 

$$
$$ KeDmp2Txt: Dump all necessary information from kernel dump into log
$$
.logopen /d
!analyze -v
!vm 4
lmv
!locks
!poolused 3
!poolused 4
!exqueue f
!irpfind
!stacks
!process 0 7
.logclose
$$
$$ KeDmp2Txt: End of File
$$

Note: if the dump is LiveKd.exe generated then due to inconsistency scripts may run forever 

- Dmitry Vostokov -

New TestDefaultDebugger Tool

Wednesday, December 6th, 2006

It often happens that Citrix support advises customers to change their default postmortem debugger to NTSD. But there is no way to test new settings unless some application crashes again. And some customers come back saying dumps are not saved despite new settings and we don’t know whether dumps were not saved because a crash hadn’t yet happened or default debugger hadn’t been configured properly or something else happened.

In addition the arrival of 64-bit Windows brings another problem: there are 2 default postmortem debuggers on 64-bit Windows (for 32-bit and 64-bit applications respectively):

NTSD on x64 Windows

The new tool TestDefaultDebugger forces a crash on itself to test the presence and configuration of default postmortem debugger (Dr. Watson, NTSD or other). Then if the default postmortem debugger is configured properly OS will launch it to save a dump of TestDefaultDebugger.exe process.


If you enabled NTSD as a default postmortem debugger (CTX105888) the following console window will briefly appear:

Postmortem debuggers are explained here:

Dumps for Dummies (Part 3)

On 64-bit Windows you can run both 32-bit TestDefaultDebugger.exe and 64-bit TestDefaultDebugger64.exe applications and then open crash dumps to see whether both postmortem debuggers have been configured properly. The tool has also command line interface so you can use it remotely:

c:\>TestDefaultDebugger.exe now

You can download the tool from Citrix support web site:

TestDefaultDebugger v1.0 for 32-bit and 64-bit platforms

- Dmitry Vostokov @ DumpAnalysis.org -

Inside Citrix - November 2006

Wednesday, November 22nd, 2006

Welcome to Inside Citrix. This monthly column gives a glimpse of different aspects of Citrix through our people. Our guests have different areas of responsibility and expertise to give you an idea of what is happening behind the scenes. We discuss items of interest with people from Product Readiness, Escalation, Technical Support, and Engineering just to name a few.

In this installment of Inside Citrix, we discuss the meaning of life with Dmitry Vostokov, EMEA Development Analysis Team Lead.

Q: Hello Dmitry, how are you? I am very happy to conduct this interview as you are a creative and prolific worker. I wonder…has fame caught up to you yet, due to your creativity?

A: I’m fine, thank you! I believe there is a synergistic effect going on here. I make the company famous and the company makes me famous.

Q: So, before I get too far ahead of myself, please tell everyone a bit of your history. Where are you from? What did you do before Citrix? How long have you been with us? What kinds of things have you been doing at Citrix during your tenure?

A: I’m from Russia. I was born near Moscow and I spent 14 years there after enrolling at Moscow State University to study chemistry. In that university, I saw a computer and immediately started programming. My first program was written in FORTRAN and had almost 200 lines. My second program had commercial success: I ported 800 FORTRAN lines to about 2000 PDP-11 assembler lines and achieved a 25 percent increase in speed (the program calculated rocket fuel properties for weeks). Since then I’d been working from home for some U.S. and Russian ISV companies (mostly in speech and image processing domains) until 1999, when I went to work in an office to see a large software factory from the inside out.

In 2001 I went to Ireland to learn English. My first job in Ireland was with Ericsson in a small town as a Senior Software Designer. The title sounded great to me, but I heard rumors that the only engineers in Ericsson were hardware engineers. So that job didn’t last long because I was headhunted by a company called Programming Research and I relocated to Dublin. I spent 1.5 years there and after working briefly for a security company (that company is extinct now) I was hired by Citrix. I’ve already spent 3.16 years here. For Citrix I analyze crash dumps and provide recommendations. It’s like being a computer psychologist assessing brain damage. I also do a bit of escalation work when I have time. I like to provide full escalation and software maintenance cycles whenever I have sufficient resources to analyze the problem, contact the customer, and provide the resolution. I also have an opportunity here to apply my software design and programming skills by writing various troubleshooting tools.

Q: Most people probably didn’t know all of that. I guarantee you that Escalation knows you well. How is the blogging going? How can readers get to your blog?

A: I love blogging. I didn’t even think about blogging until I suddenly realized its potential in information sharing. When I joined the company there was no sufficient information available about crash dump analysis, so I had to learn on my own. Now I’m happy to share what I have learnt to everyone.

One topic I like to write about in my blog at the moment is crash dump analysis patterns and anti-patterns, where I summarize general solutions you can apply or should not apply in specific contexts to common recurrent dump analysis problems.

More will come…

Q: And the tools that you create, very useful! Can you take a moment to talk about each of the ones you have created? Which ones have you gotten the best feedback about? Which ones have been the most useful?

A: Thanks! I use them too. The tool I got the most complaints about is RepairCBDChain; the tool with the fewest complaints is SystemDump. I got the best feedback about PDBFinder.

All of them are useful in certain troubleshooting scenarios. I’m preparing a presentation about all these tools and I will present it to the EMEA TRM team in December. I’ll definitely publish it as soon as I get feedback about that training.

Here are brief descriptions of these tools (most of them have different versions for various platforms, and some were even ported to Windows Mobile):

• RepairCBDChain: Repairs clipboard functionality and magically you are able to copy/paste again (not always actually – I promise to write a blog post explaining why).

• ADSCleaner: Cleans Windows NT File System (NTFS) file streams created by Citrix memory optimization code if you no longer need this feature (it also frees disk space, by the way).

• ProcessHistory: Tracks processes, threads, and modules on 32-bit and 64-bit platforms. I’m going to release a Windows Mobile version soon.

• MessageHistory: Tracks window messages. It’s similar to Spy++ but much easier to use for troubleshooting and it works on 64-bit platforms too.

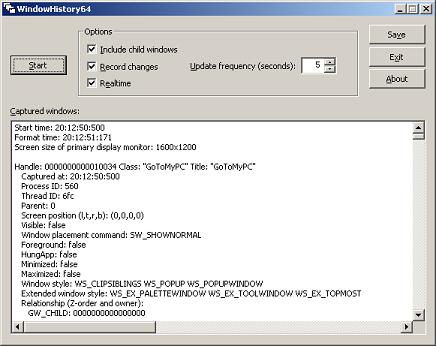
• WindowHistory: Tracks windows as they change their appearance, are created, and are destroyed and saves a log file. This is what Spy++ lacks and it was the primary motivation to write this tool.

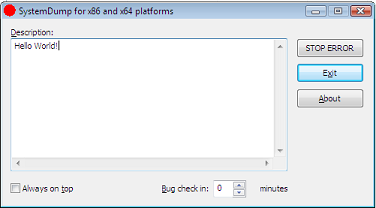
• SystemDump: Forces a dump immediately or after a specified period of time. This can be done remotely too. It works on both 32-bit and 64-bit Windows! My primary motivation was that the OSR “bang” tool doesn’t work on 64-bit Windows.

• PDBFinder: Helps to find symbol files if you have zillions of them.

• DumpCheck: Verifies that you have a valid dump and even provides recommendations to avoid common mistakes before sending dumps to support.

• CtxHidEx32: Can hide any annoying windows or message boxes and reduce unnecessary support calls. It also has a peculiar feature: you can specify an action to do before hiding the window. When the Media Player window appears it can send a message to your boss.

• Dump2Wave: My most controversial tool that allows you to hear the sound of memory corruption. Some people say it’s useless but I would say it is entertaining.

Some other upcoming tools I’m working days and nights on (when I have free time) are:

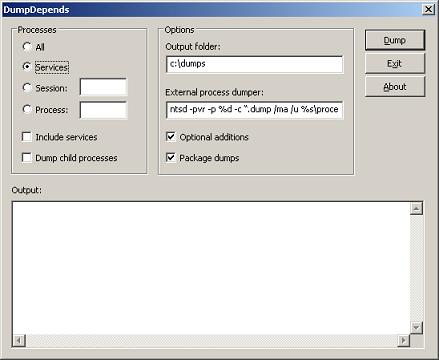
• DumpDepends: Helps to automate repetitive dumping.

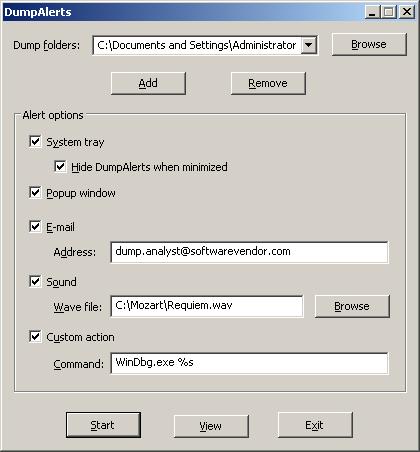
• DumpAlerts: Provides notification whenever new dump is saved.

• SessionHistory: Tracks session information.

• HistoryToolbar: Organizes “History” tools into one coherent super tool.

• DumpPlayer: Plays musical dumps in real-time and provides visual images based on crash dump memory contents. I coined a term—Dump Tomography—for this.

Q: They must take some upkeep, as we see a lot of improvements, updates, and so on. I also see you provide a lot of training information on escalation techniques, debugging, analysis, and more. What do you believe is the most important characteristic of a successful escalation engineer?

A: As Winston Churchill said: “Never, never, never give up!”?

Q: Any advice for Citrix administrators who might be reading this on how to avoid trouble or have their environment best situated to speed resolution, should an issue occur?

A: If you are asked to generate and/or collect crash dumps, please tell support personnel how you got that dump. And ensure that you are sending the right dump for the right issue.

I started writing Dumps for Dummies blog posts to explain dumps and I promise to continue and expand them.

Q: What do you find most challenging about your job?

A: To work with enormous amounts of information and make quick decisions at the same time.

Q: Is there anything you can share with us about new Citrix products or technologies (not giving away confidential information) that you are excited about?

A: I would tell you that with whatever new technology comes along, crash dumps will be the same! And this gives me some optimism. Whether there will be more or less crash dumps in the future is pretty confidential though…

Q: Any plans to visit Citrix headquarters in Fort Lauderdale, Florida?

A: I’m actually visiting Citrix headquarters at the end of this month! See you there.

Q: Not so much a question, make us laugh!

A: One day we got a fax from a customer where all of the blue screen information was written down by hand—hundreds of digits… How long it took to copy all that from the screen and whether or not he made any mistakes, we will never know. The copy from that fax is still hanging on my desk wall.

Q: What do you do in your free time besides analyzing dumps, debugging and programming?

A: Read books. I read lots of them and about quite diverse subjects. However, my favorite subject for the last four years has been math—the more abstract the better.

It really helps in improving the critical thinking skills required for my job.

Thanks, Dmitry. People will know to look you up online…

WindowHistory Mobile (new release)

Wednesday, November 22nd, 2006

WindowHistory Mobile edition has been updated. It replaces the previous version of WindowHistory CE/Mobile 2.1 and now available in two separate executables: for Windows Mobile 5.0 (ARMV4I) and Windows Pocket PC 2003 (ARMV4). It has been tested under emulators, Acer n300 (480×640 screen) and mobile phone Mio A701 (240×320 screen). Here are screenshots from Windows Mobile 5.0 emulator:

whm50.jpg

whm50w.jpg

The tool also includes Easter Egg (activate soft keyboard, click on and then click on About button. The following window appears with scrolling text of contributors and special thanks):

whm50a.jpg

- Dmitry Vostokov -

Voices from Process Space

Sunday, November 19th, 2006

Following the release of Dump2Wave tool some members of Citrix community have been asking me to provide some interesting sound fragments from dump files. I was also particularly interested in catching voices from the past: embedded fragments of human voice. So I recorded my “Hello” message, played it by Media Player and then saved a process dump. Then I converted the dump to CD-quality wave file and saved interesting sound fragments from it (to conserve space - the original wave file was 76Mb).

To listen to these fragments you can download wave files from the following location:

DumpSounds.zip (8Mb)

Here is the description of what I heard in these wave files:

- dump1.wav

  • violin
  • aliens
  • train sound
  • Hello

- dump2.wav

  • electric guitar
  • signals from cosmos

- dump3.wav

  • Morse code alphabet

- dump4.wav

  • helicopter

- dump5.wav

  • horn
  • some interesting noise and fragments of electronic music

 Enjoy :-)

Of course, you can convert kernel memory dumps to wave files and hear voices from kernel space too…

- Dmitry Vostokov -

Preview of DumpAlerts tool

Sunday, November 19th, 2006

The tool monitors folders where dumps can be saved including Dr. Watson, a folder specified when NTSD is set as a default debugger, etc. It then alerts a user, an administrator or a software vendor whenever a new dump is saved:

  • Icon in System Tray changes its color from green to red
  • Popup window appears until dismissed
  • E-mail is sent to a specified address
  • Sound is played
  • Custom action is executed, for example, automatically launching WinDbg.exe with the latest dump or copying it to an ftp server

All actions are fully configurable and can be enabled/disabled. Here is the screenshot of the main window:

I’m planning to incluide TAPI support and alerts from hung applications in the next version(s).

Later this tool will included in Dump Monitor Suite

Any comments and suggestions are welcome.

- Dmitry Vostokov -

Crash Dumps for Dummies (Part 4)

Sunday, November 19th, 2006

In the previous Dumps for Dummies (Part 3) I tried to explain the nature of crashes. Another category of problems happens very often and we also need a dump for analysis: hangs. There is some confusion exists in understanding the difference between these two categories: crash and hang. Although sometimes a hang is a direct consequence of a crash most of the time hangs happen independently. They also manifest themselves differently. Let’s look at application (process) crashes and hangs first. When a crash happens an application (process) often disappears. When hang happens an application (process) is still in memory: you can see it in Task Manager, for example, but it doesn’t respond to user commands or to any other requests like pinging a TCP/IP port. If we have a crash in OS then the most visible manifestation is blue screen and/or reboot. If we have a hang then everything freezes.

Application or system hang happens because from high level view of the interaction between application or OS components (modules) is done via messages. One component sends a message to another and waits for a response. Some components are critical, for example, registry. The following hand-made picture depicts very common system hang situations when the register component stops responding. Then every running application (process) stops responding if its execution path depends on registry access.

The very common reason for hang is so called deadlock when two running applications (their execution paths, threads) are waiting for each other. Here is the analogy with a blocked road:

In order to see what’s inside the process or OS which caused a hang we need a dump. Usually this dump is called a crash dump too because in order to get it the usual method is to make some sort of a trap which causes an application or OS to crash and to save the dump. I personally prefer to call these dumps just memory dumps to avoid confusion.  

How can you get a memory dump if your application or service hangs?

How can you get a memory dump if your system hangs?

For most system hangs choosing Kernel memory dump option in Control Panel\System\Advanced\Startup and Recovery applet is sufficient. Kernel memory dumps are smaller and less susceptible to corruption or truncation due to small page file size. If you discover that you need to peer inside running user applications then you can always ask for another Complete memory dump when the problem happens again.

- Dmitry Vostokov @ DumpAnalysis.org -

How WINE can help in Crash Dump Analysis

Thursday, November 16th, 2006

You probably already know or have heard about the project WINE: Windows API on top of X and Unix

winehq.com 

I first heard about it more than 10 years ago when it started. Today I rediscovered it again and was really surprised. I was looking for one NT status code I couldn’t find in MS official documentation and found it here:

dlls/ntdll/error.c

In order to run Win32 programs WINE emulates all API calls including OLE32, USER32, GDI32, KERNEL32, ADVAPI32 and of course, NTDLL:

dlls/ntdll
dlls/ole32
dlls/user32
dlls/kernel32
dlls/gdi32
dlls/advapi32

Plus hundreds of other components. All source code is located here:

http://cvs.winehq.com/cvsweb/wine/

So if want to see how particular function or protocol might have been implemented hypothetically by Windows OS designers it is a good place to start.

- Dmitry Vostokov -

Hide and seek in a Citrix farm

Sunday, October 29th, 2006

Just want to mention this tool I wrote some time ago: CtxHideEx32. It has nothing to do with CtxHide.exe which is executed during every ICA logon. I simply borrowed the prefix. The purpose of CtxHideEx32 is to hide messages or windows you don’t want your users to see. Or perhaps you want to execute certain actions if some window appears like logging off the poor user who launched Media Player or sending a message to his boss :-).  Policy reinforcement… Read the following article and try (requires free registration on Citrix support web site):

http://support.citrix.com/article/CTX110341 

- Dmitry Vostokov @ DumpAnalysis.org -

Dump2Wave update

Sunday, October 29th, 2006

Dump2Wave has been updated and can be downloaded from the same link as before:

Download Dump2Wave version 1.2.1

What’s new and corrections list:

  • Dumps with file size not divisible by the product of bytes-per-sample and channels (sample alignment) are converted into correct wave files now
  • Sample alignment is calculated correctly for non-CD quality wave
  • File paths with spaces are allowed now (you need to include them in double quotes)
  • Added diagnostic and error messages

- Dmitry Vostokov -

Preview of DumpDepends tool

Saturday, October 28th, 2006

There are many cases where we need to dump several processes simultaneously and complete memory dump is not an option.
DumpDepends tool will dump processes and optionally package them into a CAB file. There are several options:

  • Dump all processes
  • Dump important services (Terminal, IMA, CTXXMLSS, Printing, Spooler, SVCHOST)
  • Dump all processes from the given session ID (additionally including children and important services if needed)
  • Dump an individual process (optionally including children and important services) 

The tool will use external process dumpers in noninvasive manner (NTSD by default or any other specified, like userdump.exe)
On x64 it will distinguish between 32-bit and 64-bit processes and dump them accordingly.
Command line option will also be available.

Later this tool will included in Dump Monitor Suite

Any comments and suggestions are welcome.

- Dmitry Vostokov-

Dumping processes without breaking them

Saturday, October 28th, 2006

You can do it on any Windows system without installing any additional tools like Userdump or WinDbg. And your process won’t be interrupted while the dump is being saved and will continue to work. Use the following command:

ntsd -pvr -p 'PID' -c ".dump /ma /u process.dmp; q"

PID is a decimal process ID you can get from Task Manager, for example. 

Note: on x64 system to dump a 32-bit process (shown as *32 in Task Manager) you need to use NTSD from \Windows\SysWOW64 folder.

- Dmitry Vostokov -

ProcessHistory for 32-bit and 64-bit platforms

Friday, October 27th, 2006

This tool was announced previously New Tool: ProcessHistory and after testing was finally released.

The new version is under development and will include:

  • CDV output format
  • various sorting and filtering options
  • command line interface
  • real-time tracing

- Dmitry Vostokov -