Archive for the ‘Escalation Engineering’ Category
Sunday, August 14th, 2011
Due to the need to extend existing basic and intermediate Accelerated Windows Memory Dump Analysis training Memory Dump Analysis Services organises advanced training course. Here is the description and registration information:
Learn how to navigate through memory dump space and Windows data structures to troubleshoot and debug complex software incidents. We use a unique and innovative pattern-driven analysis approach to speed up the learning curve. The training consists of practical step-by-step exercises using WinDbg to diagnose structural and behavioral patterns in 32-bit and 64-bit process, kernel and complete memory dumps.

If you are registered you are allowed to optionally submit your memory dumps before the training. This will allow us in addition to the carefully constructed problems tailor extra examples to the needs of the attendees.
The training consists of one four-hour session and additional homework exercises. When you finish the training you additionally get:
- A full transcript in PDF format (retail price $200)
- 5 volumes of Memory Dump Analysis Anthology in PDF format (retail price $100)
- A personalized attendance certificate with unique CID (PDF format)
Prerequisites: Basic and intermediate level Windows memory dump analysis: ability to list processors, processes, threads, modules, apply symbols, walk through stack traces and raw stack data, diagnose patterns such as heap corruption, CPU spike, memory and handle leaks, access violation, stack overflow, critical section and resource wait chains and deadlocks. If you don’t feel comfortable with prerequisites then Accelerated Windows Memory Dump Analysis training is recommended to take (or purchase a corresponding book) before attending this course.
Audience: Software developers, software technical support and escalation engineers.
Session: December 9, 2011 4:00 PM - 8:00 PM GMT
Price: 210 USD
Space is limited.
Reserve your remote training seat now at:
https://student.gototraining.com/24s4l/register/3788047691824598784
- Dmitry Vostokov @ DumpAnalysis.org + TraceAnalysis.org -
Posted in Announcements, Complete Memory Dump Analysis, Crash Dump Analysis, Crash Dump Patterns, Debugging, Escalation Engineering, Kernel Development, Memory Dump Analysis Services, Multithreading, Reverse Engineering, Root Cause Analysis, Software Engineering, Software Technical Support, Structural Memory Patterns, Training and Seminars, Uses of UML, Vista, WinDbg Scripts, WinDbg Tips and Tricks, Windows 7, Windows Data Structures, Windows Server 2008, x64 Windows | No Comments »
Thursday, August 11th, 2011
Due to popular demand and the need to extend existing Accelerated Windows Memory Dump Analysis training Memory Dump Analysis Services organises the new training course. Here is the description and registration information:
Learn how to analyze .NET application and service crashes and freezes, navigate through memory dump space (managed and unmanaged code) and diagnose corruption, leaks, CPU spikes, blocked threads, deadlocks, wait chains, resource contention, and much more. We use a unique and innovative pattern-driven analysis approach to speed up the learning curve. The training consists of practical step-by-step exercises using WinDbg to diagnose patterns in 32-bit and 64-bit process memory dumps.

If you are registered you are allowed to optionally submit your memory dumps before the training. This will allow us in addition to the carefully constructed problems tailor extra examples to the needs of the attendees.
The training consists of one four-hour session and additional homework exercises. When you finish the training you additionally get:
- A full transcript in PDF format (retail price $200)
- 5 volumes of Memory Dump Analysis Anthology in PDF format (retail price $100)
- A personalized attendance certificate with unique CID (PDF format)
Prerequisites: Basic .NET programming and debugging.
Audience: Software developers, software technical support and escalation engineers.
Session: October 28, 2011 4:00 PM - 8:00 PM GMT
Price: 210 USD
Space is limited.
Reserve your remote training seat now at:
https://student.gototraining.com/24s4l/register/423991811034037760
- Dmitry Vostokov @ DumpAnalysis.org + TraceAnalysis.org -
Posted in .NET Debugging, Announcements, Cloud Memory Dump Analysis, Crash Dump Analysis, Crash Dump Patterns, Debugging, Escalation Engineering, Memory Dump Analysis Services, Multithreading, Software Engineering, Software Technical Support, Training and Seminars, Windows 7, Windows Azure, Windows Server 2008, x64 Windows | No Comments »
Tuesday, August 9th, 2011
I showed this artwork to many people and they responded that they didn’t understand or hope one day they would understand. Only one guy (a professional manager) responded positively with understanding. What I think is that real art can be interpreted in many ways. So I kindly await your criticism.
PS. This Computicart (Computical Art) work was inspired by a pet parrot at home. I’ve been observing its behaviour for more than 6 months and tried to discern a few patterns. Its name is KiKi (not related to Ki* functions).
- Dmitry Vostokov @ DumpAnalysis.org + TraceAnalysis.org -
Posted in Art, Computicart (Computical Art), Crash Dump Analysis, Debugging, Escalation Engineering, Fun with Crash Dumps, Fun with Debugging, Software Engineering, Software Technical Support | No Comments »
Sunday, August 7th, 2011
During the previous several months many people expressed their interest in the training (the next one is scheduled for November) but its time was not suitable due to the very different geographic time zones. So I have decided to publish this training in book format (currently in PDF) and make it available in paperback on Amazon and B&N later. Book details:
- Title: Accelerated Windows Memory Dump Analysis: Training Course Transcript and WinDbg Practice Exercises with Notes
- Description: The full transcript of Memory Dump Analysis Services Training with 21 step-by-step exercises, notes, source code of specially created modeling applications and selected Q&A. Covers about 50 crash dump analysis patterns from process, kernel and complete memory dumps.
- Authors: Dmitry Vostokov, Memory Dump Analysis Services
- Publisher: OpenTask (August 2011)
- Language: English
- Product Dimensions: 28.0 x 21.6
- Paperback: 360 pages
- ISBN-13: 978-1908043290

Table of Contents
Now available for sale in PDF format from Memory Dump Analysis Services.
- Dmitry Vostokov @ DumpAnalysis.org + TraceAnalysis.org -
Posted in Announcements, Books, Complete Memory Dump Analysis, Crash Dump Analysis, Crash Dump Patterns, Escalation Engineering, Memory Dump Analysis Services, Publishing, Software Technical Support, Testing, Tools, Training and Seminars, Vista, WinDbg Tips and Tricks, Windows 7, Windows Server 2008, Windows System Administration, x64 Windows | No Comments »
Saturday, August 6th, 2011
Due to popular demand (the previous training was fully booked) Memory Dump Analysis Services scheduled the next training sessions.
Learn how to analyze application, service and system crashes and freezes, navigate through memory dump space and diagnose heap corruption, memory leaks, CPU spikes, blocked threads, deadlocks, wait chains, and much more. We use a unique and innovative pattern-driven analysis approach to speed up the learning curve. The training consists of more than 20 practical step-by-step exercises using WinDbg highlighting more than 50 patterns diagnosed in 32-bit and 64-bit process, kernel and complete memory dumps.
Public preview (selected slides) of the previous training

Memory Dump Analysis Services organizes a training course.
If you are registered you are allowed to optionally submit your memory dumps before the training. This will allow us in addition to the carefully constructed problems tailor extra examples to the needs of the attendees.
The training consists of 4 two-hour sessions (2 hours every day). When you finish the training you additionally get:
- A full transcript in PDF format (retail price $200)
- 5 volumes of Memory Dump Analysis Anthology in PDF format (retail price $100)
- A personalized attendance certificate with unique CID (PDF format)
Prerequisites: Basic Windows troubleshooting
Session 1: November 1, 2011 4:00 PM - 6:00 PM GMT
Session 2: November 2, 2011 4:00 PM - 6:00 PM GMT
Session 3: November 3, 2011 4:00 PM - 6:00 PM GMT
Session 4: November 4, 2011 4:00 PM - 6:00 PM GMT
Price: 210 USD
Space is limited.
Reserve your remote training seat now.
If scheduled dates or time are not suitable for you Memory Dump Analysis Services offers the same training in book format.
Training testimonials:
I would like to thank you and recommend your training. I think that the “Accelerated Windows Memory Dump Analysis” training is a pin-point, well taught training. I think it’s the leading training in the dump analysis area and I’ve enjoyed it, the books and materials are very detailed and well written and Dmitry answered all of the needed question. In addition after the training Dmitry sent a PDF with written answers and more information about the questions that were asked. I will give this training 5/5. Thank you Dmitry.
Yaniv Miron, Security Researcher, IL.Hack
- Dmitry Vostokov @ DumpAnalysis.org + TraceAnalysis.org -
Posted in Announcements, Complete Memory Dump Analysis, Crash Dump Analysis, Crash Dump Patterns, Escalation Engineering, Memory Dump Analysis Services, Multithreading, Software Technical Support, Testing, Tools, Training and Seminars, Vista, WinDbg Tips and Tricks, Windows 7, Windows Server 2008, Windows System Administration, x64 Windows | No Comments »
Wednesday, July 27th, 2011
Second Eye (or sometimes a stronger variant “second pair of eyes”) - another engineer you typically need when you don’t see anything useful in a memory dump, software trace or source code for problem resolution purposes. You are anxious to recommend something useful.
Examples: Don’t see anything in this huge trace. I need a second eye.
- Dmitry Vostokov @ DumpAnalysis.org + TraceAnalysis.org -
Posted in Crash Dump Analysis, Debugging, Debugging Slang, Escalation Engineering, Fun with Crash Dumps, Fun with Debugging, Fun with Software Traces, Software Technical Support, Software Trace Analysis | No Comments »
Sunday, May 15th, 2011
Presentation Software Trace and Memory Dump Analysis: Patterns, Tools, Processes and Best Practices from E2E Virtualization Conference (13th of May, 2011) is available for download:
http://www.dumpanalysis.com/STMDA-materials
- Dmitry Vostokov @ DumpAnalysis.org + TraceAnalysis.org -
Posted in Announcements, Debugging, Debugging Methodology, Escalation Engineering, Presentations, Root Cause Analysis, Software Behavior Patterns, Software Technical Support, Software Trace Analysis, Software Trace Reading, Tools, Trace Analysis Patterns, Training and Seminars, Troubleshooting Methodology | No Comments »
Friday, April 22nd, 2011
Very simple methodology summarized in just 3 words applicable to any problem solving domain and its activities including software troubleshooting and debugging:
Artifacts. Checklists. Patterns.
As an example of checklists and patterns please see these 3 presentations related to memory dump and software trace artifacts:
Introduction to Pattern-Driven Software Problem Solving
Fundamentals of Complete Crash and Hang Memory Dump Analysis
Pattern-Driven Memory Dump Analysis
I’m now working on a detailed presentation of this methodology.
- Dmitry Vostokov @ DumpAnalysis.org + TraceAnalysis.org -
Posted in Announcements, Debugging, Debugging Methodology, Escalation Engineering, New Acronyms, Root Cause Analysis, Software Technical Support, Troubleshooting Methodology | No Comments »
Thursday, April 21st, 2011
Imagine a pattern-driven crash analysis report (car) when you need it: at the very moment of a crash, just in time! And the car drives you to a problem resolution. Imagine also a periodic pattern-driven just-in-time memory space analysis (JIT MSA) that provides you instant intelligent reports on what’s going on inside memory while your application, service or system is running! This is a forthcoming optional client side part of CARE (Crash Analysis Report Environment) which is being developed by Memory Dump Analysis Services engineering team under the leadership of Alexey Golikov. Combined with generative debugging techniques both client and server parts form a complete unique enterprise crash and hang analysis solution suitable for development and production environments. Stay tuned for further exciting updates.
PS. The car drives on a road to the first fault software problem solving.
- Dmitry Vostokov @ DumpAnalysis.org + TraceAnalysis.org -
Posted in Crash Analysis Report Environment (CARE), Crash Dump Analysis, Debugging, Debugging Methodology, Escalation Engineering, First Fault Problem Solving, Generative Debugging, JIT Crash Analysis, JIT Memory Space Analysis, Memory Analysis Forensics and Intelligence, Memory Dump Analysis Services, Pattern Prediction, Software Behavior Patterns, Software Engineering, Software Technical Support, Testing, Tools, Windows System Administration | No Comments »
Sunday, April 17th, 2011
I’m pleased to announce that MDAA, Volume 5 is available in PDF format:
www.dumpanalysis.org/Memory+Dump+Analysis+Anthology+Volume+5
It features:
- 25 new crash dump analysis patterns
- 11 new pattern interaction case studies (including software tracing)
- 16 new trace analysis patterns
- 7 structural memory patterns
- 4 modeling case studies for memory dump analysis patterns
- Discussion of 3 common analysis mistakes
- Malware analysis case study
- Computer independent architecture of crash analysis report service
- Expanded coverage of software narratology
- Metaphysical and theological implications of memory dump worldview
- More pictures of memory space and physicalist art
- Classification of memory visualization tools
- Memory visualization case studies
- Close reading of the stories of Sherlock Holmes: Dr. Watson’s observational patterns
- Fully cross-referenced with Volume 1, Volume 2, Volume 3, and Volume 4
Its table of contents is available here:
www.dumpanalysis.org/MDAA/MDA-Anthology-V5-TOC.pdf
Paperback and hardcover versions should be available in a week or two. I also started working on Volume 6 that should be available in November-December.
- Dmitry Vostokov @ DumpAnalysis.org + TraceAnalysis.org -
Posted in Aesthetics of Memory Dumps, Analysis Notation, Announcements, AntiPatterns, Archaeology of Computer Memory, Art, Assembly Language, Best Practices, Books, C and C++, CDF Analysis Tips and Tricks, Categorical Debugging, Citrix, Common Mistakes, Common Questions, Complete Memory Dump Analysis, Computer Forensics, Computer Science, Crash Analysis Report Environment (CARE), Crash Dump Analysis, Crash Dump De-analysis, Crash Dump Patterns, Crash Dumps for Dummies, Cyber Warfare, Debugging, Debugging Bureau, Debugging Industry, Debugging Methodology, Debugging Slang, Debugging Trends, Deep Down C++, Dr. Watson, Dublin School of Security, Education and Research, Escalation Engineering, Fun with Crash Dumps, Fun with Debugging, Fun with Software Traces, General Memory Analysis, Hermeneutics of Memory Dumps and Traces, Images of Computer Memory, Kernel Development, Malware Analysis, Mathematics of Debugging, Memiotics (Memory Semiotics), Memory Analysis Forensics and Intelligence, Memory Diagrams, Memory Dump Analysis Services, Memory Dumps in Myths, Memory Space Art, Memory Systems Language, Memory Visualization, Memory and Glitches, Metaphysics of Memory Worldview, Multithreading, Music for Debugging, New Acronyms, New Debugging School, New Words, Pattern Models, Philosophy, Physicalist Art, Publishing, Reverse Engineering, Science of Memory Dump Analysis, Science of Software Tracing, Security, Software Architecture, Software Behavior Patterns, Software Chorography, Software Chorology, Software Defect Construction, Software Engineering, Software Generalist, Software Maintenance Institute, Software Narratology, Software Technical Support, Software Trace Analysis, Software Trace Reading, Software Trace Visualization, Software Tracing for Dummies, Software Troubleshooting Patterns, Software Victimology, Structural Memory Patterns, Structural Trace Patterns, Systems Thinking, Testing, The Way of Philip Marlowe, Tools, Trace Analysis Patterns, Training and Seminars, Troubleshooting Methodology, Victimware, Vista, Webinars, WinDbg Scripting Extensions, WinDbg Scripts, WinDbg Tips and Tricks, WinDbg for GDB Users, Windows 7, Windows Server 2008, Windows System Administration, Workaround Patterns, x64 Windows | No Comments »
Tuesday, April 5th, 2011
Finally, after the numerous delays, the first Windows Debugging Notebook is almost ready for publication by the end of this month with a new cover and a foreword written by Mario Hewardt, the author of Advanced Windows Debugging and Advanced .NET Debugging books:
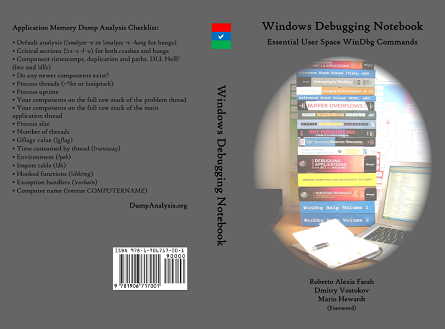
It is the first notebook because we have decided to split it into 3 different memory space volumes and one additional overview volume for concepts and tools:
- Windows Debugging Notebook: Essential User Space WinDbg Commands (ISBN: 978-1906717001 and 978-0955832857)
- Windows Debugging Notebook: Essential Kernel Space WinDbg Commands (ISBN: 978-1908043146)
- Windows Debugging Notebook: Essential Managed Space WinDbg .NET Commands (ISBN: 978-1908043153)
- Windows Debugging Notebook: Essential Concepts and Tools (ISBN: 978-1908043160)
On a bookshelf you would be able to distinguish between the first 3 volumes by a 3 color spine stripe with an appropriate check on it: red for kernel, blue for user, and green for managed space.
The Table of Contents has been changed too.
- Dmitry Vostokov @ DumpAnalysis.org + TraceAnalysis.org -
Posted in Announcements, Assembly Language, Books, Crash Dump Analysis, Debugging, Escalation Engineering, Publishing, Reverse Engineering, Security, Software Engineering, Software Technical Support, WinDbg Scripts, WinDbg Tips and Tricks | 2 Comments »
Saturday, March 26th, 2011
The presentation materials from the webinar (25th of March, 2011) are available for download:
http://www.dumpanalysis.com/PDSPSI-materials
Thanks to everyone who registered and attended!
- Dmitry Vostokov @ DumpAnalysis.org + TraceAnalysis.org -
Posted in Announcements, Crash Dump Analysis, Crash Dump Patterns, DebugWare Patterns, Debugging, Debugging Methodology, Escalation Engineering, Mac Crash Corner, Malware Analysis, Malware Patterns, Memory Analysis Forensics and Intelligence, Software Architecture, Software Behavior Patterns, Software Engineering, Software Technical Support, Software Trace Analysis, Software Tracing Implementation Patterns, Software Troubleshooting Patterns, Structural Memory Patterns, Structural Trace Patterns, Tools, Trace Analysis Patterns, Training and Seminars, Troubleshooting Methodology, Unified Debugging Patterns, Webinars, Workaround Patterns | No Comments »
Monday, March 14th, 2011
“… he who has not been in” support “does not know what” debugging “is.”
Attributed to Leo Tolstoy, by Adam Ulam, The Bolsheviks
- Dmitry Vostokov @ DumpAnalysis.org + TraceAnalysis.org -
Posted in Bugtations, Crash Dump Analysis, Debugging, Escalation Engineering, Fun with Crash Dumps, Fun with Debugging, Fun with Software Traces, Software Engineering, Software Technical Support, Software Trace Analysis | No Comments »
Thursday, March 10th, 2011
Because the number of software trace patterns is growing I’m starting another checklist in addition to memory dump analysis checklist. The goal is to help experienced engineers not to miss any important information. The checklist doesn’t prescribe any specific steps, just lists all possible points to double check when looking at a software trace. Of course, it is not complete at the moment and any suggestions are welcome. This post will be modified on the ongoing basis.
General:
• Check overall trace time delta
• Check no trace metafile message density
• Check whether a trace is a multi-part or a circular
• Check for basic facts and the story (software narrative)
• Check for any exceptions, non-false positive errors and periodic errors
• Check for significant events
• Check for discontinuities in the time domain
• Check for message current and acceleration in the frequency domain
- Dmitry Vostokov @ DumpAnalysis.org + TraceAnalysis.org -
Posted in CDF Analysis Tips and Tricks, Debugging, Debugging Methodology, Escalation Engineering, Software Technical Support, Software Trace Analysis, Software Trace Reading, Trace Analysis Patterns, Troubleshooting Methodology | No Comments »
Monday, March 7th, 2011

The first Webinar to start an in-depth discussion of pattern-driven software troubleshooting, debugging and maintenance:
Date: 25th of March 2011
Time: 18:30 (GMT) 14:30 (EST) 11:30 (PST)
Duration: 60 minutes
Space is limited.
Reserve your Webinar seat now at:
https://www3.gotomeeting.com/register/448268158
Topics include:
- A Short History of DumpAnalysis.org
- Memory Dump Analysis Patterns
- Troubleshooting and Debugging Tools (Debugware) Patterns
- Software Trace Analysis Patterns
- From Software Defects to Software Behavior
- Workaround Patterns
- Structural Memory Patterns
- Memory Analysis Domain Pattern Hierarchy
- New Directions
Prerequisites: experience in software troubleshooting and/or debugging.
- Dmitry Vostokov @ DumpAnalysis.org + TraceAnalysis.org -
Posted in .NET Debugging, Analysis Notation, Announcements, AntiPatterns, Best Practices, CDA Pattern Classification, Crash Dump Analysis, Crash Dump Patterns, DebugWare Patterns, Debugging, Debugging Methodology, Debugging Trends, Escalation Engineering, Java Debugging, Linux Crash Corner, Mac Crash Corner, Malware Analysis, Malware Patterns, Memory Analysis Forensics and Intelligence, Memory Dump Analysis Services, Pattern Models, Pattern Prediction, Presentations, Software Behavior Patterns, Software Chorology, Software Engineering, Software Narratology, Software Technical Support, Software Trace Analysis, Software Trace Reading, Software Tracing Implementation Patterns, Software Troubleshooting Patterns, Structural Memory Patterns, Structural Trace Patterns, Systems Thinking, Testing, Trace Analysis Patterns, Training and Seminars, Troubleshooting Methodology, Unified Debugging Patterns, Webinars, Workaround Patterns | No Comments »
Thursday, February 24th, 2011
Learning from Philip Marlowe, a detective:
“I like you,” she said suddenly. “You believe in miracles.”
Raymond Chandler, The Big Sleep
Do you believe in miracles from a driver modifying an arbitrary user space? Or in a miracle of suddenly disappearing software incidents?
- Dmitry Vostokov @ DumpAnalysis.org + TraceAnalysis.org -
Posted in Bugtations, Debugging, Escalation Engineering, Fun with Debugging, Kernel Development, Software Technical Support, The Way of Philip Marlowe | 1 Comment »
Monday, January 3rd, 2011
Resolution rush - The rush of software technical support and maintenance engineers to provide the resolution to a suddenly escalated incident.
Examples: After it crashed 3 times in a row at the customer site our VP was called and we all got the resolution rush.
- Dmitry Vostokov @ DumpAnalysis.org + TraceAnalysis.org -
Posted in Crash Dump Analysis, Debugging, Debugging Slang, Escalation Engineering, Fun with Crash Dumps, Fun with Debugging, Fun with Software Traces, Software Engineering, Software Technical Support, Software Trace Analysis | No Comments »
Sunday, January 2nd, 2011
Working for more than 7 years in technical support environment I found that many support incidents were resolved more easily by abductive reasoning than by induction and deduction practiced by Sherlock Holmes and observed by Dr. Watson. Abduction as a way to build an incident theory to advance in problem resolution was practiced by a USA colleague of Holmes: Philip Marlowe. Because technical support is less detached from customers (”the world”) when compared to software engineering departments I see the way of Marlowe as more natural. Of course, from time to time the way of Holmes is also appropriate. All depends on a support case. I found that abductive reasoning is also appropriate for memory dump and software trace analysis where “leaps of faith” are necessary because of insufficient information. Such leaps of abduction actually happen all the time when analysts give troubleshooting advice based on patterns.
I plan to write more about the 3rd way of reasoning after I finish reading two Raymond Chandler’s novels and a few other inference, causality and explanation books I mention later: The Big Sleep & Farewell, My Lovely (Modern Library) .
.

I’m grateful for Clive Gamble for pointing this way out in his book Archaeology: The Basics

- Dmitry Vostokov @ DumpAnalysis.org + TraceAnalysis.org -
Posted in Archaeology of Computer Memory, Books, Crash Dump Analysis, Debugging, Debugging Methodology, Dr. Watson, Escalation Engineering, Logic, New Debugging School, Software Technical Support, Software Trace Analysis, The Way of Philip Marlowe, Troubleshooting Methodology | No Comments »
Saturday, January 1st, 2011
With the new year starts the new initiative to integrate traditional multidisciplinary debugging approaches and methodologies with multiplatform pattern-driven software problem solving, unified debugging patterns, best practices in memory dump analysis and software tracing, computer security, economics, and the new emerging trends I’m going to write about during this year.
- Dmitry Vostokov @ DumpAnalysis.org + TraceAnalysis.org -
Posted in Announcements, Best Practices, Computer Forensics, Computer Science, Countefactual Debugging, Crash Analysis Report Environment (CARE), Crash Dump Analysis, Crash Dump Patterns, DebugWare Patterns, Debugging, Debugging Industry, Debugging Methodology, Debugging Trends, Dublin School of Security, Economics, Education and Research, Escalation Engineering, First Fault Problem Solving, Malware Analysis, Malware Patterns, Mathematics of Debugging, Memiotics (Memory Semiotics), Memoretics, Memory Analysis Forensics and Intelligence, Memory Analysis Report System, Memory Dump Analysis Services, Memory Systems Language, Memory Visualization, New Debugging School, Science of Memory Dump Analysis, Science of Software Tracing, Security, Software Behavior Patterns, Software Defect Construction, Software Engineering, Software Generalist, Software Maintenance Institute, Software Narratology, Software Trace Analysis, Software Trace Visualization, Software Tracing Implementation Patterns, Software Troubleshooting Patterns, Structural Memory Patterns, Structural Trace Patterns, Systems Thinking, Testing, Tool Objects, Tools, Trace Analysis Patterns, Training and Seminars, Troubleshooting Methodology, Unified Debugging Patterns, Victimware, Visual Dump Analysis, Webinars, Workaround Patterns | No Comments »
 Group")