Archive for the ‘Debugging’ Category
Wednesday, May 5th, 2010
PLOT - Program Lines of Trace - the source code lines behind trace messages
Examples: What a plot do we have here! The struggle against the monster database component and endless voyages across space boundaries.
- Dmitry Vostokov @ DumpAnalysis.org + TraceAnalysis.org
Posted in Debugging, Debugging Slang, Escalation Engineering, New Acronyms, Software Engineering, Software Narratology, Software Technical Support, Software Trace Analysis, Trace Analysis Patterns | 1 Comment »
Friday, April 30th, 2010
Memory Dump Analysis Anthology lacks full color inserts. This is rather a current limitation of POD technology that OpenTask publisher uses at the present time. The solution previously announced a year ago is to print a separate full color title with selected articles and illustrations. Finally, it is about to be published next month. The book front and back covers are collages from covers of individual memory dump analysis volumes:
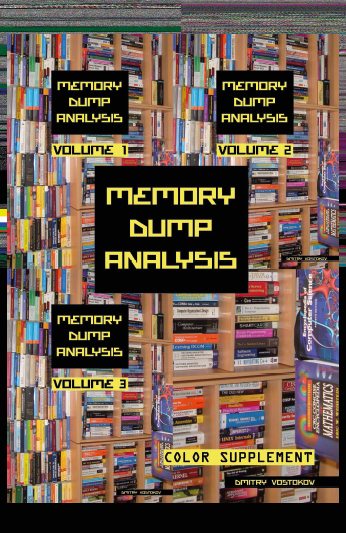
TOC will be available soon. Here is the book data:
- Title: Memory Dump Analysis Anthology: Color Supplement for Volumes 1-3
- Author: Dmitry Vostokov
- Publisher: OpenTask (May 2010)
- Language: English
- Product Dimensions: 21.6 x 14.0
- Paperback: 110 pages
- ISBN-13: 978-1906717698
OpenTask also plans a separate color supplement for volumes 4 and 5 once they are published.
- Dmitry Vostokov @ DumpAnalysis.org + TraceAnalysis.org -
Posted in Announcements, Books, Crash Dump Analysis, Debugging, Fun with Crash Dumps, Memory Space Art, Memory Visualization, Publishing, Software Trace Visualization | 2 Comments »
Thursday, April 22nd, 2010
I’ve decided to adapt archaeological classificatory framework (using my favourite method of inquiry: metaphorical bijectionism) to lay out foundations for yet another attempt to classify DA+TA patterns):
Attribute  ↔ Pattern

Artefact   ↔ Component Artefact1

Assemblage ↔ Component Assemblage

Culture    ↔ Memory System Culture
2

1 Can be either a component-generated artefact or a component like a module or symbol file
2 Typical examples of memory system cultures are Windows, UNIX or even “Multiplatform”
I propose a word Memoarchaeological for such a framework and Memoarchaeology for a branch of Memoretics that studies saved computer memory artifacts from past computations (as opposed to live memory).
Note: In one of the forthcoming issues of Debugged! MZ/PE magazine there will be presented yet another classificatory scheme.
- Dmitry Vostokov @ DumpAnalysis.org + TraceAnalysis.org -
Posted in Announcements, Archaeology of Computer Memory, CDA Pattern Classification, Crash Dump Analysis, Crash Dump Patterns, Debugging, Memoretics, Memory Analysis Forensics and Intelligence, New Words, Science of Memory Dump Analysis, Science of Software Tracing, Software Behavior Patterns, Software Trace Analysis, Trace Analysis Patterns | No Comments »
Tuesday, April 20th, 2010
The following tool published by Citrix follows DebugWare patterns in its overall architecture and design and was implemented by a team of engineers using RADII process:
SsOnExpert - Single Sign-On XenApp Plug-in Troubleshooting Tool
- Dmitry Vostokov @ DumpAnalysis.org + TraceAnalysis.org -
Posted in Announcements, Citrix, DebugWare Patterns, Debugging, Debugging Methodology, Escalation Engineering, Software Architecture, Software Engineering, Software Maintenance Institute, Software Technical Support, Tools, Troubleshooting Methodology | No Comments »
Monday, April 19th, 2010
Today we introduce an icon for Insufficient Memory (virtual memory) pattern:
B/W

Color

Note: it features fragments from B/W and color images generated by Dump2Picture.
- Dmitry Vostokov @ DumpAnalysis.org + TraceAnalysis.org -
Posted in Crash Dump Analysis, Crash Dump Patterns, Debugging, Memory Visualization, Pattern Icons, Visual Dump Analysis | No Comments »
Sunday, April 18th, 2010
OpenTask to offer first 3 volumes of Memory Dump Analysis Anthology in one set:


The set is available exclusively from OpenTask e-Commerce web site starting from June. Individual volumes are also available from Amazon, Barnes & Noble and other bookstores worldwide.
Product information:
- Title: Modern Memory Dump and Software Trace Analysis: Volumes 1-3
- Author: Dmitry Vostokov
- Language: English
- Product Dimensions: 22.86 x 15.24
- Paperback: 1600 pages
- Publisher: Opentask (31 May 2010)
- ISBN-13: 978-1-906717-99-5
Information about individual volumes:
- Dmitry Vostokov @ DumpAnalysis.org + TraceAnalysis.org -
Posted in .NET Debugging, Aesthetics of Memory Dumps, Announcements, AntiPatterns, Art, Assembly Language, Books, Bugchecks Depicted, C and C++, CDA Pattern Classification, CDF Analysis Tips and Tricks, Categorical Debugging, Certification, Citrix, Code Reading, Common Mistakes, Computational Ghosts and Bug Hauntings, Computer Science, Countefactual Debugging, Crash Analysis Report Environment (CARE), Crash Dump Analysis, Crash Dump Patterns, Crash Dumps for Dummies, Data Recovery, DebugWare Patterns, Debugging, Debugging Methodology, Debugging Slang, Deep Down C++, Dictionary of Debugging, Dr. Watson, Education and Research, Escalation Engineering, Fun with Crash Dumps, Futuristic Memory Dump Analysis, GDB for WinDbg Users, Hardware, History, Horrors of Computation, Hyper-V, Intelligent Memory Movement, Kernel Development, Laws of Troubleshooting and Debugging, Mathematics of Debugging, Memiotics (Memory Semiotics), Memoidealism, Memoretics, Memory Analysis Culture, Memory Analysis Forensics and Intelligence, Memory Auralization, Memory Dump Analysis Jobs, Memory Religion (Memorianity), Memory Space Art, Memory Space Music, Memory Systems Language, Memory Visualization, Memuonics, Minidump Analysis, Multithreading, Music for Debugging, Music of Computation, New Acronyms, New Words, Occult Debugging, Philosophy, Psi-computation, Publishing, Science of Memory Dump Analysis, Science of Software Tracing, Security, Software Architecture, Software Defect Construction, Software Engineering, Software Generalist, Software Maintenance Institute, Software Narratology, Software Technical Support, Software Trace Analysis, Software Trace Visualization, Software Tracing for Dummies, Software Victimology, Stack Trace Collection, Testing, Tools, Trace Analysis Patterns, Training and Seminars, Troubleshooting Methodology, Victimware, Virtualization, Vista, Visual Dump Analysis, WinDbg Scripts, WinDbg Tips and Tricks, WinDbg for GDB Users, Windows 7, Windows Server 2008, Windows System Administration | No Comments »
Friday, April 16th, 2010
After checking that Vista still has old MS-DOS real mode 16-bit debug.exe with commands similar to WinDbg ones I tried to debug notepad.exe:
C:\Users\user>debug

-?

assemble     A [address]

compare      C range address

dump         D [range]

enter        E address [list]

fill         F range list

go           G [=address] [addresses]

hex          H value1 value2

input        I port

load         L [address] [drive] [firstsector] [number]

move         M range address

name         N [pathname] [arglist]

output       O port byte

proceed      P [=address] [number]

quit         Q

register     R [register]

search       S range list

trace        T [=address] [value]

unassemble   U [range]

write        W [address] [drive] [firstsector] [number]

allocate expanded memory        XA [#pages]

deallocate expanded memory      XD [handle]

map expanded memory pages       XM [Lpage] [Ppage] [handle]

display expanded memory status  XS
As expected it debugs the MSDOS (MZ) portion of notepad.exe:
C:\Users\user>debug c:\windows\system32\notepad.exe

-u

17DB:0000 0E            PUSH    CS

17DB:0001 1F            POP     DS

17DB:0002 BA0E00        MOV     DX,000E

17DB:0005 B409          MOV     AH,09

17DB:0007 CD21          INT     21

17DB:0009 B8014C        MOV     AX,4C01

17DB:000C CD21          INT     21

17DB:000E 54            PUSH    SP

17DB:000F 68            DB      68

17DB:0010 69            DB      69

17DB:0011 7320          JNB     0033

17DB:0013 7072          JO      0087

17DB:0015 6F            DB      6F

17DB:0016 67            DB      67

17DB:0017 7261          JB      007A

17DB:0019 6D            DB      6D

17DB:001A 206361        AND     [BP+DI+61],AH

17DB:001D 6E            DB      6E

17DB:001E 6E            DB      6E

17DB:001F 6F            DB      6F

-t
AX=0000  BX=FFFF  CX=FE00  DX=0000  SP=00B6  BP=0000  SI=0000  DI=0000

DS=17CB  ES=17CB  SS=17DB  CS=17DB  IP=0001   NV UP EI PL NZ NA PO NC

17DB:0001 1F            POP     DS

-t
AX=0000  BX=FFFF  CX=FE00  DX=0000  SP=00B8  BP=0000  SI=0000  DI=0000

DS=17DB  ES=17CB  SS=17DB  CS=17DB  IP=0002   NV UP EI PL NZ NA PO NC

17DB:0002 BA0E00        MOV     DX,000E

-t
AX=0000  BX=FFFF  CX=FE00  DX=000E  SP=00B8  BP=0000  SI=0000  DI=0000

DS=17DB  ES=17CB  SS=17DB  CS=17DB  IP=0005   NV UP EI PL NZ NA PO NC

17DB:0005 B409          MOV     AH,09

-g

This program cannot be run in DOS mode.
Program terminated normally

-
So I was looking for a real MSDOS program to debug and thought that debug.exe would be a natural choice. Unfortunately there was an illegal instruction during double debugging:
C:\Users\user>debug c:\windows\system32\debug.exe

-g

-g
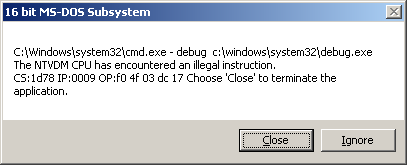
So it looks like WinDbg double debugging is much more robust despite the bigger file size (debug.exe is only 21KB).
- Dmitry Vostokov @ DumpAnalysis.org + TraceAnalysis.org -
Posted in Debugging, Fun with Crash Dumps | No Comments »
Wednesday, April 14th, 2010
Time flows fast and I have refined my code I wrote at 6 year anniversary to include finer monthly tracing:
switch (months_at_citrix)

{

  case 60:

    write_blog_post(”I’ve just passed 5 year mark … “);

    wait_for_certificate();

    write_blog_post(”Shortly after celebrating 5 years … “);

    break;

  case 72:

    write_blog_post(”Threads in my process run very fast. Not long ago … “);

    break;

  case 78:

    write_blog_post(”Time flows fast and I have refined my code …“);

    break;

case 84:

    // … TBD

}
- Dmitry Vostokov @ DumpAnalysis.org + TraceAnalysis.org -
Posted in Announcements, Citrix, Crash Dump Analysis, Debugging, Escalation Engineering, History, Software Engineering, Software Technical Support, Software Trace Analysis | 1 Comment »
Tuesday, April 13th, 2010
Do you see my thread of thought? Tender ≈ easily crushed, so a tender button can easily crash or can be easily cr(a)ushed. When I saw the title of a book “Tender Buttons” I immediately recalled TestDefaultDebugger and similar programs. Apartment is from COM lexicon.
Tender buttons that crash: objects, messages, apartments.
Gertrude Stein, The Tender buttons: objects, food, rooms
- Dmitry Vostokov @ DumpAnalysis.org + TraceAnalysis.org -
Posted in Bugtations, Crash Dump Analysis, Debugging, Fun with Crash Dumps, Tools | No Comments »
Monday, April 12th, 2010
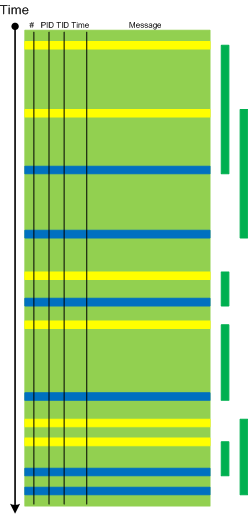
When a software trace is lengthy it is useful to partition it into several regions based on a sequence of Anchor Messages. The choice of them can be determined by a Vocabulary Index or an Adjoint Thread of Activity. For example, an ETW trace with almost 900,000 messages recorded during a desktop connection for 6 minutes can be split into 14 segments by the adjoint thread of DLL_PROCESS_ATTACH message (the message was generated by DllMain of an injected module, not shown in the trace output for formatting clarity):
#      PID  TID  Time         Message

24226  2656 3480 10:41:05.774 AppA.exe: DLL_PROCESS_ATTACH

108813 4288 4072 10:41:05.774 AppB.exe: DLL_PROCESS_ATTACH

112246 4180 3836 10:41:05.940 DllHost.exe: DLL_PROCESS_ATTACH

135473 2040 3296 10:41:12.615 AppC.exe: DLL_PROCESS_ATTACH

694723 1112 1992 10:44:23.393 AppD.exe: DLL_PROCESS_ATTACH

703962 5020 1080 10:44:42.014 DllHost.exe: DLL_PROCESS_ATTACH

705511 4680 3564 10:44:42.197 DllHost.exe: DLL_PROCESS_ATTACH

705891 1528 2592 10:44:42.307 regedit.exe: DLL_PROCESS_ATTACH

785231 2992 4912 10:45:26.516 AppE.exe: DLL_PROCESS_ATTACH

786523 3984 1156 10:45:26.605 powershell.exe: DLL_PROCESS_ATTACH

817979 4188 4336 10:45:48.707 wermgr.exe: DLL_PROCESS_ATTACH

834875 3976 1512 10:45:52.342 LogonUI.exe: DLL_PROCESS_ATTACH

835229 4116 3540 10:45:52.420 AppG.exe: DLL_PROCESS_ATTACH
Each region can be analyzed independently for any anomalies, for example, to look for the answer to the question why wermgr.exe was launched. An example of partitioning is illustrated on the following schematic diagram:
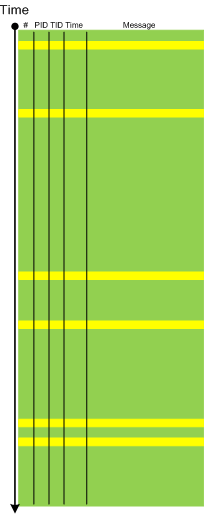
It is also possible to make another trace segmentation by interleaving regions above with another set of anchor messages comprising of the adjoint thread of DLL_PROCESS_DETACH message:
- Dmitry Vostokov @ DumpAnalysis.org + TraceAnalysis.org -
Posted in CDF Analysis Tips and Tricks, Debugging, Software Trace Analysis, Trace Analysis Patterns | 3 Comments »