Archive for the ‘Debugging’ Category
Friday, April 9th, 2010
Plan to start providing training and seminars in my free time. If you are interested please answer these questions (you can either respond here in comments or use this form for private communication http://www.dumpanalysis.org/contact):
- Are you interested in on-site training, prefer traveling or attending webinars?
- Are you interested in software trace analysis as well?
- What specific topics are you interested in?
- What training level (beginner, intermediate, advanced) are you interested in? (please provide an example, if possible)
Additional topics of expertise that can be integrated into training include Source Code Reading and Analysis, Debugging, Windows Architecture, Device Drivers, Troubleshooting Tools Design and Implementation, Multithreading, Deep Down C and C++, x86 and x64 Assembly Language Reading.
Looking forward to your responses. Any suggestions are welcome.
- Dmitry Vostokov @ DumpAnalysis.org + TraceAnalysis.org -
Posted in .NET Debugging, Announcements, AntiPatterns, Assembly Language, Bugchecks Depicted, C and C++, CDA Pattern Classification, CDF Analysis Tips and Tricks, Certification, Code Reading, Common Mistakes, Crash Analysis Report Environment (CARE), Crash Dump Analysis, Crash Dump Patterns, Crash Dumps for Dummies, Data Recovery, DebugWare Patterns, Debugging, Debugging Methodology, Deep Down C++, Education and Research, Escalation Engineering, FreeBSD Crash Corner, GDB for WinDbg Users, Hardware, Hyper-V, Java Debugging, Kernel Development, Laws of Troubleshooting and Debugging, Linux Crash Corner, Mac Crash Corner, Memory Analysis Forensics and Intelligence, Memory Visualization, Minidump Analysis, Multithreading, Security, Software Architecture, Software Defect Construction, Software Engineering, Software Generalist, Software Maintenance Institute, Software Narratology, Software Technical Support, Software Trace Analysis, Software Trace Visualization, Software Tracing for Dummies, Software Victimology, Stack Trace Collection, Testing, Tools, Trace Analysis Patterns, Training and Seminars, Troubleshooting Methodology, Victimware, Virtualization, Vista, Visual Dump Analysis, WinDbg Scripts, WinDbg Tips and Tricks, WinDbg for GDB Users, Windows 7, Windows Server 2008, Windows System Administration, Workaround Patterns | No Comments »
Thursday, April 8th, 2010
“Capturing delicate moments, one gives birth to a poetry of traces …”
Ange Leccia, Motionless Journeys, by Fabien Danesi
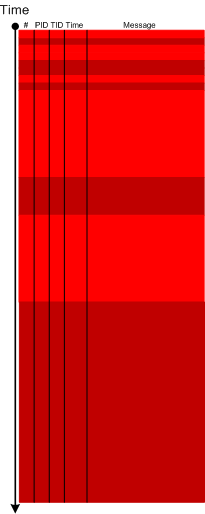
More patterns from software narratology. Now we illustrate Defamiliarizing Effect where we see sudden unfamiliar trace statements across familiar landscape of characteristic blocks and activity regions:
/familar traces/
/new trace from a problem system/
- Dmitry Vostokov @ DumpAnalysis.org + TraceAnalysis.org -
Posted in CDF Analysis Tips and Tricks, Citrix, Debugging, Software Narratology, Software Trace Analysis, Software Trace Visualization, Trace Analysis Patterns | 1 Comment »
Thursday, April 8th, 2010
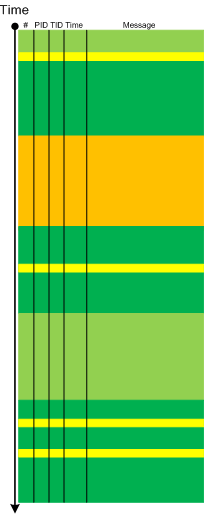
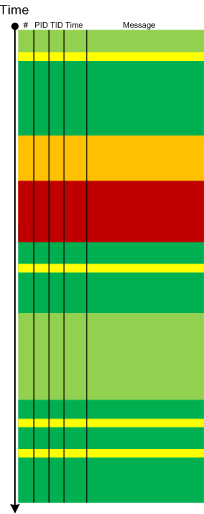
Metaphorical bijection from literary narratology to software narratology provides a pattern of Background and Foreground Components. This can be easily illustrated on pseudo-trace color diagrams. Suppose we troubleshoot a graphical issue using an ETW trace containing the output from all components of the problem system. Graphic components and their messages are foreground for a trace viewer (a person) against numerous background components (for example, database, file and registry access, shown in shades of green):
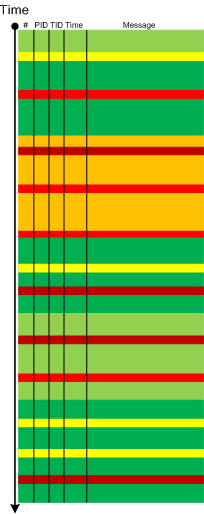
Trace viewers (for example, CDFAnalyzer) can filter out background component messages and present only foreground components (that I propose to call component foregrounding):
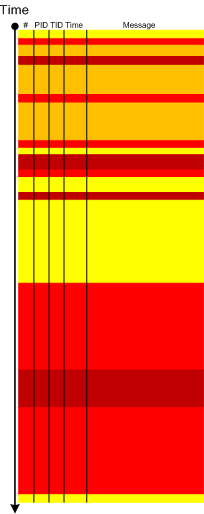
Of course, this process is iterative and parts of what once was foreground become background and candidates for further filtering:
- Dmitry Vostokov @ DumpAnalysis.org + TraceAnalysis.org -
Posted in CDF Analysis Tips and Tricks, Citrix, Debugging, Software Narratology, Software Trace Analysis, Software Trace Visualization, Tools, Trace Analysis Patterns | 2 Comments »
Thursday, April 8th, 2010
This is a new open source tool similar to PDBFinder in functionality but with much simpler interface and internal implementation (based on the file name structure of the certain classes of TMF files for ETW). To be released this month on TraceAnalysis.org.
- Dmitry Vostokov @ DumpAnalysis.org + TraceAnalysis.org -
Posted in CDF Analysis Tips and Tricks, Citrix, Debugging, Escalation Engineering, Software Technical Support, Software Trace Analysis, Tools | No Comments »
Wednesday, April 7th, 2010
Previously introduced Coupled Processes pattern involves an active request (or an action) and an active wait for a response (or the action status):

It is illustrated on this simple UML sequence diagram (process timeline represent collective request-response threads):
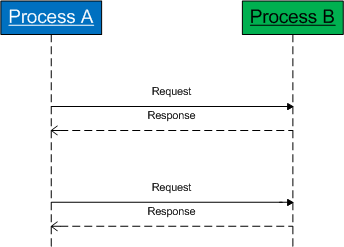
However, there is so called weak coupling when a process subscribes for notifications. Such threads most of the time are passive and processes are not blocked:

The coupling manifests itself when notifier threads start spiking CPU and bring their share of CPU consumption to the notified threads:
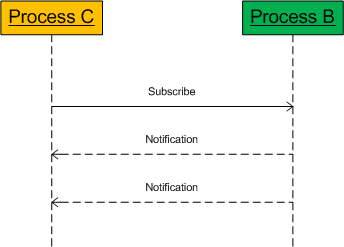
Here is an example of such threads from the forthcoming pattern interaction case study:
   5  Id: 61018.dbec Suspend: 1 Teb: 7ffae000 Unfrozen

ChildEBP RetAddr

01e3fa68 7c82787b ntdll!KiFastSystemCallRet

01e3fa6c 77c80a6e ntdll!NtRequestWaitReplyPort+0xc

01e3fab8 77c7fcf0 rpcrt4!LRPC_CCALL::SendReceive+0x230

01e3fac4 77c80673 rpcrt4!I_RpcSendReceive+0x24

01e3fad8 77ce315a rpcrt4!NdrSendReceive+0x2b

01e3fec0 771f4fbd rpcrt4!NdrClientCall2+0x22e

01e3fed8 771f4f60 winsta!RpcWinStationWaitSystemEvent+0x1c

01e3ff20 6582116c winsta!WinStationWaitSystemEvent+0x51

[...]

01e3ffec 00000000 kernel32!BaseThreadStart+0x34
In cases of synchronous notifications if a notified thread is blocked we have an instance of a reversed strong coupling.
- Dmitry Vostokov @ DumpAnalysis.org + TraceAnalysis.org -
Posted in Crash Dump Analysis, Crash Dump Patterns, Debugging | 3 Comments »
Monday, April 5th, 2010
Typical software narrative history consists of requests and responses, for example, function or object method calls and returns:
#     Module PID  TID  Time         File    Function Message

[...]

26060 dllA   1604 7108 10:06:21.746 fileA.c foo      Calling bar

[...]

26232 dllA   1604 7108 10:06:22.262 fileA.c foo      bar returns 0x5

[...]
The code that generates execution history is response-complete if it traces both requests and responses. For such code (except in cases where tracing is stopped before a response) the absence of expected responses could be a sign of blocked threads or quiet exception processing. The code that generates execution history is exception-complete if it also traces exception processing. Response-complete and exception-complete code is called call-complete. If we don’t see response messages for call-complete code we have Incomplete History.
In general, we can talk about the absence of certain messages in a trace as a deviation from the standard trace sequence template corresponding to a use case. The difference there is in a missing request too. This is a topic for next patterns.
- Dmitry Vostokov @ DumpAnalysis.org + TraceAnalysis.org -
Posted in CDF Analysis Tips and Tricks, Debugging, Software Narratology, Software Trace Analysis, Trace Analysis Patterns | No Comments »
Monday, April 5th, 2010
I’m very pleased to announce that the Korean edition is available:

The book can be found on:
- Dmitry Vostokov @ DumpAnalysis.org + TraceAnalysis.org -
Posted in Announcements, AntiPatterns, Assembly Language, Books, Books (Korean), C and C++, Computer Science, Crash Dump Analysis, Crash Dump Patterns, Crash Dumps for Dummies, Debugging, Dr. Watson, Escalation Engineering, Fun with Crash Dumps, GDB for WinDbg Users, Hardware, Kernel Development, Mathematics of Debugging, Memiotics (Memory Semiotics), Memoretics, Memory Space Music, Memory Visualization, Minidump Analysis, Multithreading, Publishing, Science of Memory Dump Analysis, Security, Software Architecture, Software Engineering, Software Technical Support, Testing, Tools, Troubleshooting Methodology, Virtualization, Vista, WinDbg Scripts, WinDbg Tips and Tricks, WinDbg for GDB Users, Windows Server 2008, Windows System Administration | No Comments »
Friday, April 2nd, 2010
After this 1st of April evening spent in circus with my family I approached a PC to check my blog (seen from the window) and found a number format exception on a side bar currency conversion widget:
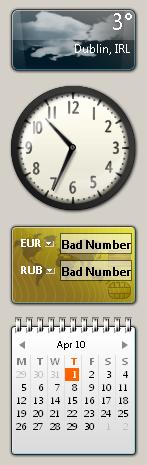
At first I panicked but then recalled that I already encountered some currency conversion problems with that widget. At the time of this writing, it is no long a local April Fool’s day but the problem persists.
- Dmitry Vostokov @ DumpAnalysis.org + TraceAnalysis.org -
Posted in Computational Ghosts and Bug Hauntings, Debugging | 2 Comments »
Thursday, April 1st, 2010
A silicon based company announced a new product called GoToMyBug for remote viewing of bugs ……fff.fff.f.H.A…t….H..H%….u…A..H.EA.u.H……….ff.L..A…I..A.B..t-I..I.R.L..I..t.I….H..f…I…u.I..[.A…I..L..I……t.I…I..H…..f..H……H…I…u………fff.fff.ff.S…L..H..L..I..I.R…t…L..A…M..H…….I…u.I..[…%…..u.
- Dmitry Vostokov @ DumpAnalysis.org + TraceAnalysis.org -
Posted in Announcements, Debugging, History | 1 Comment »
Wednesday, March 24th, 2010
Here is one of the first case studies in pattern-driven software trace analysis. A user starts printing but nothing comes out. However, if the older printer driver is installed everything works as expected. We suspect that print spooler crashes if the newer printer driver is used. Based on known module name in ETW trace we find PID for print spooler process (19984) and immediately see discontinuity in the trace with the large time delta between the last PID message and the last trace statement (almost 4 minutes):
No   Source        PID   TID   Time         Message

712  \src\print\ui 19984 16200 12:22:31.571 PropertySheet returns 1

[… no messages for PID 19984 …]

5103 \src\mgmt   1292  7604  12:26:11.659 WaitAction
If we select the adjoint thread of source \src\print\driver (in other words, filter only its messages) we would see discontinuity with the similar time delta. We know that printer driver runs in print spooler context. However, PID had changed and that means print spooler was restarted (perhaps after a crash):
No   Source            PID   TID   Time         Message

557  \src\print\driver 19984 16200 12:22:28.069 DisableDevice returns

[… discontinuity for \print\driver …]

1462 \src\print\driver 10828 17584 12:26:03.854 DllMain
- Dmitry Vostokov @ DumpAnalysis.org + TraceAnalysis.org -
Posted in CDF Analysis Tips and Tricks, Debugging, Software Trace Analysis, Trace Analysis Patterns | No Comments »