Icons for Memory Dump Analysis Patterns (Part 42)
Wednesday, May 19th, 2010Today we introduce an icon for Double Free (kernel pool) pattern:
B/W
![]()
Color
![]()
- Dmitry Vostokov @ DumpAnalysis.org + TraceAnalysis.org -
Today we introduce an icon for Double Free (kernel pool) pattern:
B/W
![]()
Color
![]()
- Dmitry Vostokov @ DumpAnalysis.org + TraceAnalysis.org -
Today we introduce an icon for Double Free (process heap) pattern:
B/W
![]()
Color
![]()
- Dmitry Vostokov @ DumpAnalysis.org + TraceAnalysis.org -
Today we introduce an icon for Unknown Component pattern:
B/W
![]()
Color
![]()
- Dmitry Vostokov @ DumpAnalysis.org + TraceAnalysis.org -
Pictures taken today during weekend nature walks (debugging walkthroughs) in Dublin suburbs:
Before A Debugging Session

Looking For Bugs

Found A Bug

Looking For More Bugs
- Dmitry Vostokov @ DumpAnalysis.org + TraceAnalysis.org -
Just noticed a rare event when all three volumes of Memory Dump Analysis Anthology occupy the first 3 positions on Bestsellers in Assembly Language Programming Amazon list (observed at the time of this writing):

- Dmitry Vostokov @ DumpAnalysis.org + TraceAnalysis.org -
Due to many requests for memory dumps corresponding to crash dump analysis patterns I’ve started modeling software behaviour and defects. Every pattern will have an example application(s), service(s) or driver(s) or combination of them. Their execution results in memory layout that corresponds to memory or trace analysis patterns. Today we introduce an example model for Multiple Exceptions (user mode) pattern. The following source code models 3 threads each having an exception during their execution on Windows XP, Windows 7 and Windows Server 2008 R2:
// MultipleExceptions-UserMode

// Copyright (c) 2010 Dmitry Vostokov

// GNU GENERAL PUBLIC LICENSE

// http://www.gnu.org/licenses/gpl-3.0.txt
#include <windows.h>

#include <process.h>
void thread_one(void *)

{

 *(int *)NULL = 0;

}
void thread_two(void *)

{

 *(int *)NULL = 0;

}
int main(int argc, WCHAR* argv[])

{

 _beginthread(thread_two, 0, NULL);

 _beginthread(thread_one, 0, NULL);
DebugBreak();
 return 0;

}
In fact, thread_one and thread_two can be replaced with just one function because they are identical. Visual C++ compiler does that during code optimization. On Windows 7 and W2K8 R2 I created LocalDumps registry key to save full crash dumps. On Windows XP I set Dr. Watson as a postmortem debugger (via drwtsn32 -i command and configured it to save full user dumps via drwtsn32 command that brings Dr. Watson GUI). Vista had some peculiar behaviour so I postponed its discussion for another post. The application can be downloaded from here (zip file contains source code, x86 and x64 binaries together with corresponding PDB files):
Download MultipleExceptions-UserMode.zip
Now I provide modeling results for x64 W2K8 R2 running on 2 processor machine. Windows 7 and Windows XP results are very similar. If we run x64 executable it crashes and a dump file is saved (x86 crash dump is similar). Default analysis command gives these results:
0:000> !analyze -v
[...]
FAULTING_IP:

MultipleExceptions_UserMode!thread_two+0

00000001`3f8b1000 c704250000000000000000 mov dword ptr [0],0
EXCEPTION_RECORD:  ffffffffffffffff -- (.exr 0xffffffffffffffff)

ExceptionAddress: 000007fefddc2442 (KERNELBASE!DebugBreak+0x0000000000000002)

   ExceptionCode: 80000003 (Break instruction exception)

  ExceptionFlags: 00000000

NumberParameters: 1

   Parameter[0]: 0000000000000000
[...]
ERROR_CODE: (NTSTATUS) 0x80000003 - {EXCEPTION} Breakpoint A breakpoint has been reached.
[...]
PRIMARY_PROBLEM_CLASS: STATUS_BREAKPOINT
[...]
STACK_TEXT:

00000001`3f8b1000 MultipleExceptions_UserMode!thread_two+0x0

00000001`3f8b10eb MultipleExceptions_UserMode!_callthreadstart+0x17

00000001`3f8b1195 MultipleExceptions_UserMode!_threadstart+0x95

00000000`778cf56d kernel32!BaseThreadInitThunk+0xd

00000000`77b03281 ntdll!RtlUserThreadStart+0x1d
[...]
We see debug break on the first thread:
0:000> kL

Child-SP          RetAddr           Call Site

00000000`002eec78 000007fe`fdd913a6 ntdll!NtWaitForMultipleObjects+0xa

00000000`002eec80 00000000`778d3143 KERNELBASE!WaitForMultipleObjectsEx+0xe8

00000000`002eed80 00000000`77949025 kernel32!WaitForMultipleObjectsExImplementation+0xb3

00000000`002eee10 00000000`779491a7 kernel32!WerpReportFaultInternal+0x215

00000000`002eeeb0 00000000`779491ff kernel32!WerpReportFault+0x77

00000000`002eeee0 00000000`7794941c kernel32!BasepReportFault+0x1f

00000000`002eef10 00000000`77b6573c kernel32!UnhandledExceptionFilter+0x1fc

00000000`002eeff0 00000000`77ae5148 ntdll! ?? ::FNODOBFM::`string'+0x2365

00000000`002ef020 00000000`77b0554d ntdll!_C_specific_handler+0x8c

00000000`002ef090 00000000`77ae5d1c ntdll!RtlpExecuteHandlerForException+0xd

00000000`002ef0c0 00000000`77b1fe48 ntdll!RtlDispatchException+0x3cb

00000000`002ef7a0 000007fe`fddc2442 ntdll!KiUserExceptionDispatcher+0x2e

00000000`002efd58 00000001`3f8b103c KERNELBASE!DebugBreak+0×2

00000000`002efd60 00000001`3f8b13fb MultipleExceptions_UserMode!main+0×2c

00000000`002efd90 00000000`778cf56d MultipleExceptions_UserMode!__tmainCRTStartup+0×15b

00000000`002efdd0 00000000`77b03281 kernel32!BaseThreadInitThunk+0xd

00000000`002efe00 00000000`00000000 ntdll!RtlUserThreadStart+0×1d
2 other threads show exception processing too:
0:000> ~1s; kL

ntdll!NtDelayExecution+0xa:

00000000`77b201fa c3              ret

Child-SP          RetAddr           Call Site

00000000`0076ef78 000007fe`fdd91203 ntdll!NtDelayExecution+0xa

00000000`0076ef80 00000000`77949175 KERNELBASE!SleepEx+0xab

00000000`0076f020 00000000`779491ff kernel32!WerpReportFault+0×45

00000000`0076f050 00000000`7794941c kernel32!BasepReportFault+0×1f

00000000`0076f080 00000000`77b6573c kernel32!UnhandledExceptionFilter+0×1fc

00000000`0076f160 00000000`77ae5148 ntdll! ?? ::FNODOBFM::`string’+0×2365

00000000`0076f190 00000000`77b0554d ntdll!_C_specific_handler+0×8c

00000000`0076f200 00000000`77ae5d1c ntdll!RtlpExecuteHandlerForException+0xd

00000000`0076f230 00000000`77b1fe48 ntdll!RtlDispatchException+0×3cb

00000000`0076f910 00000001`3f8b1000 ntdll!KiUserExceptionDispatcher+0×2e

00000000`0076fec8 00000001`3f8b10eb MultipleExceptions_UserMode!thread_two

00000000`0076fed0 00000001`3f8b1195 MultipleExceptions_UserMode!_callthreadstart+0×17

00000000`0076ff00 00000000`778cf56d MultipleExceptions_UserMode!_threadstart+0×95

00000000`0076ff30 00000000`77b03281 kernel32!BaseThreadInitThunk+0xd

00000000`0076ff60 00000000`00000000 ntdll!RtlUserThreadStart+0×1d
0:001> ~2s; kL

ntdll!NtDelayExecution+0xa:

00000000`77b201fa c3              ret

Child-SP          RetAddr           Call Site

00000000`0086e968 000007fe`fdd91203 ntdll!NtDelayExecution+0xa

00000000`0086e970 00000000`77949175 KERNELBASE!SleepEx+0xab

00000000`0086ea10 00000000`779491ff kernel32!WerpReportFault+0×45

00000000`0086ea40 00000000`7794941c kernel32!BasepReportFault+0×1f

00000000`0086ea70 00000000`77b6573c kernel32!UnhandledExceptionFilter+0×1fc

00000000`0086eb50 00000000`77ae5148 ntdll! ?? ::FNODOBFM::`string’+0×2365

00000000`0086eb80 00000000`77b0554d ntdll!_C_specific_handler+0×8c

00000000`0086ebf0 00000000`77ae5d1c ntdll!RtlpExecuteHandlerForException+0xd

00000000`0086ec20 00000000`77b1fe48 ntdll!RtlDispatchException+0×3cb

00000000`0086f300 00000001`3f8b1000 ntdll!KiUserExceptionDispatcher+0×2e

00000000`0086f8b8 00000001`3f8b10eb MultipleExceptions_UserMode!thread_two

00000000`0086f8c0 00000001`3f8b1195 MultipleExceptions_UserMode!_callthreadstart+0×17

00000000`0086f8f0 00000000`778cf56d MultipleExceptions_UserMode!_threadstart+0×95

00000000`0086f920 00000000`77b03281 kernel32!BaseThreadInitThunk+0xd

00000000`0086f950 00000000`00000000 ntdll!RtlUserThreadStart+0×1d
We look at unhandled exception filter parameter to get exception pointers information:
0:002> kv

Child-SP          RetAddr           : Args to Child                                                           : Call Site

[...]

00000000`0086ea70 00000000`77b6573c : 00000000`0086ebb0 00000000`00000006 00000001`00000000 00000000`00000001 : kernel32!UnhandledExceptionFilter+0×1fc
0:002> .exptr 00000000`0086ebb0
----- Exception record at 00000000`0086f7f0:

ExceptionAddress: 000000013f8b1000 (MultipleExceptions_UserMode!thread_two)

   ExceptionCode: c0000005 (Access violation)

  ExceptionFlags: 00000000

NumberParameters: 2

   Parameter[0]: 0000000000000001

   Parameter[1]: 0000000000000000

Attempt to write to address 0000000000000000
----- Context record at 00000000`0086f300:

rax=00000000000ef0b0 rbx=00000000000ef0b0 rcx=0000000000000000

rdx=0000000000000000 rsi=0000000000000000 rdi=0000000000000000

rip=000000013f8b1000 rsp=000000000086f8b8 rbp=0000000000000000

 r8=000007fffffda000  r9=0000000000000000 r10=0000000000000045

r11=000007fffffd9328 r12=0000000000000000 r13=0000000000000000

r14=0000000000000000 r15=0000000000000000

iopl=0         nv up ei pl nz na pe nc

cs=0033  ss=002b  ds=002b  es=002b  fs=0053  gs=002b             efl=00010202

MultipleExceptions_UserMode!thread_two:

00000001`3f8b1000 c704250000000000000000 mov dword ptr [0],0 ds:00000000`00000000=????????
What we now see that default analysis command showed the break instruction exception record and error code from the first thread but IP and stack trace from other threads having NULL pointer access violation exception.
- Dmitry Vostokov @ DumpAnalysis.org + TraceAnalysis.org -
Today we introduce an icon for Missing Thread pattern:
B/W
![]()
Color
![]()
- Dmitry Vostokov @ DumpAnalysis.org + TraceAnalysis.org -
Today we introduce an icon for Memory Leak (.NET heap) pattern:
B/W
![]()
Color
![]()
- Dmitry Vostokov @ DumpAnalysis.org + TraceAnalysis.org -
Today we introduce an icon for Memory Leak (process heap) pattern:
B/W
![]()
Color
![]()
- Dmitry Vostokov @ DumpAnalysis.org + TraceAnalysis.org -
Today we introduce an icon for Waiting Thread Time (user dumps) pattern:
B/W
![]()
Color
![]()
- Dmitry Vostokov @ DumpAnalysis.org + TraceAnalysis.org -
This pattern is similar to No Component Symbols memory analysis pattern and is called No Trace Metafile:
#     Module    PID  TID  Time        Message

21372 \src\dllA 2968 5476 3:55:10.004 Calling foo()

21373 Unknown   2968 5476 3:55:10.004 ????? Unknown( 27): GUID=1EF56EBD-A7FC-4892-8DBA-00AD813F8A24 (No Format Information found).

21374 Unknown   2968 5476 3:55:10.004 ????? Unknown( 27): GUID=1EF56EBD-A7FC-4892-8DBA-00AD813F8A24 (No Format Information found).

21375 Unknown   2968 5476 3:55:10.004 ????? Unknown( 27): GUID=1EF56EBD-A7FC-4892-8DBA-00AD813F8A24 (No Format Information found).

21376 Unknown   2968 5476 3:55:10.004 ????? Unknown( 28): GUID=1EF56EBD-A7FC-4892-8DBA-00AD813F8A24 (No Format Information found).

21377 Unknown   2968 5476 3:55:10.004 ????? Unknown( 23): GUID=1EF56EBD-A7FC-4892-8DBA-00AD813F8A24 (No Format Information found).

21378 \src\dllA 2968 5476 3:55:10.004 Calling bar()
In some case when we don’t have TMF files it is possible to detect broad behavioral patterns such as:
By looking at Thread of Activity we can also sometimes infer the possible component name based on surrounding trace messages with present TMF files, escpecially when we have source code access. For example, in the trace above it can be dllA or any other module that foo function calls.
- Dmitry Vostokov @ DumpAnalysis.org + TraceAnalysis.org -
Today we introduce an icon for Waiting Thread Time (kernel dumps) pattern:
B/W
![]()
Color
![]()
- Dmitry Vostokov @ DumpAnalysis.org + TraceAnalysis.org -
My drive to generalization led me to place an adornment on the portal to highlight the fact that memory and software trace analysis patterns are under an umbrella of general software behaviour patterns:
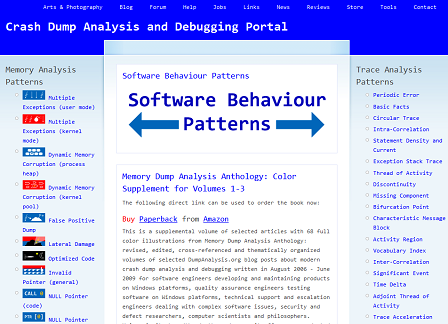
http://www.dumpanalysis.org/Software-Behavior-Patterns-Headline
In the forthcoming post series I plan to write about similarities between these two branches and also provide pattern examples from non-Windows platforms. All this material will provide the foundation for the forthcoming book Software Behavior: A Guide to Systematic Analysis (ISBN: 978-1906717162).
- Dmitry Vostokov @ DumpAnalysis.org + TraceAnalysis.org -
Previously announced book is now available on Amazon:
Memory Dump Analysis Anthology: Color Supplement for Volumes 1-3

- Dmitry Vostokov @ DumpAnalysis.org + TraceAnalysis.org -
Sometimes when a high number of interrupts is reported but there are no signs of an interrupt storm or pending DPCs in a memory dump file it is useful to search for Hardware Activity in running and / or suspected threads. This can be done by examining execution residue left on a thread raw stack. Although found driver activity might not be related to reported problems it can be a useful start for driver elimination procedure for the general recommendation to check drivers for any updates. Here is an example of a thread raw stack with a network card doing “Scatter-Gather” DMA (more extensive example is coming in a separate pattern cooperation case study):
1: kd> !thread

THREAD f7732090 Cid 0000.0000 Teb: 00000000 Win32Thread: 00000000 RUNNING on processor 1

Not impersonating

Owning Process 8089db40 Image: Idle

Attached Process N/A Image: N/A

Wait Start TickCount 0 Ticks: 24437545 (4:10:03:56.640)

Context Switch Count 75624870

UserTime 00:00:00.000

KernelTime 4 Days 08:56:05.125

Stack Init f78b3000 Current f78b2d4c Base f78b3000 Limit f78b0000 Call 0

Priority 0 BasePriority 0 PriorityDecrement 0

ChildEBP RetAddr Args to Child

f3b30c5c 00000000 00000000 00000000 00000000 LiveKdD+0x1c07
1: kd> dds f78b0000 f78b3000

f78b0000 00000000

f78b0004 00000000

f78b0008 00000000

f78b000c 00000000

f78b0010 00000000

[...]

f78b2870 8b3de0d0

f78b2874 80887b75 nt!KiFlushTargetSingleTb+0xd

f78b2878 8b49032c

f78b287c 00000000

f78b2880 2d003202

f78b2884 00000000

f78b2888 00000000

f78b288c 2d003202

f78b2890 8b490302

f78b2894 f78b28a4

f78b2898 80a61456 hal!KfLowerIrql+0x62

f78b289c 2d00320a

f78b28a0 00000000

f78b28a4 8b3de0d0

f78b28a8 8b3e3730

f78b28ac 00341eb0

f78b28b0 f78b2918

f78b28b4 f63fbf78 NetworkAdapterA!SendWithScatterGather+0×318

f78b28b8 8b3de0d0

f78b28bc 8b341eb0

f78b28c0 f78b28d4

f78b28c4 00000000

f78b28c8 80a5f3c0 hal!KfAcquireSpinLock

f78b28cc 00000000

f78b28d0 8b3de0d0

f78b28d4 00000000

f78b28d8 8b3de0d0

f78b28dc 8b3eb730

f78b28e0 005a7340

f78b28e4 f78b294c

f78b28e8 f63fbf78 NetworkAdapterA!SendWithScatterGather+0×318

f78b28ec 8b3de0d0

f78b28f0 8a5a7340

f78b28f4 f78b2908

f78b28f8 00000000

f78b28fc 8b3de0d0

f78b2900 8b0f5158

f78b2904 001e2340

f78b2908 f78b2970

f78b290c f63fbf78 NetworkAdapterA!SendWithScatterGather+0×318

f78b2910 8b3de0d0

f78b2914 8b1e2340

f78b2918 f78b292c

f78b291c 00000000

f78b2920 80a5f3c0 hal!KfAcquireSpinLock

f78b2924 00000000

f78b2928 8b3de0d0

f78b292c 00000000

f78b2930 8b3eb700

f78b2934 00000000

f78b2938 00000000

f78b293c 00000000

f78b2940 00000000

f78b2944 00000000

f78b2948 00000000

f78b294c 0a446aa2

f78b2950 f78b29b8

f78b2954 8b0f5158

f78b2958 8b01ce10

f78b295c 00000001

f78b2960 8b3de0d0

f78b2964 80a5f302 hal!HalpPerfInterrupt+0×32

f78b2968 00000001

f78b296c 8b3de0d0

f78b2970 80a5f302 hal!HalpPerfInterrupt+0×32

f78b2974 8b3de302

f78b2978 f78b2988

f78b297c 80a61456 hal!KfLowerIrql+0×62

f78b2980 80a5f3c0 hal!KfAcquireSpinLock

f78b2984 8b3de302

f78b2988 f78b29a4

f78b298c 80a5f44b hal!KfReleaseSpinLock+0xb

f78b2990 f63fbbbf NetworkAdapterA!SendPackets+0×1b3

f78b2994 8a446a90

f78b2998 8b0e8ab0

f78b299c 00000000

f78b29a0 008b29d0

f78b29a4 f78b29bc

f78b29a8 f7163790 NDIS!ndisMProcessSGList+0×90

f78b29ac 8b3de388

f78b29b0 f78b29d0

f78b29b4 00000001

f78b29b8 00000000

f78b29bc f78b29e8

f78b29c0 80a60147 hal!HalBuildScatterGatherList+0×1c7

f78b29c4 8b0e89b0

f78b29c8 00000000

f78b29cc 8a44cde8

f78b29d0 8b1e2340

f78b29d4 8a446aa2

f78b29d8 8b026ca0

f78b29dc 8b1e2340

f78b29e0 8b0e8ab0

f78b29e4 8b0e8ab0

f78b29e8 f78b2a44

f78b29ec f716369f NDIS!ndisMAllocSGList+0xda

f78b29f0 8a44cde8

f78b29f4 8b0e89b0

f78b29f8 8a446a70

f78b29fc 00000000

f78b2a00 00000036

f78b2a04 f7163730 NDIS!ndisMProcessSGList

f78b2a08 8b1e2340

f78b2a0c 00000000

f78b2a10 8a44cde8

f78b2a14 00000218

f78b2a18 8b1e2308

f78b2a1c 00000103

f78b2a20 8b0e8ab0

f78b2a24 8a446a70

f78b2a28 8a44cde8

f78b2a2c 00000036

f78b2a30 8b0e8ab0

f78b2a34 00000036

f78b2a38 00000000

f78b2a3c 00000000

f78b2a40 029a9e02

f78b2a44 f78b2a60

f78b2a48 f71402ff NDIS!ndisMSendX+0×1dd

f78b2a4c 8b490310

f78b2a50 8b1e2340

f78b2a54 8a446a70

f78b2a58 8a9a9e02

f78b2a5c 8a9a9e02

f78b2a60 f78b2a88

f78b2a64 f546c923 tcpip!ARPSendData+0×1a9

f78b2a68 8b3e76c8

f78b2a6c 8b1e2340

f78b2a70 8a9a9ea8

f78b2a74 8b490310

f78b2a78 80888b00 nt!RtlBackoff+0×68

f78b2a7c 8a446a70

f78b2a80 8a446aa2

f78b2a84 8a446a70

f78b2a88 f78b2ab4

f78b2a8c f546ba5d tcpip!ARPTransmit+0×112

f78b2a90 8b490310

f78b2a94 8b1e2340

f78b2a98 8a9a9ea8

f78b2a9c 00000103

f78b2aa0 8a446a70

f78b2aa4 00000000

f78b2aa8 8b342398

f78b2aac 8a47e1f8

f78b2ab0 8b1e2340

f78b2ab4 f78b2bf0

f78b2ab8 f546c4fc tcpip!_IPTransmit+0×866

f78b2abc 8a9a9ebc

f78b2ac0 f78b2b02

f78b2ac4 00000001

[…]
We also do a sanity check for coincidental symbols:
1: kd> ub f63fbf78

NetworkAdapterA!SendWithScatterGather+0x304:

f63fbf64 push    eax

f63fbf65 push    edi

f63fbf66 push    esi

f63fbf67 mov     dword ptr [ebp-44h],ecx

f63fbf6a mov     dword ptr [ebp-3Ch],ecx

f63fbf6d mov     dword ptr [ebp-34h],ecx

f63fbf70 mov     dword ptr [ebp-2Ch],ecx

f63fbf73 call    NetworkAdapterA!PacketRetrieveNicActions (f63facd2)
1: kd> ub f63fbbbf

NetworkAdapterA!SendPackets+0x190:

f63fbb9c cmp     dword ptr [esi+0Ch],2

f63fbba0 jl      NetworkAdapterA!SendPackets+0x19e (f63fbbaa)

f63fbba2 mov     dword ptr [ecx+3818h],eax

f63fbba8 jmp     NetworkAdapterA!SendPackets+0x1a4 (f63fbbb0)

f63fbbaa mov     dword ptr [ecx+438h],eax

f63fbbb0 mov     dl,byte ptr [esi+2BCh]

f63fbbb6 mov     ecx,dword ptr [ebp+8]

f63fbbb9 call    dword ptr [NetworkAdapterA!_imp_KfReleaseSpinLock (f640ca18)]
1: kd> ub 80a60147

hal!HalBuildScatterGatherList+0x1b0:

80a60130 je      hal!HalBuildScatterGatherList+0x1b9 (80a60139)

80a60132 mov     dword ptr [eax+4],1

80a60139 push    dword ptr [ebp+20h]

80a6013c push    eax

80a6013d mov     eax,dword ptr [ebp+0Ch]

80a60140 push    dword ptr [eax+14h]

80a60143 push    eax

80a60144 call    dword ptr [ebp+1Ch]
- Dmitry Vostokov @ DumpAnalysis.org + TraceAnalysis.org -
This is a variation of Hooked Functions pattern for kernel space. In addition to trampoline patching we also see a modified service table:
0: kd> !chkimg -lo 50 -d !nt -v

Searching for module with expression: !nt

Will apply relocation fixups to file used for comparison

Will ignore NOP/LOCK errors

Will ignore patched instructions

Image specific ignores will be applied

Comparison image path: c:\mss\ntkrnlmp.exe\4B7A8E62280000\ntkrnlmp.exe

No range specified
Scanning section:    .text

Size: 625257

Range to scan: 80801000-80899a69

    808373e3-808373e9  7 bytes - nt!KeAcquireQueuedSpinLockAtDpcLevel+1b

 [ f7 41 04 01 00 00 00:e9 00 0d b2 76 cc cc ]

    8083e6c8-8083e6cb  4 bytes - nt!KiServiceTable+440 (+0×72e5)

 [ 98 4e 98 80:d0 66 e9 f4 ]

    80840605-8084060a  6 bytes - nt!KxFlushEntireTb+9 (+0×1f3d)

 [ ff 15 1c 10 80 80:e9 a5 7a b1 76 cc ]

Total bytes compared: 625257(100%)

Number of errors: 17
Scanning section: MISYSPTE

Size: 1906

Range to scan: 8089a000-8089a772

Total bytes compared: 1906(100%)

Number of errors: 0
Scanning section:   POOLMI

Size: 7868

Range to scan: 8089b000-8089cebc

Total bytes compared: 7868(100%)

Number of errors: 0
Scanning section: POOLCODE

Size: 7754

Range to scan: 8089d000-8089ee4a

Total bytes compared: 7754(100%)

Number of errors: 0
Scanning section:     PAGE

Size: 1097281

Range to scan: 808bc000-809c7e41

Total bytes compared: 1097281(100%)

Number of errors: 0
Scanning section:   PAGELK

Size: 63633

Range to scan: 809c8000-809d7891

Total bytes compared: 63633(100%)

Number of errors: 0
Scanning section:  PAGEWMI

Size: 7095

Range to scan: 809ef000-809f0bb7

Total bytes compared: 7095(100%)

Number of errors: 0
Scanning section:   PAGEKD

Size: 16760

Range to scan: 809f1000-809f5178

Total bytes compared: 16760(100%)

Number of errors: 0
Scanning section: PAGEHDLS

Size: 7508

Range to scan: 809f7000-809f8d54

Total bytes compared: 7508(100%)

Number of errors: 0

17 errors : !nt (808373e3-8084060a)
0: kd> dds 8083e6c8

8083e6c8  f4e966d0 DriverA+0×20d8

8083e6cc  80983436 nt!NtUnloadKey2

8083e6d0  809837b5 nt!NtUnloadKeyEx

8083e6d4  8091cec8 nt!NtUnlockFile

8083e6d8  80805d80 nt!NtUnlockVirtualMemory

8083e6dc  80937630 nt!NtUnmapViewOfSection

8083e6e0  808e7154 nt!NtVdmControl

8083e6e4  809c6ba3 nt!NtWaitForDebugEvent

8083e6e8  8092dc24 nt!NtWaitForMultipleObjects

8083e6ec  8092ccf4 nt!NtWaitForSingleObject

8083e6f0  809c132f nt!NtWaitHighEventPair

8083e6f4  809c12c3 nt!NtWaitLowEventPair

8083e6f8  80925c8d nt!NtWriteFile

8083e6fc  80901790 nt!NtWriteFileGather

8083e700  8091214c nt!NtWriteRequestData

8083e704  8093e63b nt!NtWriteVirtualMemory

8083e708  80822751 nt!NtYieldExecution

8083e70c  808c7c46 nt!NtCreateKeyedEvent

8083e710  8093eee3 nt!NtOpenKeyedEvent

8083e714  809c1ee8 nt!NtReleaseKeyedEvent

8083e718  809c2183 nt!NtWaitForKeyedEvent

8083e71c  809a610b nt!NtQueryPortInformationProcess

8083e720  809a6123 nt!NtGetCurrentProcessorNumber

8083e724  809a1849 nt!NtWaitForMultipleObjects32

8083e728  90909090

8083e72c  1c0d3b90

8083e730  0f8089f1

8083e734  037aaa85

8083e738  00c1f700

8083e73c  0fffff00

8083e740  037a9e85

8083e744  9090c300
0: kd> u 808373e3

nt!KeAcquireQueuedSpinLockAtDpcLevel+0×1b:

808373e3 jmp     DriverB+0×10e8 (f73580e8)

808373e8 int     3

808373e9 int     3

808373ea je      nt!KeAcquireQueuedSpinLockAtDpcLevel+0×12 (808373da)

808373ec pause

808373ee jmp     nt!KeAcquireQueuedSpinLockAtDpcLevel+0×1b (808373e3)

nt!KeReleaseInStackQueuedSpinLockFromDpcLevel:

808373f0 lea     ecx,[ecx]

nt!KeReleaseQueuedSpinLockFromDpcLevel:

808373f2 mov     eax,ecx
0: kd> u 80840605

nt!KxFlushEntireTb+0×9:

80840605 jmp     DriverB+0×10af (f73580af)

8084060a int     3

8084060b mov     byte ptr [ebp-1],al

8084060e mov     ebx,offset nt!KiTbFlushTimeStamp (808a7100)

80840613 mov     ecx,dword ptr [nt!KiTbFlushTimeStamp (808a7100)]

80840619 test    cl,1

8084061c jne     nt!KxFlushEntireTb+0×19 (8082cd8d)

80840622 mov     eax,ecx
- Dmitry Vostokov @ DumpAnalysis.org + TraceAnalysis.org -
Today we introduce an icon for Truncated Dump pattern:
B/W
![]()
Color
![]()
- Dmitry Vostokov @ DumpAnalysis.org + TraceAnalysis.org -
Some recent news about StressPrinters tool designed according to Tool Façade DebugWare pattern:
“HP tests its print drivers with the StressPrinters tool provided by Citrix to simulate a user logon where multiple printers are autocreated concurrently.”
- Dmitry Vostokov @ DumpAnalysis.org + TraceAnalysis.org -
Today we introduce an icon for Managed Code Exception pattern:
B/W
![]()
Color
![]()
- Dmitry Vostokov @ DumpAnalysis.org + TraceAnalysis.org -
Befind every trace and its messages is source code:
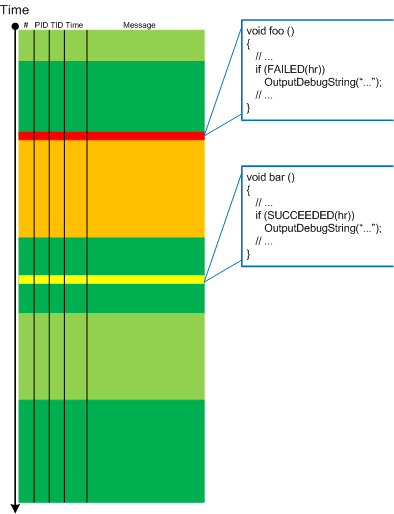
Borrowing the acronym PLOT (Program Lines of Trace) we now try to discern basic source code patterns that give rise to simple message patterns in software traces. There are only a few distinct PLOTs and the ability to mentally map trace statements to source code is crucial to software trace reading and comprehension. More about that in subsequent parts. More complex message patterns (for example, specific message blocks or correlated messages) arise from supportable and maintainable realizations of architectural, design and implementation patterns and will be covered in another post series.
I was thinking about acronym SLOT (Source Lines of Trace) but decided to use PLOT because it metaphorically bijects into literary theory and narrative plots.
Forthcoming CDF and ETW Software Trace Analysis: Practical Foundations
- Dmitry Vostokov @ DumpAnalysis.org + TraceAnalysis.org