Archive for the ‘Crash Dumps for Dummies’ Category

WinDbg book to be published after MDAA V1

Thursday, March 20th, 2008

This is a forthcoming reference book for technical support and escalation engineers troubleshooting and debugging complex software issues. The book is also invaluable for software maintenance and development engineers debugging unmanaged, managed and native code.

  • Title: Windows® Debugging Notebook: Essential Concepts, WinDbg Commands and Tools
  • Author: Dmitry Vostokov
  • Hardcover: 256 pages
  • ISBN-13: 978-0-9558328-5-7
  • Publisher: Opentask (1 September 2008)
  • Language: English
  • Product Dimensions: 22.86 x 15.24

- Dmitry Vostokov @ DumpAnalysis.org -

Memory Dump Analysis Anthology, Volume 1

Thursday, February 7th, 2008

It is very easy to become a publisher nowadays. Much easier than I thought. I registered myself as a publisher under the name of OpenTask which is my registered business name in Ireland. I also got the list of ISBN numbers and therefore can announce product details for the first volume of Memory Dump Analysis Anthology series:

Memory Dump Analysis Anthology, Volume 1

  • Paperback: 720 pages (*)
  • ISBN-13: 978-0-9558328-0-2
  • Hardcover: 720 pages (*)
  • ISBN-13: 978-0-9558328-1-9
  • Author: Dmitry Vostokov
  • Publisher: Opentask (15 Apr 2008)
  • Language: English
  • Product Dimensions: 22.86 x 15.24

(*) subject to change 

PDF file will be available for download too.

- Dmitry Vostokov @ DumpAnalysis.org -

Memoretics

Monday, February 4th, 2008

I’ve been trying to put memory dump analysis on relevant scientific grounds for some time and now this branch of science needs its own name. After considering different alternative names I finally chose the word Memoretics. Here is the brief definition:

Computer Memoretics studies computer memory snapshots and their evolution in time.

Obviously this domain of research has many links with application and system debugging. However its scope is wider than debugging because it doesn’t necessarily study memory snapshots from systems and applications experiencing faulty behaviour.

Initially I was thinking about Memogenics word but its suffix is heavily associated with genes metaphor which I’m currently trying to avoid although I personally re-discovered software genes approach to software disorders when thinking about Memoretics vs. Memogenics. Later I found some research efforts going on but seems they are based on constructing software genes artificially. On the contrary I would try to discover genes in computer memories first.

genic

Also Memoretics has longer prefix almost resembling Memory word. This had the final influence on my decision.

PS. I was also thinking about Memorology word but it has negative connotations with Astrology or Numerology and was coined already by someone like Memology and Memorics

- Dmitry Vostokov @ DumpAnalysis.org -

Crash Dump Analysis Patterns (Part 46)

Thursday, January 31st, 2008

Similar to No Process Dumps pattern there is corresponding No System Dumps pattern where the system bluescreens either on demand or because of a bug check condition but no kernel or complete dumps are saved. In such cases I would advise to check free space on a drive where memory dumps are supposed to be saved. This is because crash dumps are saved to a page file first and then copied to a separate file during boot time, by default to memory.dmp file. Please see related Microsoft links in my old post. In case you have enough free space but not enough page file space you might get an instance of Truncated Dump or Corrupt Dump pattern.   

Yesterday I experienced No System Dump pattern on Windows Server 2003 SP2 running on VMWare workstation when I was trying to get a complete memory dump using SystemDump. I set up page file correctly as sizeof(PhysicalMemory) + 100Mb but I didn’t check free space on drive C: and no dump was saved, not even kernel minidump. System event log entry was blank too. 

- Dmitry Vostokov @ DumpAnalysis.org -

Crash Dump Analysis Patterns (Part 45)

Wednesday, January 30th, 2008

The absence of crash dumps when we expect them can be considered as a pattern on its own and I call it No Process Dumps. This can happen due to variety of reasons and troubleshooting should be based on the distinction between crashes and hangs. We have 3 combinations here:

  1. A process is visible in Task Manager and is functioning normally

  2. A process is visible in Task Manager and has stopped functioning normally

  3. A process is not visible in Task Manager

If a process is visible in task list and is functioning normally then the following reasons should be considered:

  • - Exceptions haven’t happened yet due to different code execution paths or the time has not come yet and we need to wait more

  • - Exceptions haven’t happened yet due to a different memory layout. This can be the instance of Changed Environment pattern.

If a process is visible in Task Manager and has stopped functioning normally then it might be hanging and waiting for some input. In such cases it is better to get  process dumps proactively

If a process is not visible in Task Manager then the following reasons should be considered:

  • - Debugger value for AeDebug key is invalid, missing or points to a wrong path or a command line has wrong arguments. For examples see Custom Postmortem Debuggers on Vista or NTSD on x64 Windows 2003.

  • - Something is wrong with exception handling mechanism or WER settings. Use Process Monitor to see what processes are launched and modules are loaded when an exception happens. Check WER settings in Control panel.

  • - Try LocalDumps registry key for Vista SP1 and Windows Server 2008 (this one I haven’t tried yet)

  • - Use live debugging techniques like attaching to a process or running a process under a debugger to monitor exceptions and saving first chance exception crash dumps.

This is very important pattern for technical support environments that rely on post-mortem analysis and I’m going to revisit it later to add more information and recommendations if necessary. 

- Dmitry Vostokov @ DumpAnalysis.org -

Complexity and Memory Dumps (Part 1)

Wednesday, December 5th, 2007

Asking right questions at the appropriate hierarchical organization level is a known solution to complexity. In case of memory dumps it is sometimes useful to forget about bits, bytes, words, dwords and qwords, memory addresses, pointers, runtime structures, API and ask educated questions at component level, the simplest of it is the question about component timestamp, in WinDbg parlance, using variants of lm command, for example:

0:008> lmt m ModuleA
start    end        module name
76290000 762ad000   ModuleA  Sat Feb 17 13:59:59 2007 (45D70A5F)

0:008> lmt m ModuleB
start    end        module name
66c50000 66c65000   ModuleB  Fri Feb 02 22:30:03 2007 (45C3BB6B)

The next step is obvious: test with the newer version. Another good question is about consistency to exclude cases caused by α-particle hits. This latter possibility was mentioned in Andreas Zeller’s book I read some time ago and can be considered as the efficient cause of some crash dumps according to Aristotelian causation categories.   

- Dmitry Vostokov @ DumpAnalysis.org -

Five golden rules of troubleshooting

Monday, November 26th, 2007

It is difficult to analyze a problem when you have crash dumps and/or traces from various tracing tools and supporting information you have is incomplete or missing. After doing crash dump and trace analysis including ETW-based traces for more than 4 years I came up with this easy to remember 4WS questions to ask when you send or request traces and memory dumps:

What - What had happened or had been observed? Crash or hang, for example?

When - When did the problem happen if traces were recorded for hours?

Where - What server or workstation had been used for tracing or where memory dumps came from? For example, one trace is from a primary server and two others are from backup servers or one trace is from a client workstation and the other is from a server. 

Why - Why did a customer or a support engineer request a dump or a trace? This could shed the light on various assumptions including presuppositions hidden in problem description.  

Supporting information - needed to find a needle in a hay: process id, thread id, etc. Also, the answer to the following question is important: how dumps and traces were created?

Every trace or memory dump shall be accompanied by 4WS answers.  

4WS rule can be applied to any troubleshooting because even the problem description itself is some kind of a trace.

- Dmitry Vostokov @ DumpAnalysis.org -

Four causes of crash dumps

Friday, November 23rd, 2007

Obviously the appearance of crash dumps on your computer was caused by something. A bug, fault, defect or something else?

Aristotle suggested 4 types of causation 2 millennia ago and they are:

Material cause - presence of some substance, usually material one (hardware) but can be machine code (software). The distinction between hardware and software is often blurred today because of virtualization.

Formal cause - some form or arrangement (an algorithm)

Efficient cause - an agent (data flow or event caused an algorithm to be executed)

Final cause - the desire of someone (or something, operating system, for example).

We skip material causes because hardware and software are always involved. Obviously final causality should be among of crash dump causes because they were either anticipated or made deliberately. Let’s look at 3 examples with possible causes:

Buffer Overflow

  • Formal cause - a defect in code which might have arisen from incomplete or wrong model

  • Efficient cause - data is too big to fit in a buffer

  • Final cause - operating system and runtime library support decided to save a crash dump

Bugcheck (NMI)

  • Formal cause - NMI handler

  • Efficient cause - a button on a hardware panel or KeBugCheckEx

  • Final cause - “I need a memory dump” desire. Also crash dump saving functions were written before by kernel developers in anticipation of future crash dumps.

Bugcheck (A)

  • Formal cause - a defect in code again or particular disposition of threads

  • Efficient cause - Driver Verifier triggered paging out data

  • Final cause - deliberate OS bugcheck (here we can also say that it was anticipated by OS designers)

Concrete causes depend on the organizational level you use: software/hardware systems/components, modeling act by humans, etc.

- Dmitry Vostokov @ DumpAnalysis.org -

Memorillion and Quadrimemorillion

Thursday, November 15th, 2007

What are these? These are names of the number of possible unique complete memory dumps when address space is 32 bit and 64-bit correspondingly:

256232 and 256264

The first of them can be approximated by 101010

This idea came to me after I learnt about the so called “immense number” proposed by Walter Elsasser. This number is so big that its digits cannot be listed because there is not enough particles in observable Universe to write them.

Certainly one memorillion is more than one googol 10100 but it requires only approx. 1010 particles in ideal case to list its digits and therefore not an immense number. It is however far less than one googolplex 1010100.

Consider a complete memory dump with bytes written in hexadecimal notation:

0x50414745554d500f000000ce0e00000090...

This number has more than 8 billion digits… And it is one possible number out of memorillion of them. So one memorillion in hexadecimal notation is just

0xFFFFFFFFFFFFFFFFFFFFF... + 1

where we have 2*232 ‘F’ symbols written sequentially. One quadrimemorillion has 2*264 ‘F’ symbols.

Also the question about the number of possible crash dumps can be considered as Microsoft interview style question when you have possible candidates and you want to assess their ability to think out of the box and handle large numbers. 

- Dmitry Vostokov @ DumpAnalysis.org -

Crash Dumps for Dummies (Part 7)

Thursday, November 8th, 2007

In the previous part I introduced clear separation between crashes and hangs and outlined memory dump capturing methods for each category. However, looking from user point of view we need to tell them what is the best way to capture a dump based on observations they have and their failure level, system or component. The latter failure type usually happens with user applications and services.

For user applications the best way is to get a memory dump proactively or put in another words, manually, and do not rely on a postmortem debugger that may not be set up correctly on a problem server in 100 server farm. If any error message box appears with a message that an application stopped working or that it has encountered an application error then you can use process dumpers like userdump.exe.

Suppose we have the following error message when TestDefaultDebugger application crashes on Vista x64 (the same technique is applicable to earlier OS too):

Then we can dump the process while it displays the problem if we know its process ID:

In Vista this can be done even more easily by dumping the process from Task Manager directly:

Choose Create Dump File:

and the process dump is saved in a user location for temporary files:

Although the application above is the native Windows application the same method applies for .NET applications. For example, the forthcoming TestDefaultDebugger.NET application

shows the following dialog:

and we can dump the process manually while it displays the message.

Although both applications will disappear from Task Manager if we choose Close or Quit on their error message boxes and therefore will be considered as crashes under my terminology, at the time when they show their stop messages they are considered as application hangs and this is why we use manual process dumpers.

Other scenarios including system failures will be considered in the next part. 

- Dmitry Vostokov @ DumpAnalysis.org -

Crash Dumps for Dummies (Part 6)

Tuesday, October 16th, 2007

Bugtation No. 73:
Crash “must be distinguished from” hang “with which it is often confounded.”
Sydney Smith

In part 4 I highlighted the difference between crashes and hangs. In this part I will elaborate on this terminology a bit further. First of all, we have to unify them as manifestations of a functional failure. Considering computer as a system of components having certain functions we shall subdivide failures into system and component failures. Of course, systems may be components in some larger hierarchy, like in the case of virtualization. Application and service process failures fall under component failures category. Blue screen and server freezes fall under system failures category. Now it is obvious why most computer users confuse crashes and hangs. They are just failures and often the distinction between them is blurred from user perspective.

Software developers tend to make sharp distinction between crash and hang terms because they consider a situation when a computer accesses wrong memory or gets and executes an invalid instruction as a crash. However, after such situation a computer system may or may not terminate that application or service. 

Therefore, I propose to consider crashes as situations when a system or a component is not observed anymore. For example, a running application or service disappears from Task Manager, computer system shows blue screen or reboots. In hang situations we can observe that existence of a failed component in Task Manager or a computer system doesn’t reboot automatically and shows some screen image different from BSOD or panic message. The so called sluggish behavior or long response time can also be considered as hang situations.

Here is a simple rough diagram I devised to illuminate the proposed terminological difference:

Based on the clarification above the task of collecting memory or crash dumps is much simpler and clearer.

In the case of a system crash or hang we need to setup correct crash dump options in Advanced System Settings in Control Panel and check page file size in case of the complete memory dump option. A system crash will save the dump automatically. For system hangs we need to actively trigger crash dump saving procedure using either standard keyboard method, SystemDump tool or live system debugging.   

In the case of an application crash we need to set up a postmortem debugger, get WER report or attach a debugger to a component and wait for a failure to happen. In the case of a hang we save a memory dump manually either by using process dumpers like userdump.exe or attaching a debugger.

Links to some dump collection techniques can be found in the previously published part 3 (crashes explained) and part 4 (hangs explained). Forthcoming Windows® Crash Dump Analysis book will discuss all memory dump collection methods thoroughly and in detail.

- Dmitry Vostokov @ DumpAnalysis.org -

Crash Dump Analysis Patterns (Part 25)

Monday, September 10th, 2007

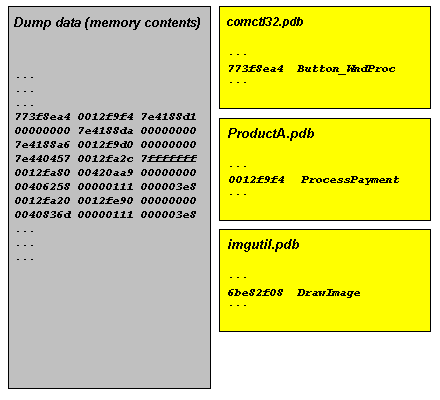
The most important pattern that is used for problem identification and resolution is Stack Trace. Consider the following fragment of !analyze -v output from w3wp.exe crash dump:

STACK_TEXT:
WARNING: Frame IP not in any known module. Following frames may be wrong.
1824f90c 5a39f97e 01057b48 01057bd0 5a3215b4 0x0
1824fa50 5a32cf7c 01057b48 00000000 79e651c0 w3core!ISAPI_REQUEST::SendResponseHeaders+0x5d
1824fa78 5a3218ad 01057bd0 79e651c0 79e64d9c w3isapi!SSFSendResponseHeader+0xe0
1824fae8 79e76127 01057bd0 00000003 79e651c0 w3isapi!ServerSupportFunction+0x351
1824fb0c 79e763a3 80000411 00000000 00000000 aspnet_isapi!HttpCompletion::ReportHttpError+0x3a
1824fd50 79e761c3 34df6cf8 79e8e42f 79e8e442 aspnet_isapi!HttpCompletion::ProcessRequestInManagedCode+0x1d1
1824fd5c 79e8e442 34df6cf8 00000000 00000000 aspnet_isapi!HttpCompletion::ProcessCompletion+0x24
1824fd70 791d6211 34df6cf8 18e60110 793ee0d8 aspnet_isapi!CorThreadPoolWorkitemCallback+0x13
1824fd84 791d616a 18e60110 00000000 791d60fa mscorsvr!ThreadpoolMgr::ExecuteWorkRequest+0x19
1824fda4 791fe95c 00000000 8083d5c7 00000000 mscorsvr!ThreadpoolMgr::WorkerThreadStart+0x129
1824ffb8 77e64829 17bb9c18 00000000 00000000 mscorsvr!ThreadpoolMgr::intermediateThreadProc+0x44
1824ffec 00000000 791fe91b 17bb9c18 00000000 kernel32!BaseThreadStart+0x34

Ignoring the first 5 numeric columns gives us the following trace:

0x0
w3core!ISAPI_REQUEST::SendResponseHeaders+0x5d
w3isapi!SSFSendResponseHeader+0xe0
w3isapi!ServerSupportFunction+0x351
aspnet_isapi!HttpCompletion::ReportHttpError+0x3a
aspnet_isapi!HttpCompletion::ProcessRequestInManagedCode+0x1d1
aspnet_isapi!HttpCompletion::ProcessCompletion+0x24
aspnet_isapi!CorThreadPoolWorkitemCallback+0x13
mscorsvr!ThreadpoolMgr::ExecuteWorkRequest+0x19
mscorsvr!ThreadpoolMgr::WorkerThreadStart+0x129
mscorsvr!ThreadpoolMgr::intermediateThreadProc+0x44
kernel32!BaseThreadStart+0x34

or in general we have something like this:

moduleA!functionX+offsetN
moduleB!functionY+offsetM
...
...
...

Sometimes function names are not available or offsets are very big like 0×2380. If this is the case then we probably don’t have symbol files for moduleA and moduleB:

moduleA+offsetN
moduleB+offsetM
...
...
...

Usually there is some kind of a database of previous issues we can use to match moduleA!functionX+offsetN against. If there is no such match we can try functionX+offsetN, moduleA!functionX or just functionX. If there is no such match again we can try the next signature, moduleB!functionY+offsetM, and moduleB!functionY, etc. Usually, the further down the trace the less useful the signature is for problem resolution. For example, mscorsvr!ThreadpoolMgr::WorkerThreadStart+0x129 will probably match many issues because this signature is common for many ASP.NET applications.

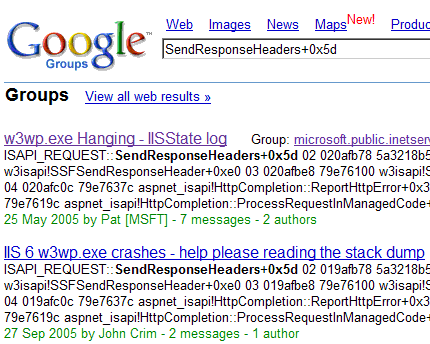
If there is no match in internal databases we can try Google. For our example, Google search for SendResponseHeaders+0x5d gives the following search results:

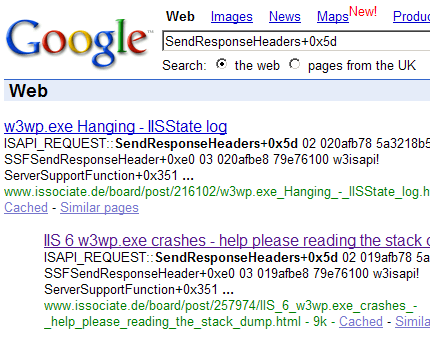
Browsing search results reveals the following discussion:

http://groups.google.com/group/microsoft.public.inetserver.iis/ browse_frm/thread/34bc2be635b26531?tvc=1 

which can be found directly by searching Google groups:


Another example from BSOD complete memory dump. Analysis command has the following output (stripped for clarity):

MODE_EXCEPTION_NOT_HANDLED (1e)
This is a very common bugcheck. Usually the exception address pinpoints the driver/function that caused the problem. Always note this address as well as the link date of the driver/image that contains this address.
Arguments:
Arg1: c0000005, The exception code that was not handled
Arg2: bff90ca3, The address that the exception occurred at
Arg3: 00000000, Parameter 0 of the exception
Arg4: 00000000, Parameter 1 of the exception

TRAP_FRAME: bdf80834 -- (.trap ffffffffbdf80834)
ErrCode = 00000000
eax=00000000 ebx=bdf80c34 ecx=89031870 edx=88096928 esi=88096928 edi=8905e7f0
eip=bff90ca3 esp=bdf808a8 ebp=bdf80a44 iopl=0 nv up ei ng nz na po nc
cs=0008 ss=0010 ds=0023 es=0023 fs=0030 gs=0000 efl=00010282
tsmlvsa+0xfca3:
bff90ca3 8b08 mov ecx,dword ptr [eax] ds:0023:00000000=????????
Resetting default scope

STACK_TEXT:
bdf807c4 80467a15 bdf807e0 00000000 bdf80834 nt!KiDispatchException+0x30e
bdf8082c 804679c6 00000000 bdf80860 804d9f69 nt!CommonDispatchException+0x4d
bdf80838 804d9f69 00000000 00000005 e56c6946 nt!KiUnexpectedInterruptTail+0x207
00000000 00000000 00000000 00000000 00000000 nt!ObpAllocateObject+0xe1

Because the crash point tsmlvsa+0xfca3 is not on the stack trace we use .trap command:

1: kd> .trap ffffffffbdf80834
ErrCode = 00000000
eax=00000000 ebx=bdf80c34 ecx=89031870 edx=88096928 esi=88096928 edi=8905e7f0
eip=bff90ca3 esp=bdf808a8 ebp=bdf80a44 iopl=0 nv up ei ng nz na po nc
cs=0008 ss=0010 ds=0023 es=0023 fs=0030 gs=0000 efl=00010282
tsmlvsa+0xfca3:
bff90ca3 8b08 mov ecx,dword ptr [eax] ds:0023:00000000=????????

1: kd> k
*** Stack trace for last set context - .thread/.cxr resets it
ChildEBP RetAddr
WARNING: Stack unwind information not available. Following frames may be wrong.
00000000 bdf80afc tsmlvsa+0xfca3
89080c00 00000040 nt!ObpLookupObjectName+0x504
00000000 00000001 nt!ObOpenObjectByName+0xc5
c0100080 0012b8d8 nt!IopCreateFile+0x407
c0100080 0012b8d8 nt!IoCreateFile+0x36
c0100080 0012b8d8 nt!NtCreateFile+0x2e
c0100080 0012b8d8 nt!KiSystemService+0xc9
c0100080 0012b8d8 ntdll!NtCreateFile+0xb
c0000000 00000000 KERNEL32!CreateFileW+0x343

1: kd> lmv m tsmlvsa
bff81000 bff987c0 tsmlvsa (no symbols)
Loaded symbol image file: tsmlvsa.sys
Image path: tsmlvsa.sys
Image name: tsmlvsa.sys
Timestamp: Thu Mar 18 06:18:51 2004 (40593F4B)
CheckSum: 0002D102
ImageSize: 000177C0
Translations: 0000.04b0 0000.04e0 0409.04b0 0409.04e0

Google search for tsmlvsa+0xfca3 fails but if we search just for tsmlvsa we get the first link towards problem resolution:

http://www-1.ibm.com/support/docview.wss?uid=swg1IC40964

- Dmitry Vostokov @ DumpAnalysis.org -

Basic Windows Crash Dump Analysis (Part 1)

Tuesday, August 7th, 2007

I have published the HTML version (with minor updates) of the original training presentation created in 2005. 

The first part explains various concepts like process, thread, crash, hang, etc. and introduces memory dump classification from memory type and procedure perspectives. It also covers crash dump gathering and verification, explains symbols and lists common scenarios. Here is the link: 

Basic Windows Crash Dump Analysis (Part 1)

- Dmitry Vostokov @ DumpAnalysis.org -

Crash Dumps for Dummies (Part 5)

Saturday, May 5th, 2007

In this part, I try to explain symbol files. They are usually called PDB files because they have .PDB extension although the older ones can have .DBG extension. PDB files are needed to read dump files properly. Without PDB files the dump file data is just a collection of numbers, the contents of memory, without any meaning. PDB files help tools like WinDbg to interpret the data and present it in a human-readable format. Roughly speaking, PDB files contain associations between numbers and their meanings expressed in short text strings:

Because these associations are changed when you have a fix or a service pack on a computer and you have a dump from it you need newer PDB files that correspond to updated components such as DLLs or drivers. 

Long time ago you had to download symbol files manually from Microsoft or get them from CDs. Now Microsoft has its dedicated internet symbol server and WinDbg can download PDB files automatically. However you need to specify Microsoft symbol server location in File\Symbol File Path… dialog and check Reload. The location is usually:

SRV*c:\websymbols*http://msdl.microsoft.com/download/symbols

If you don’t remember the location when you run WinDbg for the first time or on a new computer you can enter .symfix command to set Microsoft symbol server path automatically and specify the location where to download symbol files. You can check your current symbol search path by using .sympath command and don’t forget to reload symbols by entering .reload command:

0:000> .symfix
No downstream store given, using C:\Program Files\Debugging Tools for Windows\sym
0:000> .sympath
Symbol search path is: SRV**http://msdl.microsoft.com/download/symbols
0:000> .symfix c:\websymbols
0:000> .sympath
Symbol search path is: SRV*c:\websymbols*http://msdl.microsoft.com/download/symbols
0:000> .reload

- Dmitry Vostokov @ DumpAnalysis.org -

Crash Dumps for Dummies (Part 4)

Sunday, November 19th, 2006

In the previous Dumps for Dummies (Part 3) I tried to explain the nature of crashes. Another category of problems happens very often and we also need a dump for analysis: hangs. There is some confusion exists in understanding the difference between these two categories: crash and hang. Although sometimes a hang is a direct consequence of a crash most of the time hangs happen independently. They also manifest themselves differently. Let’s look at application (process) crashes and hangs first. When a crash happens an application (process) often disappears. When hang happens an application (process) is still in memory: you can see it in Task Manager, for example, but it doesn’t respond to user commands or to any other requests like pinging a TCP/IP port. If we have a crash in OS then the most visible manifestation is blue screen and/or reboot. If we have a hang then everything freezes.

Application or system hang happens because from high level view of the interaction between application or OS components (modules) is done via messages. One component sends a message to another and waits for a response. Some components are critical, for example, registry. The following hand-made picture depicts very common system hang situations when the register component stops responding. Then every running application (process) stops responding if its execution path depends on registry access.

The very common reason for hang is so called deadlock when two running applications (their execution paths, threads) are waiting for each other. Here is the analogy with a blocked road:

In order to see what’s inside the process or OS which caused a hang we need a dump. Usually this dump is called a crash dump too because in order to get it the usual method is to make some sort of a trap which causes an application or OS to crash and to save the dump. I personally prefer to call these dumps just memory dumps to avoid confusion.  

How can you get a memory dump if your application or service hangs?

How can you get a memory dump if your system hangs?

For most system hangs choosing Kernel memory dump option in Control Panel\System\Advanced\Startup and Recovery applet is sufficient. Kernel memory dumps are smaller and less susceptible to corruption or truncation due to small page file size. If you discover that you need to peer inside running user applications then you can always ask for another Complete memory dump when the problem happens again.

- Dmitry Vostokov @ DumpAnalysis.org -

Crash Dumps for Dummies (Part 3)

Wednesday, October 25th, 2006

This part follows Dumps for Dummies (Part 2) and here I’ll try to explain crashes, dumps and postmortem debuggers. 

Sometimes a computer (CPU, Central Processing Unit) cannot perform its job because the instruction it gets to do some calculations, read or write data is wrong. Imagine a situation when you get an address to deliver a message to and you find that it doesn’t exist…  The following idealized picture shows this situation (if memory locations/addresses are indexed from 0 then -1 is obviously wrong address):

When referencing invalid address CPU executes special sequence of actions (called trap) that ultimately leads to saving memory so you could later examine its contents and find out which instruction was invalid. If crash happens inside Windows operating system then you see blue screen and then a kernel memory or full computer physical memory is saved in a file (called either kernel or complete memory dump respectively). If you have a crash in a running application or service then its memory contents are saved in a file (called user dump). The latter file is also called a postmortem dump and we call a program which saves it a postmortem debugger. There can be several such programs and the one which is specified in the registry to execute whenever a crash happens in a running application or service is called a default postmortem debugger. The following picture illustrates this (here spooler service, spoolsv.exe, crashed by faulty printer driver):

By default it is Dr. Watson (drwtsn32.exe) but sometimes it doesn’t work in terminal services environment and has limitations so we always recommend setting NTSD (ntsd.exe) as a default postmortem debugger:

How to Set NTSD as a Default Windows Postmortem Debugger

I prefer to call both user and kernel/complete memory dumps postmortem (not only user dumps) because they are saved after application, service or system is dead already (crash or fatal error already happened). This distinguishes them from live memory dumps saved manually whenever we want them. This brings us to dump classification that I show you in forthcoming parts. 

- Dmitry Vostokov @ DumpAnalysis.org -

Crash Dumps for Dummies (Part 2)

Saturday, October 14th, 2006

Part 2 follows the discussion of various dump types depicted here: Dumps for Dummies (Part 1) 

So the question arises: how to make sure the customer got the right dump? And if the dump type is not what you asked for provide a recommendation for further actions. Troubled with such questions during my first years in Citrix technical support I decided to develop a lightweight Explorer extension and a command line version of dump checking tool called Citrix DumpCheck:

Here it does basic checks for dump validity and shows the dump type: Complete memory dump

If it found small mini dump type (64Kb) the tool would have suggested to change settings in Control Panel.

The extension can be downloaded from Citrix support web site:

Citrix DumpCheck Explorer Extension version 1.4 

FAQ:

Q. Is it possible to show more information like process name in a user dump or whether full page heap was enabled?

A. Certainly it is possible to include. However it requires access to OS symbol files during runtime and most customers don’t have them installed or downloaded from MS symbol server. So the design decision was not to include these checks in version 1.x. I consider to include this in next versions 2.x.

Q. The customer doesn’t want to modify environment by installing extension. Is there any command line version of this tool?

A. Yes, there is. The following article contains a download link to a command line version of Citrix DumpCheck:

Citrix DumpCheck Utility (Command Line) version 1.4   

Q. Does this extension work in 64-bit Windows?

A. No, but you can use command line equivalent shown in the answer to the previous question. Also I’m planning to port this extension to 64-bit soon and will announce as soon as I release it.

- Dmitry Vostokov  @ DumpAnalysis.org -

Crash Dumps for Dummies (Part 1)

Monday, October 9th, 2006

There is much confusion among MS and therefore Citrix customers about different dump types - Windows has 3 major dump types (not including various mini-dumps): complete, kernel and user. Long time ago I created a hand-crafted picture showing how various parts of computer memory are saved in a dump and I want to share it with a wider part of Citrix community and perhaps with the rest of the world:

- Dmitry Vostokov  @ DumpAnalysis.org -