Archive for the ‘Crash Dumps for Dummies’ Category
Tuesday, November 25th, 2008
As one of the new initiatives for the Year of Debugging DumpAnalysis Portal will publish bimonthly full color 16 page publication called:
Debugged! MZ/PE: MagaZine for/from Practicing Engineers
The only serial publication dedicated entirely to Windows® debugging
The first issue is planned for March, 2009 and will have ISBN-13: 978-1-906717-38-4. If it goes well I’m planning to have ISSN number assigned to it too. More details will be announced soon.
- Dmitry Vostokov @ DumpAnalysis.org -
Posted in Announcements, Assembly Language, Books, Bugchecks Depicted, CDA Pattern Classification, Citrix, Common Mistakes, Crash Dump Analysis, Crash Dump Patterns, Crash Dumps for Dummies, Data Recovery, Debugged! MZ/PE, Debugging, IDA for WinDbg Users, Kernel Development, Memory Analysis Forensics and Intelligence, Memory Visualization, Minidump Analysis, Philosophy, Publishing, Security, Software Technical Support, Testing, Tools, Training and Seminars, Troubleshooting Methodology, Vista, WinDbg Scripts, WinDbg Tips and Tricks, WinDbg for GDB Users, Windows Server 2008 | 4 Comments »
Tuesday, November 25th, 2008
I’m pleased to announce that OpenTask has submitted the book Dumps, Bugs and Debugging Forensics: The Adventures of Dr. Debugalov for printing and here is the link to TOC:
Table of Contents
- Dmitry Vostokov @ DumpAnalysis.org -
Posted in Announcements, Books, Bugtations, Cartoons, Certification, Code Reading, Crash Dump Analysis, Crash Dumps for Dummies, Debugging, Fun with Crash Dumps, Memory Analysis Forensics and Intelligence, New Words, Philosophy, Publishing, Science of Memory Dump Analysis, Software Technical Support, Testing, WinDbg Tips and Tricks | No Comments »
Sunday, November 23rd, 2008
DLL is also a recursive acronym for DLL List Landscape. OpenTask is going to publish soon the new full color book:
Title: DLL List Landscape: The Art from Computer Memory Space
ISBN-13: 978-1-906717-36-0
More details will be announced tomorrow.
- Dmitry Vostokov @ DumpAnalysis.org -
Posted in Announcements, Books, Crash Dump Analysis, Crash Dump Patterns, Crash Dumps for Dummies, Fun with Crash Dumps, Memory Visualization, New Words, Publishing, Science of Memory Dump Analysis | 1 Comment »
Thursday, November 6th, 2008
This “Hamlet’s Question” of software technical support is often asked and unfortunately sometimes not even asked at all when troubleshooting and debugging complex enterprise environments. For applications the question of saving crash dumps is trivial. If a process is not in memory and not visible in Task Manager we won’t be able to dump it manually. With OS always running even when hanging the question often degenerates to “Let’s bugcheck and send the crash dump to dump file divers”. After that decision huge amounts of energy are spent in collecting, sending and storing gigabytes of data with always very little or no return. Therefore here is the preliminary list of symptoms where manual system dumps are appropriate and when they are not:
When a manual system dump is appropriate
-
- The system hangs visually (no GUI activity possible)
-
- No connections or logins are possible
-
- Abnormal system metrics (like pool, thread or process number growth)
-
- Insufficient system or session memory
When a manual process user dump is more appropriate than a complete memory dump
-
- Process hangs visually (other applications work as normal)
-
- Error message box appears
-
- Abnormal process metrics (like process memory growth or handle leaks)
When manual kernel and complete memory dumps are almost useless (I say almost because in rare circumstances they can aid in problem resolution so it is better not to collect them until explicitly asked from skilled memory dump file diver)
Note: 3rd-party kernel mode software developers should not face this question during the development of their drivers and delegate the responsibility for difficult bugcheck or panic decisions to an operating system. Surely Windows core developers face this question too.
Next we discuss another related question about choosing between kernel and complete memory dump options in Control Panel.
- Dmitry Vostokov @ DumpAnalysis.org -
Posted in Crash Dump Analysis, Crash Dumps for Dummies, Software Technical Support, Troubleshooting Methodology | No Comments »
Friday, October 31st, 2008
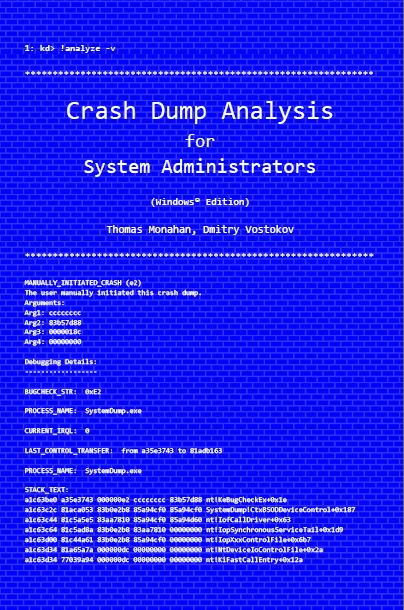
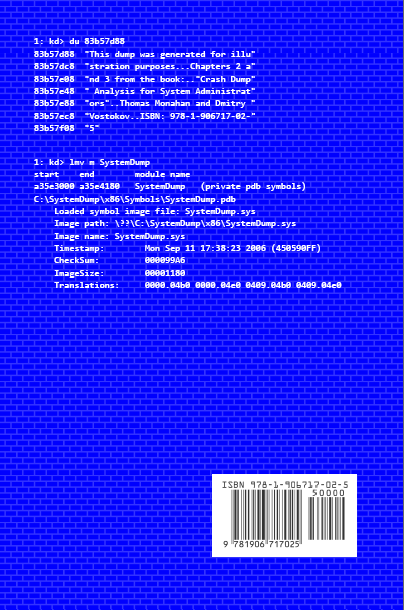
Previously announced book Crash Dump Analysis for System Administrators and Support Engineers (Windows Edition) has got its draft cover featuring WinDbg output from a kernel memory dump forced by Citrix SystemDump tool.
Front:
Back:
- Dmitry Vostokov @ DumpAnalysis.org -
Posted in Announcements, Books, Citrix, Crash Dump Analysis, Crash Dumps for Dummies, Minidump Analysis, Publishing, Security, Software Technical Support, Testing, Tools, Training and Seminars, Vista, WinDbg Tips and Tricks, Windows Server 2008 | No Comments »
Saturday, October 18th, 2008
Paperback edition of Memory Dump Analysis Anthology, Volume 2 is finally available on Amazon and Barnes & Noble. Search Inside is also available on Amazon. In addition, I updated the list of recommended books:
Listmania! Crash Dump Analysis and Debugging
Hardcover edition will be available on Amazon and B&N in 2-3 weeks.
- Dmitry Vostokov @ DumpAnalysis.org -
Posted in Announcements, Assembly Language, Books, Bugchecks Depicted, CDF Analysis Tips and Tricks, Certification, Citrix, Common Mistakes, Crash Dump Analysis, Crash Dump Patterns, Crash Dumps for Dummies, Data Recovery, DebugWare Patterns, Debugging, Fun with Crash Dumps, Hardware, Kernel Development, Memory Analysis Forensics and Intelligence, Memory Dump Analysis Jobs, Memory Visualization, Minidump Analysis, Music for Debugging, New Words, Philosophy, Publishing, Science of Memory Dump Analysis, Security, Software Architecture, Software Technical Support, Stack Trace Collection, Testing, Tools, Training and Seminars, Troubleshooting Methodology, Virtualization, Vista, WinDbg Scripts, WinDbg Tips and Tricks, WinDbg for GDB Users, Windows Server 2008 | No Comments »
Friday, October 3rd, 2008
“Everything is memory dump.”
I’m very excited to announce that Volume 2 is available in paperback, hardcover and digital editions:
Memory Dump Analysis Anthology, Volume 2
In one or two weeks paperback edition should also appear on Amazon and other bookstores. Amazon hardcover edition is planned to be available by the end of October.
I’m often asked when Volume 3 is available and I currently plan to release it in October - November, 2009. In the mean time I’m planning to concentrate on other publishing projects.
- Dmitry Vostokov @ DumpAnalysis.org -
Posted in Announcements, Assembly Language, Books, Bugchecks Depicted, CDF Analysis Tips and Tricks, Citrix, Common Mistakes, Crash Dump Analysis, Crash Dump Patterns, Crash Dumps for Dummies, Data Recovery, DebugWare Patterns, Debugging, Fun with Crash Dumps, Kernel Development, Memory Analysis Forensics and Intelligence, Memory Dump Analysis Jobs, Memory Visualization, Minidump Analysis, Music for Debugging, New Words, Philosophy, Publishing, Science of Memory Dump Analysis, Security, Software Architecture, Software Technical Support, Stack Trace Collection, Testing, Tools, Training and Seminars, Troubleshooting Methodology, Virtualization, Vista, WinDbg Scripts, WinDbg Tips and Tricks, WinDbg for GDB Users, Windows Server 2008 | No Comments »
Wednesday, October 1st, 2008
The book is nearly finished and here is the final TOC:
Memory Dump Analysis Anthology, Volume 2: Table of Contents
- Dmitry Vostokov @ DumpAnalysis.org -
Posted in Announcements, Assembly Language, Books, Bugchecks Depicted, CDF Analysis Tips and Tricks, Citrix, Common Mistakes, Crash Dump Analysis, Crash Dump Patterns, Crash Dumps for Dummies, Data Recovery, DebugWare Patterns, Debugging, Fun with Crash Dumps, Kernel Development, Memory Dump Analysis Jobs, Memory Visualization, Minidump Analysis, Music for Debugging, Publishing, Science of Memory Dump Analysis, Security, Software Technical Support, Stack Trace Collection, Tools, Troubleshooting Methodology, Virtualization, Vista, WinDbg Scripts, WinDbg Tips and Tricks, WinDbg for GDB Users, Windows Server 2008 | No Comments »
Tuesday, September 30th, 2008
Today Citrix officially joined the club of public symbol server companies! Please refer to the following article for details:
How to Use the Citrix Symbol Server to Obtain Debug Symbols
- Dmitry Vostokov @ DumpAnalysis.org -
Posted in Announcements, Citrix, Crash Dump Analysis, Crash Dumps for Dummies, Debugging, Minidump Analysis, Software Technical Support, Stack Trace Collection, Tools, Vista, WinDbg Tips and Tricks, Windows Server 2008 | 4 Comments »
Tuesday, September 16th, 2008
“Crash dumps are fossils”
Here is the draft TOC for the previously announced book Crash Dump Analysis for System Administrators and Support Engineers (Windows Edition) which I’m co-authoring with Thomas Monahan, a Lead Escalation Engineer at Citrix Systems:
Table of Contents
- Dmitry Vostokov @ DumpAnalysis.org -
Posted in Announcements, Books, Citrix, Crash Dump Analysis, Crash Dumps for Dummies, Memory Dump Analysis Jobs, Minidump Analysis, Publishing, Software Technical Support, Tools, Vista, Windows Server 2008 | No Comments »
Thursday, September 4th, 2008
Previously announced Windows Debugging: Practical Foundations book has got its front cover done in classic B/W style. A bit frightening, but shouldn’t stop if someone is determined to learn field debugging 
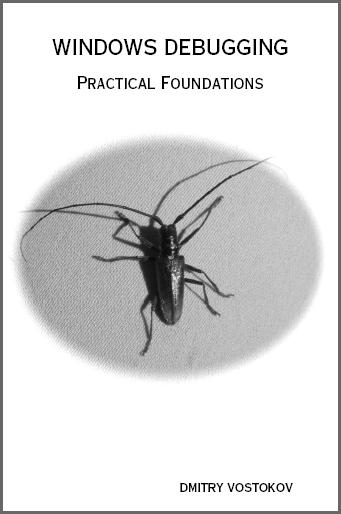
Please let me know what do you think. Table of contents to be published next week.
- Dmitry Vostokov @ DumpAnalysis.org -
Posted in Announcements, Books, Crash Dump Analysis, Crash Dumps for Dummies, Debugging, Publishing, Software Technical Support | No Comments »
Saturday, July 19th, 2008
It has been some time since I wrote the previous part of these series. Now I turn back to the theory again and uncover the mystery of the the following phrase used so often in analysis reports: “stack trace of the problem thread“. What is a thread actually? It is defined as a unit of execution or processing. Imagine an Internet browser running on your computer. It was launched by clicking on browser.exe file which we call an application executable file. When this file is loaded and running it occupies some memory regions and we call all these memory regions an Internet browser process. Let click on browser.exe again. A new instance is launched and again, a new running instance is also called a process, the second one. We see that one application file corresponds to several simultaneously running processes where each one has its own unique number, process id (PID). This is illustrated on the following picture for the case of notepad.exe:
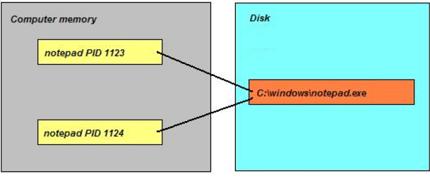
Some processes do several tasks in parallel. We call them threads of execution and each one is assigned a unique number, thread id (TID). Consider an Internet browser again. TID 112 is processing keyboard / mouse events (scrolls the page), TID 114 is downloading a graphics file and TID 212 is drawing an animated GIF picture. Every thread does its task in steps, splitting its steps into sub-tasks, dividing every sub-tasks into even smaller units and so on. For example downloading a graphics file can be split into locating a file name on an HTML page, establishing a TCP/IP connection, receiving data and then closing down that connection. Sub-task of locating a file name on an HTML page can be subdivided into finding an IMG tag, then finding its SRC attribute, then parsing a file name, an so on. Abstractly this can be depicted as the nested hierarchy of sequential actions (called functions):
Suppose during the step γ we have a problem. At that time a crash dump is saved. Then in the crash dump we would see the sequence B -> d -> γ. It is called a stack trace (or a backtrace) of the problem thread that was supposed to successfully finish the sequence A -> B -> C but was interrupted at the sub-sub-step γ. In the debugger this stack trace would have been shown as:
application!γ
application!d
application!B
The most recent action is on the top. Let’s go back to our Internet browser example and the thread locating a file name on an HTML page. Suppose the code for parsing file names contains a defect and Internet browser crashes. Then the crash dump would reveal the following stack trace:
browser!ParseFileName
browser!FindSRCAttrubute
browser!FindIMGTag
browser!LocateFileName
browser!DownloadFile
It is often possible to interpret stack traces and guess their meanings by reading the names of corresponding actions.
- Dmitry Vostokov @ DumpAnalysis.org -
Posted in Crash Dumps for Dummies | 1 Comment »
Friday, June 20th, 2008
Many people expressed interest in expanding Practical Foundations of Debugging (x64) and merging it with commented version of Practical Foundations of Debugging (x86) and Reading Windows-based Code. I therefore decided to dedicate some time during the next two months for this task and publish a book. Its main purpose is to help technical support and escalation engineers, testers and software developers without the knowledge of assembly language and C to master all necessary prerequisites to understand and start debugging and crash dump analysis on Windows platforms. It doesn’t require any specific knowledge, fills the gap and lowers the learning curve required for Advanced Windows Debugging and for my own books. It will also serve as a hardware complement to my seminars that I give from time to time. More details will be posted later but for now there are preliminary product details:
- Title: Windows Debugging: Practical Foundations
- Author: Dmitry Vostokov
- Publisher: Opentask (01 February 2009)
- Language: English
- Product Dimensions: 22.86 x 15.24
- ISBN-13: 978-1-906717-10-0
- Paperback: 200 pages
- Dmitry Vostokov @ DumpAnalysis.org -
Posted in Announcements, Assembly Language, Books, Crash Dump Analysis, Crash Dumps for Dummies, Debugging, Publishing, Software Technical Support, Training and Seminars, WinDbg for GDB Users | 3 Comments »
Thursday, June 19th, 2008
Not My Version is another basic pattern of DLL Hell variety. It is when we look at the component timestamps and paths and realize that that one of the modules from the production environment is older than we had during development and testing. The lmft WinDbg command will produce the necessary output. If there are many modules we might want to create a CAD graph (Component Age Diagram) to spot anomalies. Component version check is one of the basic troubleshooting and system administration activities that will be fully illustrated in the forthcoming book “Crash Dump Analysis for System Administrators and Support Engineers” (ISBN-13: 978-1-906717-02-5). Here is one example (module start and end load addresses are removed for visual clarity):
0:000> kL

Child-SP          RetAddr           Call Site

00000000`0012fed8 00000001`40001093 MyDLL!fnMyDLL

00000000`0012fee0 00000001`40001344 2DLLs+0×1093

00000000`0012ff10 00000000`773acdcd 2DLLs+0×1344

00000000`0012ff60 00000000`774fc6e1 kernel32!BaseThreadInitThunk+0xd

00000000`0012ff90 00000000`00000000 ntdll!RtlUserThreadStart+0×1d
0:000> lmft

module name

MyDLL    C:\OLD\MyDLL.dll Wed Jun 18 14:49:13 2004

user32   C:\Windows\System32\user32.dll Thu Feb 15 05:22:33 2007

kernel32 C:\Windows\System32\kernel32.dll Thu Nov 02 11:14:48 2006

ntdll    C:\Windows\System32\ntdll.dll Thu Nov 02 11:16:02 2006

2DLLs    C:\2DLLs\2DLLs.exe Thu Jun 19 10:46:44 2008 (485A2B04)

uxtheme  C:\Windows\System32\uxtheme.dll Thu Nov 02 11:15:07 2006

rpcrt4   C:\Windows\System32\rpcrt4.dll Tue Jul 17 05:21:15 2007

lpk      C:\Windows\System32\lpk.dll Thu Nov 02 11:12:33 2006

oleaut32 C:\Windows\System32\oleaut32.dll Thu Dec 06 05:09:35 2007

usp10    C:\Windows\System32\usp10.dll Thu Nov 02 11:15:03 2006

ole32    C:\Windows\System32\ole32.dll Thu Nov 02 11:14:31 2006

advapi32 C:\Windows\System32\advapi32.dll Thu Nov 02 11:11:35 2006

gdi32    C:\Windows\System32\gdi32.dll Thu Feb 21 04:40:51 2008

msvcrt   C:\Windows\System32\msvcrt.dll Thu Nov 02 11:13:37 2006

imm32    C:\Windows\System32\imm32.dll Thu Nov 02 11:13:15 2006

msctf    C:\Windows\System32\msctf.dll Thu Nov 02 11:13:42 2006
This pattern should be checked when we have instances of Module Variety and, especially, Duplicated Module. Note that this pattern can also easily become an anti-pattern when applied to an unknown component: Alien Component.
- Dmitry Vostokov @ DumpAnalysis.org -
Posted in Crash Dump Analysis, Crash Dump Patterns, Crash Dumps for Dummies, Debugging, Software Technical Support, Troubleshooting Methodology | 8 Comments »
Wednesday, June 18th, 2008
Analysis of computer memory snapshots (memory dumps) and their evolution is the domain of memoretics. Computer memory semiotics (memiotics or memosemiotics) is the branch of memoretics that studies the interpretation of computer memory, its meaning, signs and symbols.
- Dmitry Vostokov @ DumpAnalysis.org -
Posted in Announcements, Crash Dump Analysis, Crash Dump Patterns, Crash Dumps for Dummies, Debugging, Fun with Crash Dumps, Memiotics (Memory Semiotics), Memory Analysis Forensics and Intelligence, Memory Visualization, Philosophy, Science of Memory Dump Analysis | 1 Comment »
Tuesday, May 6th, 2008
This is a must have book for system administrators of complex Windows server platforms and client workstations to understand and choose the best course of action to address system and application crashes, hangs, CPU spikes and memory leaks. It is also invaluable to general Windows users and technical support engineers.
- Title: Crash Dump Analysis for System Administrators and Support Engineers
- Authors: Thomas Monahan, Dmitry Vostokov
- Publisher: Opentask (30 November 2009)
- Language: English
- Product Dimensions: 22.86 x 15.24
- ISBN-13: 978-1-906717-02-5
- Paperback: 180 pages
- Dmitry Vostokov @ DumpAnalysis.org -
Posted in Announcements, Books, Crash Dump Analysis, Crash Dumps for Dummies, Minidump Analysis, Publishing, Software Technical Support, Tools, Troubleshooting Methodology, Vista, Windows Server 2008 | 1 Comment »
Friday, April 25th, 2008
Due to demand from people that prefer ebooks I published Memory Dump Analysis Anthology, Volume 1 in a digital format that can be purchased in Crash Dump Analysis Store. This format has color pictures inside.
- Dmitry Vostokov @ DumpAnalysis.org -
Posted in Announcements, Assembly Language, Books, Bugchecks Depicted, Citrix, Crash Dump Analysis, Crash Dump Patterns, Crash Dumps for Dummies, Debugging, Fun with Crash Dumps, GDB for WinDbg Users, Hardware, Kernel Development, Memory Dump Analysis Jobs, Memory Visualization, Minidump Analysis, Publishing, Science of Memory Dump Analysis, Security, Software Architecture, Software Technical Support, Stack Trace Collection, Tools, Troubleshooting Methodology, Vista, WinDbg Scripts, WinDbg Tips and Tricks, WinDbg for GDB Users, Windows Server 2008 | No Comments »
Tuesday, April 15th, 2008
I’m very proud to announce that it is finally available in both paperback and hardback. Why have I made available both editions? Because I personally prefer hardcover books. You can order the book today and it will be printed in 3-5 days (paperback) or 5-10 days (hardcover) and sent to you:
Memory Dump Analysis Anthology, Volume 1
Note: although listed on Amazon and other online bookstores it is not immediately available at these stores at the moment due to the late submission. I apologize for this. However, I expect that in a few weeks pre-orders taken there will be eventually fulfilled. In the mean time, if you want the book now, you can use the link above.
- Dmitry Vostokov @ DumpAnalysis.org -
Posted in Announcements, Assembly Language, Books, Bugchecks Depicted, CDF Analysis Tips and Tricks, Citrix, Crash Dump Analysis, Crash Dump Patterns, Crash Dumps for Dummies, Debugging, Fun with Crash Dumps, GDB for WinDbg Users, Hardware, Kernel Development, Memory Dump Analysis Jobs, Memory Visualization, Minidump Analysis, Publishing, Science of Memory Dump Analysis, Security, Software Architecture, Software Technical Support, Stack Trace Collection, Tools, Troubleshooting Methodology, Vista, WinDbg Scripts, WinDbg Tips and Tricks, WinDbg for GDB Users, Windows Server 2008 | 3 Comments »
Sunday, March 30th, 2008
This is an attempt to revive the forum closed a year ago due to the lack of interest during that time. Now the number of visitors has increased by an order of magnitude and I get more and more requests to help with crash dump analysis but I cannot guarantee immediate response. Therefore I upgraded and reopened Crash Dump Analysis and Debugging Forum and encourage using it. In order to prevent spammers gaining access any new registration has to be approved by me (usually in less than 24 hours).
- Dmitry Vostokov @ DumpAnalysis.org -
Posted in Announcements, Crash Dump Analysis, Crash Dump Patterns, Crash Dumps for Dummies, Debugging, Minidump Analysis, Software Technical Support | No Comments »
Tuesday, March 25th, 2008
Although the first volume has not been published yet (scheduled for 15th of April, 2008) the planning for the second volume has already begun. Preliminary information is:
- Title: Memory Dump Analysis Anthology, Volume 2
- Paperback: 512 pages (*)
- ISBN-13: 978-0-9558328-7-1
- Author: Dmitry Vostokov
- Publisher: Opentask (01 Oct 2008)
- Language: English
- Product Dimensions: 22.86 x 15.24
Hardcover version is also planned. PDF version will be available for download too.
(*) subject to change
- Dmitry Vostokov @ DumpAnalysis.org -
Posted in Announcements, Assembly Language, Books, Bugchecks Depicted, Crash Dump Analysis, Crash Dump Patterns, Crash Dumps for Dummies, Debugging, Fun with Crash Dumps, Hardware, Kernel Development, Memory Dump Analysis Jobs, Memory Visualization, Minidump Analysis, Science of Memory Dump Analysis, Security, Software Architecture, Software Technical Support, Stack Trace Collection, Tools, Troubleshooting Methodology, Vista, WinDbg Scripts, WinDbg Tips and Tricks, WinDbg for GDB Users, Windows Server 2008 | 1 Comment »