Archive for the ‘Crash Analysis Report Environment (CARE)’ Category
Friday, April 9th, 2010
Plan to start providing training and seminars in my free time. If you are interested please answer these questions (you can either respond here in comments or use this form for private communication http://www.dumpanalysis.org/contact):
- Are you interested in on-site training, prefer traveling or attending webinars?
- Are you interested in software trace analysis as well?
- What specific topics are you interested in?
- What training level (beginner, intermediate, advanced) are you interested in? (please provide an example, if possible)
Additional topics of expertise that can be integrated into training include Source Code Reading and Analysis, Debugging, Windows Architecture, Device Drivers, Troubleshooting Tools Design and Implementation, Multithreading, Deep Down C and C++, x86 and x64 Assembly Language Reading.
Looking forward to your responses. Any suggestions are welcome.
- Dmitry Vostokov @ DumpAnalysis.org + TraceAnalysis.org -
Posted in .NET Debugging, Announcements, AntiPatterns, Assembly Language, Bugchecks Depicted, C and C++, CDA Pattern Classification, CDF Analysis Tips and Tricks, Certification, Code Reading, Common Mistakes, Crash Analysis Report Environment (CARE), Crash Dump Analysis, Crash Dump Patterns, Crash Dumps for Dummies, Data Recovery, DebugWare Patterns, Debugging, Debugging Methodology, Deep Down C++, Education and Research, Escalation Engineering, FreeBSD Crash Corner, GDB for WinDbg Users, Hardware, Hyper-V, Java Debugging, Kernel Development, Laws of Troubleshooting and Debugging, Linux Crash Corner, Mac Crash Corner, Memory Analysis Forensics and Intelligence, Memory Visualization, Minidump Analysis, Multithreading, Security, Software Architecture, Software Defect Construction, Software Engineering, Software Generalist, Software Maintenance Institute, Software Narratology, Software Technical Support, Software Trace Analysis, Software Trace Visualization, Software Tracing for Dummies, Software Victimology, Stack Trace Collection, Testing, Tools, Trace Analysis Patterns, Training and Seminars, Troubleshooting Methodology, Victimware, Virtualization, Vista, Visual Dump Analysis, WinDbg Scripts, WinDbg Tips and Tricks, WinDbg for GDB Users, Windows 7, Windows Server 2008, Windows System Administration, Workaround Patterns | No Comments »
Sunday, February 14th, 2010
Thanks to everyone who submitted their debugger logs. Now VBScript and WinDbg script files are available for download from the CARE page:
http://www.dumpanalysis.org/care
VBScript file scans all hard drives for .DMP files and launches WinDbg to run a mode-independent WinDbg script. Each instance of WinDbg appends the output to dbgeng.log file that you can submit to CARE (please zip it if exceeds 2Mb).
- Dmitry Vostokov @ DumpAnalysis.org + TraceAnalysis.org -
Posted in Announcements, Crash Analysis Report Environment (CARE), Crash Dump Analysis, Crash Dump Patterns, Debugging | No Comments »
Thursday, February 11th, 2010
This is a revised, edited, cross-referenced and thematically organized volume of selected DumpAnalysis.org blog posts about crash dump analysis and debugging written in July 2009 - January 2010 for software engineers developing and maintaining products on Windows platforms, quality assurance engineers testing software on Windows platforms and technical support and escalation engineers dealing with complex software issues. The fourth volume features:
- 13 new crash dump analysis patterns
- 13 new pattern interaction case studies
- 10 new trace analysis patterns
- 6 new Debugware patterns and case study
- Workaround patterns
- Updated checklist
- Fully cross-referenced with Volume 1, Volume 2 and Volume 3
- New appendixes
Product information:
- Title: Memory Dump Analysis Anthology, Volume 4
- Author: Dmitry Vostokov
- Language: English
- Product Dimensions: 22.86 x 15.24
- Paperback: 410 pages
- Publisher: Opentask (30 March 2010)
- ISBN-13: 978-1-906717-86-5
- Hardcover: 410 pages
- Publisher: Opentask (30 April 2010)
- ISBN-13: 978-1-906717-87-2

Back cover features memory space art image: Internal Process Combustion.
- Dmitry Vostokov @ DumpAnalysis.org + TraceAnalysis.org -
Posted in .NET Debugging, Aesthetics of Memory Dumps, Announcements, AntiPatterns, Art, Assembly Language, Books, C and C++, CDA Pattern Classification, CDF Analysis Tips and Tricks, Categorical Debugging, Certification, Citrix, Code Reading, Common Mistakes, Computer Science, Countefactual Debugging, Crash Analysis Report Environment (CARE), Crash Dump Analysis, Crash Dump Patterns, Crash Dumps for Dummies, DebugWare Patterns, Debugging, Debugging Slang, Education and Research, Escalation Engineering, Fun with Crash Dumps, Games for Debugging, Hardware, Horrors of Computation, Hyper-V, Kernel Development, Laws of Troubleshooting and Debugging, Mathematics of Debugging, Memiotics (Memory Semiotics), Memoidealism, Memoretics, Memory Analysis Culture, Memory Analysis Forensics and Intelligence, Memory Dreams, Memory Dump Analysis Jobs, Memory Dumps in Movies, Memory Space Art, Memory Visualization, Memuonics, Minidump Analysis, Multithreading, Music for Debugging, New Acronyms, New Words, Opcodism, Philosophy, Physicalist Art, Publishing, Science Fiction, Science of Memory Dump Analysis, Science of Software Tracing, Security, Software Architecture, Software Defect Construction, Software Engineering, Software Generalist, Software Maintenance Institute, Software Narratology, Software Technical Support, Software Trace Analysis, Software Trace Visualization, Software Tracing for Dummies, Software Victimology, Stack Trace Collection, Testing, Tools, Trace Analysis Patterns, Training and Seminars, Troubleshooting Methodology, Victimware, Virtualization, Vista, Visual Dump Analysis, WinDbg Scripts, WinDbg Tips and Tricks, WinDbg for GDB Users, Windows 7, Windows Server 2008, Windows System Administration, Workaround Patterns | No Comments »
Monday, February 1st, 2010
While testing a WinDbg script for the CARE system (the script enumerates files on a Windows PC and processes memory dumps to generate a log file with the output of debugger commands) I found that after successful processing of many files the next launched WinDbg instance suddenly showed this message box:
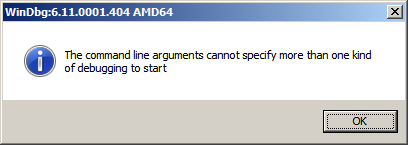
To find out, I attached another WinDbg instance to its process in order to examine the real command line. In this small case study instead of using kb WinDbg command to show a stack trace and its arguments I employ kn, .frame and kb <lines> commands for visual clarity and to illustrate strack trace frame navigation. In the failed WinDbg instance that had just started we see only one thread showing Message Box pattern:
0:000> ~*kn
.  0  Id: dc8.fb4 Suspend: 1 Teb: 000007ff`fffdc000 Unfrozen

 # Child-SP          RetAddr           Call Site

00 00000000`0025d4b8 00000000`76fc5118 USER32!NtUserWaitMessage+0xa

01 00000000`0025d4c0 00000000`76fc5770 USER32!DialogBox2+0x261

02 00000000`0025d540 00000000`7701000d USER32!InternalDialogBox+0x134

03 00000000`0025d5a0 00000000`7700f2b8 USER32!SoftModalMessageBox+0x9fb

04 00000000`0025d6d0 00000000`7700eb17 USER32!MessageBoxWorker+0x314

05 00000000`0025d890 00000000`7700ea10 USER32!MessageBoxTimeoutW+0xb3

06 00000000`0025d950 00000001`3f9016a6 USER32!MessageBoxW+0x4c

07 00000000`0025d990 00000001`3f90175c WinDbg!TextMsgBox+0x96

08 00000000`0025d9d0 00000001`3f9017d7 WinDbg!FormatMsgBoxV+0x9c

09 00000000`0025dbe0 00000001`3f9075c7 WinDbg!InfoBox+0x37

0a 00000000`0025dc20 00000001`3f9084f7 WinDbg!ParseCommandLine+0x1a57

0b 00000000`0025dcc0 00000001`3f913739 WinDbg!wmain+0×287

0c 00000000`0025fd80 00000000`7708be3d WinDbg!_CxxFrameHandler3+0×291

0d 00000000`0025fdc0 00000000`771c6a51 kernel32!BaseThreadInitThunk+0xd

0e 00000000`0025fdf0 00000000`00000000 ntdll!RtlUserThreadStart+0×1d
We see the frame # 0b contains the return address of wmain function (starting point of execution of UNICODE C/C++ programs) that has this prototype:
int wmain(int argc, wchar_t *argv[], wchar_t *envp[]);
We switch to that frame to examine its first 3 parameters and use kb command that shows stack traces starting from the current frame (we are interested in the top stack trace line only):
0:000> .frame b

0b 00000000`0025dcc0 00000001`3f913739 WinDbg!wmain+0×287
0:000> kb 1

RetAddr           : Args to Child                                                           : Call Site

00000001`3f913739 : 00000000`0000000c 00000000`00278b60 00000000`00279e10 000007de`a4ecc920 : WinDbg!wmain+0×287
Because the function prototype shows the second function parameter as an array of wide character null-terminated strings we use dpu command to dump them. We also note that we have only 0xc array members and use this as the length argument for dpu:
0:000> dpu 00000000`00278b60 Lc

00000000`00278b60  00000000`00278bc8 “C:\Program Files\Debugging Tools for Windows (x64)\WinD”

00000000`00278b68  00000000`00278c44 “-y”

00000000`00278b70  00000000`00278c4a “srv*c:\ms*http://msdl.microsoft.com/download/symbols;sr”

00000000`00278b78  00000000`00278d0c “-z”

00000000`00278b80  00000000`00278d12 “C:\MemoryDumps\CST\ColorimetricTracing”

00000000`00278b88  00000000`00278d60 “(4).DMP”

00000000`00278b90  00000000`00278d70 “-c”

00000000`00278b98  00000000`00278d76 “$$>a<DebuggerLogs.txt;q”

00000000`00278ba0  00000000`00278da6 “-Q”

00000000`00278ba8  00000000`00278dac “-QS”

00000000`00278bb0  00000000`00278db4 “-QY”

00000000`00278bb8  00000000`00278dbc “-QSY”
We see in the output above that “C:\MemoryDumps\CST\ColorimetricTracing” and “(4).DMP” strings were probably split from one file name “C:\MemoryDumps\CST\ColorimetricTracing (4).DMP” and this means that we forgot to enclose the file name parameter in double quotation marks when passing it from VB script to WinDbg.
- Dmitry Vostokov @ DumpAnalysis.org + TraceAnalysis.org -
Posted in Crash Analysis Report Environment (CARE), Crash Dump Analysis, Crash Dump Patterns, Debugging, WinDbg Scripts | No Comments »
Friday, January 29th, 2010
These are scripts that can be run without modification in both user and kernel modes to collect information from user and kernel spaces. For example, we want to collect thread stack traces for CARE system and we have different kinds of memory dumps stored on our computer. There is no a single command that can show stack traces for all threads in a process and kernel / complete memory dumps. However, we can combine separate mode-sensitive commands in one script:
.kframes 1000

!for_each_thread !thread @#Thread 1f

~*kv
The first command eliminates the common mistake of truncated traces. The second command fails for process user memory dumps but shows full 3-parameter stack trace for every thread in a system including user space thread stack counterpart for complete memory dumps after switching to the appropriate process context if any. The third command fails for kernel and complete memory dumps but lists stack traces for each thread in a process user memory dump. Therefore, we have just one script that we can run against all memory dumps.
- Dmitry Vostokov @ DumpAnalysis.org + TraceAnalysis.org -
Posted in Crash Analysis Report Environment (CARE), Crash Dump Analysis, Crash Dump Patterns, Debugging, WinDbg Scripts, WinDbg Tips and Tricks | 1 Comment »