Chance Exceptions in A Turing Machine
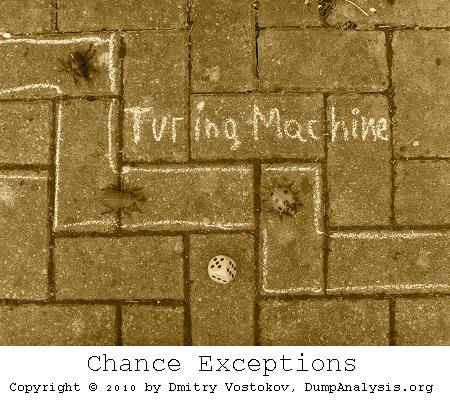
October 4th, 2010This is an image fragment from the front cover of the forthcoming Debugged! MZ/PE December issue:
- Dmitry Vostokov @ DumpAnalysis.org + TraceAnalysis.org -
This is an image fragment from the front cover of the forthcoming Debugged! MZ/PE December issue:
- Dmitry Vostokov @ DumpAnalysis.org + TraceAnalysis.org -
It is a common technique in driver development to copy/paste an entire driver sample from WDK and modify it for a specific device or a filter value-adding functionality in a specific driver stack or framework. The problem here is that developers sometimes forget to change module resources and certain amount of detective work is required to find out the module vendor. I call this pattern Template Module. Here is an example. In a spooler service there were many threads blocked in displaying a dialog box:
0:000> ~34kL 100

Child-SP          RetAddr           Call Site

00000000`08a49368 00000000`774c5118 user32!NtUserWaitMessage+0xa

00000000`08a49370 00000000`774c5770 user32!DialogBox2+0x261

00000000`08a493f0 00000000`774c57e6 user32!InternalDialogBox+0x134

00000000`08a49450 00000000`774c3e36 user32!DialogBoxIndirectParamAorW+0x58

00000000`08a49490 000007fe`fa27cc97 user32!DialogBoxParamW+0x66

00000000`08a494d0 000007fe`fa28832b unidrvui!ICheckConstraintsDlg+0xbf

00000000`08a49950 000007fe`fa29423d unidrvui!BUpdateUISettingForOEM+0x2f

00000000`08a49980 00000000`50036d2c unidrvui!CPrintOemDriverUI::DrvUpdateUISetting+0x1d

00000000`08a499b0 00000000`50038a1d ModuleZ!DllGetClassObject+0×1fe74

[…]

00000000`08a4b250 000007fe`f759546b unidrvui!OEMDevicePropertySheets+0×56

00000000`08a4b280 000007fe`f759653e compstui!CallpfnPSUI+0×137

00000000`08a4b330 000007fe`f7596b84 compstui!InsertPSUIPage+0×24a

00000000`08a4b5f0 000007fe`fa2880e9 compstui!CPSUICallBack+0×3ec

00000000`08a4b6a0 000007fe`fa2836c4 unidrvui!BAddOemPluginPages+0×12d

00000000`08a4b6d0 000007fe`f759546b unidrvui!DrvDevicePropertySheets+0×2c8

00000000`08a4bb60 000007fe`f759653e compstui!CallpfnPSUI+0×137

00000000`08a4bc10 000007fe`f7596b84 compstui!InsertPSUIPage+0×24a

00000000`08a4bed0 000007fe`fb452838 compstui!CPSUICallBack+0×3ec

00000000`08a4bf80 000007fe`f759546b winspool!DevicePropertySheets+0×108

00000000`08a4bfb0 000007fe`f759653e compstui!CallpfnPSUI+0×137

00000000`08a4c060 000007fe`f7596b84 compstui!InsertPSUIPage+0×24a

00000000`08a4c320 000007fe`f759758e compstui!CPSUICallBack+0×3ec

00000000`08a4c3d0 000007fe`f75976b2 compstui!DoCommonPropertySheetUI+0xbe

00000000`08a4c430 000007fe`fb446339 compstui!CommonPropertySheetUIW+0xe

00000000`08a4c470 000007fe`fb44b425 winspool!CallCommonPropertySheetUI+0×65

00000000`08a4c4c0 00000000`5003623c winspool!PrinterPropertiesNative+0×121

00000000`08a4c950 00000000`50035d16 ModuleZ!DllGetClassObject+0×1f384

[…]

00000000`08a4dd70 000007fe`fb4472d8 unidrvui!DrvPrinterEvent+0×419

00000000`08a4de00 000007fe`fb44737f winspool!SpoolerPrinterEventNative+0×84

00000000`08a4de60 000007fe`faedc957 winspool!SpoolerPrinterEvent+0×13

00000000`08a4dea0 000007fe`faedc8c7 localspl!SplDriverEvent+0×4f

00000000`08a4def0 000007fe`faec3d74 localspl!PrinterDriverEvent+0xcf

00000000`08a4df30 000007fe`fa771f20 localspl!SplAddPrinter+0xae0

00000000`08a4e4e0 000007fe`fa7491d8 win32spl!NCSRCommon::TLocalPrinter::AddPrinterW+0xb4

00000000`08a4e5b0 000007fe`fa747511 win32spl!TPrintOpen::AddLocalPrinter+0xb8

00000000`08a4e6b0 000007fe`fa746dfb win32spl!TPrintOpen::AddAndInstallLocalPrinter+0×34d

00000000`08a4e830 000007fe`fa746bb0 win32spl!TPrintOpen::ReEstablishCacheConnectionNoGuidPrinter+0×157

00000000`08a4e900 000007fe`fa7467d1 win32spl!TPrintOpen::ReEstablishCacheConnection+0×178

00000000`08a4e980 000007fe`fa7465c1 win32spl!TPrintOpen::ReEstablishPrinterConnection+0×16d

00000000`08a4ea30 000007fe`fa73e5ad win32spl!TPrintOpen::ReEstablishConnectionFromKey+0×1fd

00000000`08a4eb30 000007fe`fa733492 win32spl!TPrintOpen::RediscoverPrinterConnections+0xd7

00000000`08a4ebe0 000007fe`fb3f2332 win32spl!TPrintProviderTable::forwardEnumPrinters+0×47

00000000`08a4ec70 00000000`ff3414c8 spoolss!EnumPrintersW+0×176

00000000`08a4ed20 00000000`ff3413cc spoolsv!YEnumPrinters+0×112

00000000`08a4eda0 000007fe`fe225ec5 spoolsv!RpcEnumPrinters+0×30

00000000`08a4edf0 000007fe`fe2bebed rpcrt4!Invoke+0×65

00000000`08a4ee70 000007fe`fe1f5df0 rpcrt4!Ndr64StubWorker+0×5a9

00000000`08a4f440 000007fe`fe2268d4 rpcrt4!NdrServerCallAll+0×40

00000000`08a4f490 000007fe`fe2269f0 rpcrt4!DispatchToStubInCNoAvrf+0×14

00000000`08a4f4c0 000007fe`fe227402 rpcrt4!RPC_INTERFACE::DispatchToStubWorker+0×100

00000000`08a4f5b0 000007fe`fe227080 rpcrt4!LRPC_SCALL::DispatchRequest+0×1c2

00000000`08a4f620 000007fe`fe2262bb rpcrt4!LRPC_SCALL::HandleRequest+0×200

00000000`08a4f740 000007fe`fe225e1a rpcrt4!LRPC_ADDRESS::ProcessIO+0×44a

00000000`08a4f860 000007fe`fe207769 rpcrt4!LOADABLE_TRANSPORT::ProcessIOEvents+0×24a

00000000`08a4f910 000007fe`fe207714 rpcrt4!ProcessIOEventsWrapper+0×9

00000000`08a4f940 000007fe`fe2077a4 rpcrt4!BaseCachedThreadRoutine+0×94

00000000`08a4f980 00000000`7758be3d rpcrt4!ThreadStartRoutine+0×24

00000000`08a4f9b0 00000000`776c6a51 kernel32!BaseThreadInitThunk+0xd

00000000`08a4f9e0 00000000`00000000 ntdll!RtlUserThreadStart+0×1d
We suspect ModuleZ but its module information points to Microsoft:
0:000> lmv m ModuleZ

start             end                 module name

00000000`50000000 00000000`500a4000   ModuleZ   (export symbols)       ModuleZ.DLL

    Loaded symbol image file: ModuleZ.DLL

    Image path: C:\Windows\System32\spool\drivers\x64\3\ModuleZ.DLL

    Image name: ModuleZ.DLL

    Timestamp:        Feb […] 2010

    […]

    File version:     2.5.0.0

    Product version:  2.5.0.0

    File flags:       0 (Mask 3F)

    File OS:          40004 NT Win32

    File type:        2.0 Dll

    File date:        00000000.00000000

    Translations:     0407.04b0

    CompanyName:      Microsoft Corp.

    ProductName:      Microsoft PS UI Replacement Sample

    InternalName:     PSUIREP

    OriginalFilename: PSUIREP.dll

    ProductVersion:   2.5

    FileVersion:      2.5.0.0

    FileDescription:  PS UI Replacement Sample

    LegalCopyright:   Copyright © 1998 - 2009 Microsoft Corp.

    LegalTrademarks:  Microsoft® is a registered trademark of Microsoft Corporation. Windows(TM) is a trademark of Microsoft Corporation

    Comments:         Written by Windows Printing & Imaging Team
Having never seen ModuleZ in Microsoft module lists and suspecting the word “Sample” in a file and product description we did Internet search and found the module name on various “DLL fixing” websites but still pointing to Microsoft in module description. However, in a full module list (lmt WinDbg command) we found more modules having Module* name structure:
0:000> lmv m ModuleC

start             end                 module name

00000000`10000000 00000000`100b7000   ModuleC   (deferred)

    Image path: C:\Windows\System32\spool\drivers\x64\3\ModuleC.DLL

    Image name: ModuleC.DLL

    Timestamp:        Feb […] 2010

    […]

    File version:     20.1.0.0

    Product version:  20.1.0.0

    File flags:       0 (Mask 17)

    File OS:          4 Unknown Win32

    File type:        2.0 Dll

    File date:        00000000.00000000

    Translations:     0409.04b0

    CompanyName:

    ProductName:      Printer Driver

    InternalName:     MC.dll

    OriginalFilename: MC.dll

    ProductVersion:   20.1.0.0

    FileVersion:      20.1.0.0

    FileDescription:  Printer Driver

    LegalCopyright:
0:000> lmv m ModuleO

start             end                 module name

00000000`6f280000 00000000`6f2e2000   ModuleO   (deferred)

    Image path: C:\Windows\System32\spool\drivers\x64\3\ModuleO.DLL

    Image name: ModuleO.DLL

    Timestamp:        Feb […] 2010

    […]

    File version:     2.4.0.0

    Product version:  2.4.0.0

    File flags:       8 (Mask 3F) Private

    File OS:          40004 NT Win32

    File type:        3.1 Driver

    File date:        00000000.00000000

    Translations:     0409.04b0

    CompanyName:      CompanyA

    ProductName:      CompanyA Printer driver

    InternalName:     ModuleO.dll

    OriginalFilename: ModuleO.dll

    ProductVersion:   2.4

    FileVersion:      2.4.0.0

    FileDescription:  CompanyA Printer driver

    LegalCopyright:   Copyright © CompanyA

    Comments:
We see that both module names and time stamps follow the same pattern so our “Microsoft” ModuleZ is definitely from CompanyA instead. We also check more detailed information:
0:000> !lmi 00000000`50000000

Loaded Module Info: [00000000`50000000]

         Module: ModuleZ

[...]

               Pdb: N:\ServerQ\[…]

[…]
0:000> !lmi 00000000`10000000

Loaded Module Info: [00000000`10000000]

         Module: ModuleC

[...]

               Pdb: N:\ServerQ\[…]

[…]
0:000> !lmi 00000000`6f280000

Loaded Module Info: [00000000`6f280000]

         Module: ModuleO

[...]

               Pdb: N:\ServerQ\[…]

[…]
All three modules have the same build server in their PDB file name path. We advised to contact CompanyA for updates.
- Dmitry Vostokov @ DumpAnalysis.org + TraceAnalysis.org -
After firing 3 bugtations in a row noticed that I lost all followers 
- Dmitry Vostokov @ DumpAnalysis.org + TraceAnalysis.org -
A Momentary Lapse of Computation.
- Dmitry Vostokov @ DumpAnalysis.org + TraceAnalysis.org -
The first bugtation where the source book title and the chapter number and name were bugtated too:
The engineer who has no tincture for memory dump analysis goes through life cycle imprisoned in the prejudices derived from coding… (The Problems of Computation. Chapter 0x5: The Value of Memory Dump Analysis)
Bertrand Russell, The Problems of Philosophy, Chapter XV: The Value of Philosophy
- Dmitry Vostokov @ DumpAnalysis.org + TraceAnalysis.org -
Yet another variation on Bugtation No.98 theme:
I am because we memory dump and because we memory dump therefore I am.
African proverb
- Dmitry Vostokov @ DumpAnalysis.org + TraceAnalysis.org -
I was thinking for some time about applying crash dump analysis patterns (later including software trace analysis patterns and more recently structural memory patterns) to History (one of my favourite study subjects) using metaphorical bijectionism as I tried before with the analysis of project failures. Yesterday I found this book that applies the perspective of patterns in natural sciences to History (according to its description):
Pattern and Repertoire in History

I plan to review the book and highlight the differences and similarities between the authors’ and mine patternist approaches to History.
- Dmitry Vostokov @ DumpAnalysis.org + TraceAnalysis.org -
The next pattern is called Region Boundary. It is an inaccessible range of memory that surrounds Closed Memory Region. For example, the closed region of a kernel stack for the following thread has a one page boundary region next to its Base:
1: kd> !thread

THREAD fffffa8004544b60  Cid 0a6c.0acc  Teb: 000007fffffde000 Win32Thread: fffff900c1eb4010 RUNNING on processor 1

IRP List:

    fffffa8004d7e010: (0006,0118) Flags: 00060000  Mdl: 00000000

Not impersonating

DeviceMap                 fffff8a001e84c00

Owning Process            fffffa8004f68370       Image:         NotMyfault.exe

Attached Process          N/A            Image:         N/A

Wait Start TickCount      40290          Ticks: 0

Context Switch Count      408                 LargeStack

UserTime                  00:00:00.015

KernelTime                00:00:00.015

Win32 Start Address NotMyfault (0x0000000140002708)

Stack Init fffff8800587cdb0 Current fffff8800587c6f0

Base fffff8800587d000 Limit fffff88005874000 Call 0

[…]
1: kd> !pte fffff880`0587d000

                                           VA fffff8800587d000

PXE at FFFFF6FB7DBEDF88    PPE at FFFFF6FB7DBF1000    PDE at FFFFF6FB7E200160    PTE at FFFFF6FC4002C3E8

contains 0000000133D84863  contains 0000000133D83863  contains 00000000AA9AE863  contains 0000000000000000

pfn 133d84    ---DA--KWEV  pfn 133d83    ---DA--KWEV  pfn aa9ae     ---DA--KWEV  not valid
1: kd> !pte fffff880`0587d000+0n4096-1

  VA fffff8800587dfff

PXE at FFFFF6FB7DBEDF88 PPE at FFFFF6FB7DBF1000 PDE at FFFFF6FB7E200160 PTE at FFFFF6FC4002C3E8

contains 0000000133D84863 contains 0000000133D83863 contains 00000000AA9AE863 contains 0000000000000000

pfn 133d84 —DA–KWEV pfn 133d83 —DA–KWEV pfn aa9ae —DA–KWEV not valid
1: kd> !pte fffff880`0587d000+0n4096

                                           VA fffff8800587e000

PXE at FFFFF6FB7DBEDF88    PPE at FFFFF6FB7DBF1000    PDE at FFFFF6FB7E200160    PTE at FFFFF6FC4002C3F0

contains 0000000133D84863  contains 0000000133D83863  contains 00000000AA9AE863  contains 8000000028230963

pfn 133d84    —DA–KWEV  pfn 133d83    —DA–KWEV  pfn aa9ae     —DA–KWEV  pfn 28230     -G-DA–KW-V
The region after boundary belongs to another process thread kernel stack (I use CodeMachine WinDbg extension here):
1: kd> !cmkd.kvas  fffff8800587e000

kvas : Show region containing fffff8800587e000

### Start            End                                  Length Type

006 fffff88000000000 fffff89fffffffff       2000000000 ( 128 GB) SystemPTEs

Thread FFFFFA80053D0B60 [0798.0a5c] Stack fffff88005884000 - fffff8800587e000
1: kd> !thread FFFFFA80053D0B60

THREAD fffffa80053d0b60  Cid 0798.0a5c  Teb: 000007fffffdd000 Win32Thread: 0000000000000000 WAIT: (DelayExecution) UserMode Non-Alertable

    fffffa80053d0f20  Semaphore Limit 0x1

Not impersonating

DeviceMap                 fffff8a001e84c00

Owning Process            fffffa80053ce630       Image:         ApplicationB.exe

Attached Process          N/A            Image:         N/A

Wait Start TickCount      34911          Ticks: 5379 (0:00:01:23.912)

Context Switch Count      22

UserTime                  00:00:00.000

KernelTime                00:00:00.000

Win32 Start Address 0x000000013fe01538

Stack Init fffff88005883db0 Current fffff88005883970

Base fffff88005884000 Limit fffff8800587e000 Call 0

[…]
- Dmitry Vostokov @ DumpAnalysis.org + TraceAnalysis.org -
Now we propose the next group of general patterns related to memory regions (the terminology was partially influenced from topology). The first one we call Memory Region, for example:
1: kd> dp fffff88005875000 fffff88005875010

fffff880`05875000  039b5000`6e696268 00000000`00002000

fffff880`05875010  00000000`00000000
There are Open and Closed memory regions. We can extend the former ones in one or both directions:
1: kd> dp fffff88005875000-10 fffff88005875010+10

fffff880`05874ff0  6ab90c4f`039ba1b8 039b8050`fffffff8

fffff880`05875000  039b5000`6e696268 00000000`00002000

fffff880`05875010  00000000`00000000 00000000`00000000

fffff880`05875020  00000294`ffffffd0
The closed regions cannot be read past its boundary, like this kernel stack region [fffff880`05874000 fffff8800587d000):
1: kd> dp fffff88005874000-30

fffff880`05873fd0  ????????`???????? ????????`????????

fffff880`05873fe0  ????????`???????? ????????`????????

fffff880`05873ff0  ????????`???????? ????????`????????

fffff880`05874000  039ba000`6e696268 00000000`00001000

fffff880`05874010  00000000`00000000 00000000`00000000

fffff880`05874020  00206b6e`ffffffa8 01cae7bd`b8aca323

fffff880`05874030  039b6698`00000000 00000000`00000001

fffff880`05874040  ffffffff`039bafe8 039b6710`00000004
1: kd> dp fffff8800587d000-30

fffff880`0587cfd0  00000000`00000000 00000000`00000000

fffff880`0587cfe0  00000000`00000000 00000000`00000000

fffff880`0587cff0  00000000`00000000 00000000`00000000

fffff880`0587d000  ????????`???????? ????????`????????

fffff880`0587d010  ????????`???????? ????????`????????

fffff880`0587d020  ????????`???????? ????????`????????

fffff880`0587d030  ????????`???????? ????????`????????

fffff880`0587d040  ????????`???????? ????????`????????
- Dmitry Vostokov @ DumpAnalysis.org + TraceAnalysis.org -
Another tool that supports adjoint threading in addition to Citrix CDFAnalyzer (see also Debugging Experts magazine article for pictorial description of this concept) is Process Monitor. We can view adjoint threads having common attributes like TID (ordinary threads), PID, operation (function), process name, etc. by using this right click context menu:
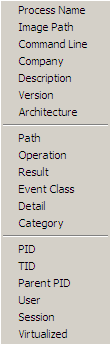
For example, this adjoint thread having RegOpenKey as its ATID (Adjoint Thread ID) where we excluded Path, Result and Detail fields for viewing clarity (together these fields can constitute an analogous Message field in TMF traces):
Time of Day      Process Name PID  TID  Operation

[…]

09:33:25.9545410 Explorer.EXE 1292 1032 RegOpenKey

09:33:25.9548650 Explorer.EXE 1292 1032 RegOpenKey

09:33:25.9550234 Explorer.EXE 1292 1032 RegOpenKey

09:33:25.9551656 Explorer.EXE 1292 1032 RegOpenKey

09:33:25.9692456 WFICA32.EXE  3588 3496 RegOpenKey

09:33:25.9761325 wfcrun32.exe 852  1148 RegOpenKey

09:33:25.9761912 wfcrun32.exe 852  1148 RegOpenKey

09:33:25.9762295 wfcrun32.exe 852  1148 RegOpenKey

09:33:25.9984547 wfcrun32.exe 852  1148 RegOpenKey

09:33:26.0023831 wfcrun32.exe 852  1148 RegOpenKey

09:33:26.0074675 wfcrun32.exe 852  1148 RegOpenKey

09:33:26.0087191 Explorer.EXE 1292 1032 RegOpenKey

09:33:26.1618595 iexplore.exe 1348 2228 RegOpenKey

09:33:26.1625697 iexplore.exe 1348 2228 RegOpenKey

09:33:26.1632745 iexplore.exe 1348 2228 RegOpenKey

09:33:26.1633924 iexplore.exe 1348 2228 RegOpenKey

09:33:26.1639209 iexplore.exe 1348 2228 RegOpenKey

[…]
So if someone writes a converter from TMF to PML format…
- Dmitry Vostokov @ DumpAnalysis.org + TraceAnalysis.org -
The title of these blog post series was motivated by a book I enjoyed reading this summer:
The Altenberg 16: An Exposé of the Evolution Industry

Finally, after thinking and keeping silence (this blog post was in draft folder for several months) I plan an interview next month for a start.
- Dmitry Vostokov @ DumpAnalysis.org + TraceAnalysis.org -
Inherit a fortune - To get a postmortem artifact like a crash dump.
Examples:
- My program died!
- Did you inherit a fortune?
- Oh, yeah!
- Dmitry Vostokov @ DumpAnalysis.org + TraceAnalysis.org -
While browsing architecture books on Amazon I found one with a glitch when you use look inside feature (at the time of this writing):
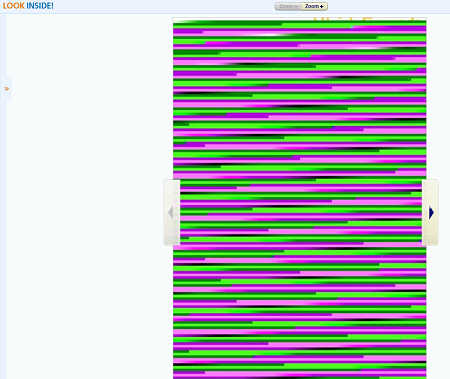
All this reminds me of fragments I see in naturally visualized computer memory that prompts me to conjecture that most all (if not all) computer glitches stem from memory restructuring (a postmodern term for memory corruption).
The book with search inside glitch: Programs and Manifestoes on 20th-Century Architecture

- Dmitry Vostokov @ DumpAnalysis.org + TraceAnalysis.org -
My April fool’s joke about the 5th dump type partially came true. I’ve just noticed the new tab “Silent Process Exit” in gflags.exe on my W2K8 R2 server:
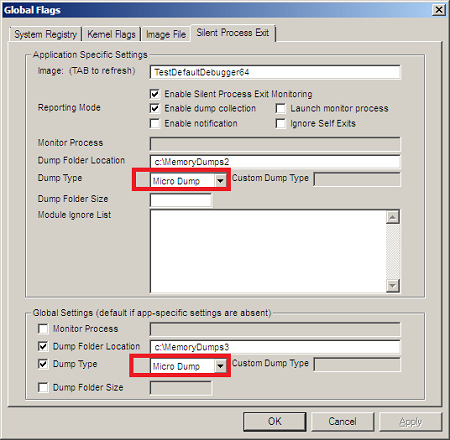
The registry keys corresponding to settings are:
HKEY_LOCAL_MACHINE \ SOFTWARE \ Microsoft \ Windows NT \CurrentVersion \ SilentProcessExit

HKEY_LOCAL_MACHINE \ SOFTWARE \ Microsoft \ Windows NT \ CurrentVersion \ SilentProcessExit \ TestDefaultDebugger64

DumpType (DWORD) 0x88
I continue my investigation and report more later.
- Dmitry Vostokov @ DumpAnalysis.org + TraceAnalysis.org -
Today we introduce an icon for No Process Dumps pattern:
B/W

Color

- Dmitry Vostokov @ DumpAnalysis.org + TraceAnalysis.org -
Comments in italics are mine and express my own views, thoughts and opinions
Windows Internals by M. Russinovich, D. Solomon and A. Ionescu:
I/O Completion Ports (pp. 592 - 598) - my own architectural investigation from a complete memory dump perspective: http://www.dumpanalysis.org/blog/index.php/2007/11/27/understanding-io-completion-ports/
Lock contention (p. 594) - some patterns: http://www.dumpanalysis.org/blog/index.php/2010/09/21/contention-patterns/
Concurrency value may exceed concurrently limit for I/O CP (p. 595)
KeRemoveQueueEx (p. 596) - see also Passive System Thread pattern: http://www.dumpanalysis.org/blog/index.php/2007/11/20/crash-dump-analysis-patterns-part-31a/
I/O priority queues and strategies for IRP (p. 599) - priority fields in _EPROCESS and _ETHREAD structures from x64 W2K8 R2:
1: kd> dt _EPROCESS

ntdll!_EPROCESS

+0x000 Pcb              : _KPROCESS

[...]

+0x438 DefaultIoPriority : Pos 27, 3 Bits

[...]
1: kd> dt _ETHREAD

ntdll!_ETHREAD

+0x000 Tcb              : _KTHREAD

[...]

+0x448 ThreadIoPriority : Pos 10, 3 Bits

[...]
Driver Verifier (pp. 604 - 606) - see also Instrumentation Information pattern: http://www.dumpanalysis.org/blog/index.php/2010/09/27/crash-dump-analysis-patterns-part-107/
WDF book (p. 607) - there is also another book coming soon: http://www.dumpanalysis.org/blog/index.php/2010/08/19/windows-7-device-driver-book/
Listing KMDF drivers (p. 608) - here’s the output from x64 W2K8 R2 system:
1: kd> !wdfkd.wdfldr

LoadedModuleList      0xfffff8800115a2d8

----------------------------------

LIBRARY_MODULE  fffffa8003bc8d10

Version       v1.9 build(7600)

Service       \Registry\Machine\System\CurrentControlSet\Services\Wdf01000

ImageName     Wdf01000.sys

ImageAddress  0xfffff880010ae000

ImageSize     0xa4000

Associated Clients: 10
  ImageName      Version    WdfGlobals         FxGlobals          ImageAddress       ImageSize

peauth.sys     v1.7(6001) 0xfffffa8004bf6510 0xfffffa8004bf63c0 0xfffff88004600000 0x000a6000

monitor.sys    v1.9(7600) 0xfffffa80048f55d0 0xfffffa80048f5480 0xfffff88003752000 0x0000e000

umbus.sys      v1.9(7600) 0xfffffa8004371160 0xfffffa8004371010 0xfffff88002db0000 0x00012000

CompositeBus.sys v1.9(7600) 0xfffffa8004440800 0xfffffa80044406b0 0xfffff88002a45000 0x00010000

HDAudBus.sys   v1.7(6001) 0xfffffa80043c9160 0xfffffa80043c9010 0xfffff88002b48000 0x00024000

intelppm.sys   v1.9(7600) 0xfffffa8004271dd0 0xfffffa8004271c80 0xfffff88002ab0000 0x00016000

cdrom.sys      v1.9(7600) 0xfffffa80041f3fc0 0xfffffa80041f3e70 0xfffff88001400000 0x0002a000

vmstorfl.sys   v1.5(6000) 0xfffffa80040129e0 0xfffffa8004012890 0xfffff88001750000 0x00010000

msisadrv.sys   v1.9(7600) 0xfffffa8003ebb910 0xfffffa8003ebb7c0 0xfffff880012c6000 0x0000a000

vdrvroot.sys   v1.9(7600) 0xfffffa8003d3fa00 0xfffffa8003d3f8b0 0xfffff88001262000 0x0000d000

----------------------------------

Total: 1 library loaded
Extension of device extension extension into object context in KMDF (pp. 611 - 612)
UMDF reflectors (p. 617)
WUDFHost.exe (p. 618) - here’s its stack trace collection from x64 W2K8 R2 after I inserted an USB flash drive and attached WinDbg non-invasilvely:
0:000> ~*k
.  0  Id: 58c.12f4 Suspend: 1 Teb: 000007ff`fffde000 Unfrozen

Child-SP          RetAddr           Call Site

00000000`0018f988 000007fe`fd8510ac ntdll!ZwWaitForSingleObject+0xa

00000000`0018f990 00000000`ff3bba44 KERNELBASE!WaitForSingleObjectEx+0x9c

00000000`0018fa30 00000000`ff3b8ce7 WUDFHost!CLpcNotification::Run+0x1c

00000000`0018fa60 00000000`ff3d2cb1 WUDFHost!wmain+0xc7b

00000000`0018fc60 00000000`7746f56d WUDFHost!ConvertStringSidToSidW+0x19b

00000000`0018fca0 00000000`776a3281 kernel32!BaseThreadInitThunk+0xd

00000000`0018fcd0 00000000`00000000 ntdll!RtlUserThreadStart+0x21
   1  Id: 58c.1304 Suspend: 1 Teb: 000007ff`fffdc000 Unfrozen

Child-SP          RetAddr           Call Site

00000000`00c4f918 000007fe`fd8753d6 ntdll!NtDeviceIoControlFile+0xa

00000000`00c4f920 00000000`7746610f KERNELBASE!WaitNamedPipeW+0x16c6

00000000`00c4f990 000007fe`fb87dd94 kernel32!DeviceIoControlImplementation+0x7f

00000000`00c4f9e0 000007fe`fb87e6cd WUDFPlatform!WPP_SF_ssd+0x1e4

00000000`00c4fa70 000007fe`fb87b8af WUDFPlatform!WdfLpcCorePortInterface::GetMessageW+0x119

00000000`00c4fc20 00000000`ff3bd7de WUDFPlatform!WdfWorkerThread::WorkerThread+0x127

00000000`00c4fc70 00000000`7746f56d WUDFHost!LpcWorkerThreadThunk+0x62

00000000`00c4fca0 00000000`776a3281 kernel32!BaseThreadInitThunk+0xd

00000000`00c4fcd0 00000000`00000000 ntdll!RtlUserThreadStart+0x21
   2  Id: 58c.6e8 Suspend: 1 Teb: 000007ff`fffda000 Unfrozen

Child-SP          RetAddr           Call Site

00000000`00dfe988 000007fe`fd853ef8 ntdll!NtQueryAttributesFile+0xa

00000000`00dfe990 000007fe`f3be9970 KERNELBASE!GetFileAttributesW+0x78

00000000`00dfea30 000007fe`f27ce8c9 WpdFs!COperationGetFastBasicProperties::OnImpersonate+0x1c0

00000000`00dfea70 000007fe`f3be9734 WUDFx!CWdfIoRequest::Impersonate+0x151

00000000`00dfeae0 000007fe`f3bda26b WpdFs!COperationGetFastBasicProperties::Invoke+0x2c4

00000000`00dfeb50 000007fe`f3bd8837 WpdFs!WpdObjectProperties::GetValues+0x3f7

00000000`00dfecd0 000007fe`f3bd8344 WpdFs!WpdObjectProperties::OnGetValues+0x10b

00000000`00dfed50 000007fe`f3bcf974 WpdFs!WpdObjectProperties::DispatchWpdMessage+0x1a0

00000000`00dfee10 000007fe`f3bcd51a WpdFs!WpdBaseDriver::DispatchWpdMessage+0x4c0

00000000`00dfef60 000007fe`f3bcdd6c WpdFs!CQueue::ProcessWpdMessage+0x29a

00000000`00dff010 000007fe`f27bf610 WpdFs!CQueue::OnDeviceIoControl+0x494

00000000`00dff160 000007fe`f27c0b5a WUDFx!CWdfIoQueue::SubmitRequest+0x358

00000000`00dff1f0 000007fe`f27c0955 WUDFx!CWdfIoQueue::DispatchRequestToDriver+0x86

00000000`00dff240 000007fe`f27bff83 WUDFx!CWdfIoQueue::DispatchEvents+0x3cd

00000000`00dff2b0 000007fe`f27b61b5 WUDFx!CWdfIoQueue::QueueRequest+0x2c3

00000000`00dff300 000007fe`f27b6f20 WUDFx!CWdfDevice::DispatchRequest+0x149

00000000`00dff350 00000000`ff3ccbb6 WUDFx!CWdfDevice::DeviceControl+0x1a8

00000000`00dff3c0 00000000`ff3c2f92 WUDFHost!CWudfIoIrp::Dispatch+0x13e

00000000`00dff420 00000000`ff3bad47 WUDFHost!CWudfDeviceStack::Forward+0x41a

00000000`00dff490 000007fe`fb87da6a WUDFHost!CLpcNotification::Message+0xd9b

00000000`00dff6c0 000007fe`fb87c848 WUDFPlatform!WdfLpcPort::ProcessMessage+0x3be

00000000`00dff760 000007fe`fb87b299 WUDFPlatform!WdfLpcCommPort::ProcessMessage+0x214

00000000`00dff7b0 000007fe`fb87b900 WUDFPlatform!WdfLpcConnPort::ProcessMessage+0xf9

00000000`00dff830 00000000`ff3bd7de WUDFPlatform!WdfWorkerThread::WorkerThread+0x178

00000000`00dff880 00000000`7746f56d WUDFHost!LpcWorkerThreadThunk+0x62

00000000`00dff8b0 00000000`776a3281 kernel32!BaseThreadInitThunk+0xd

00000000`00dff8e0 00000000`00000000 ntdll!RtlUserThreadStart+0x21
   3  Id: 58c.2e4 Suspend: 1 Teb: 000007ff`fffd8000 Unfrozen

Child-SP          RetAddr           Call Site

00000000`00d7f5e8 000007fe`fd8753d6 ntdll!NtDeviceIoControlFile+0xa

00000000`00d7f5f0 00000000`7746610f KERNELBASE!WaitNamedPipeW+0x16c6

00000000`00d7f660 000007fe`fb87dd94 kernel32!DeviceIoControlImplementation+0x7f

00000000`00d7f6b0 000007fe`fb87e6cd WUDFPlatform!WPP_SF_ssd+0x1e4

00000000`00d7f740 000007fe`fb87b8af WUDFPlatform!WdfLpcCorePortInterface::GetMessageW+0x119

00000000`00d7f8f0 00000000`ff3bd7de WUDFPlatform!WdfWorkerThread::WorkerThread+0x127

00000000`00d7f940 00000000`7746f56d WUDFHost!LpcWorkerThreadThunk+0x62

00000000`00d7f970 00000000`776a3281 kernel32!BaseThreadInitThunk+0xd

00000000`00d7f9a0 00000000`00000000 ntdll!RtlUserThreadStart+0x21
   4  Id: 58c.12b4 Suspend: 1 Teb: 000007ff`fffd6000 Unfrozen

Child-SP          RetAddr           Call Site

00000000`00f8fa58 000007fe`fd8753d6 ntdll!NtDeviceIoControlFile+0xa

00000000`00f8fa60 00000000`7746610f KERNELBASE!WaitNamedPipeW+0x16c6

00000000`00f8fad0 000007fe`fb87dd94 kernel32!DeviceIoControlImplementation+0x7f

00000000`00f8fb20 000007fe`fb87e6cd WUDFPlatform!WPP_SF_ssd+0x1e4

00000000`00f8fbb0 000007fe`fb87b8af WUDFPlatform!WdfLpcCorePortInterface::GetMessageW+0x119

00000000`00f8fd60 00000000`ff3bd7de WUDFPlatform!WdfWorkerThread::WorkerThread+0x127

00000000`00f8fdb0 00000000`7746f56d WUDFHost!LpcWorkerThreadThunk+0x62

00000000`00f8fde0 00000000`776a3281 kernel32!BaseThreadInitThunk+0xd

00000000`00f8fe10 00000000`00000000 ntdll!RtlUserThreadStart+0x21
   5  Id: 58c.106c Suspend: 1 Teb: 000007ff`fffd3000 Unfrozen

Child-SP          RetAddr           Call Site

00000000`00f0f958 000007fe`fd8753d6 ntdll!NtDeviceIoControlFile+0xa

00000000`00f0f960 00000000`7746610f KERNELBASE!WaitNamedPipeW+0x16c6

00000000`00f0f9d0 000007fe`fb87dd94 kernel32!DeviceIoControlImplementation+0x7f

00000000`00f0fa20 000007fe`fb87e6cd WUDFPlatform!WPP_SF_ssd+0x1e4

00000000`00f0fab0 000007fe`fb87b8af WUDFPlatform!WdfLpcCorePortInterface::GetMessageW+0x119

00000000`00f0fc60 00000000`ff3bd7de WUDFPlatform!WdfWorkerThread::WorkerThread+0x127

00000000`00f0fcb0 00000000`7746f56d WUDFHost!LpcWorkerThreadThunk+0x62

00000000`00f0fce0 00000000`776a3281 kernel32!BaseThreadInitThunk+0xd

00000000`00f0fd10 00000000`00000000 ntdll!RtlUserThreadStart+0x21
   6  Id: 58c.8fc Suspend: 1 Teb: 000007ff`fffae000 Unfrozen

Child-SP          RetAddr           Call Site

00000000`0136f8c8 00000000`7758c95e USER32!NtUserGetMessage+0xa

00000000`0136f8d0 000007fe`f3bd26e5 USER32!GetMessageW+0x34

00000000`0136f900 00000000`7746f56d WpdFs!CDiskNotifier::NotificationThreadWorker+0x245

00000000`0136fa50 00000000`776a3281 kernel32!BaseThreadInitThunk+0xd

00000000`0136fa80 00000000`00000000 ntdll!RtlUserThreadStart+0x21
   7  Id: 58c.520 Suspend: 1 Teb: 000007ff`fffac000 Unfrozen

Child-SP          RetAddr           Call Site

00000000`0152f6f8 00000000`77689bd7 ntdll!ZwWaitForMultipleObjects+0xa

00000000`0152f700 00000000`7746f56d ntdll!EtwTraceMessageVa+0xe07

00000000`0152f9a0 00000000`776a3281 kernel32!BaseThreadInitThunk+0xd

00000000`0152f9d0 00000000`00000000 ntdll!RtlUserThreadStart+0x21
   8  Id: 58c.89c Suspend: 1 Teb: 000007ff`fffaa000 Unfrozen

Child-SP          RetAddr           Call Site

00000000`012df9b8 00000000`7768914b ntdll!ZwWaitForWorkViaWorkerFactory+0xa

00000000`012df9c0 00000000`7746f56d ntdll!EtwTraceMessageVa+0x37b

00000000`012dfcc0 00000000`776a3281 kernel32!BaseThreadInitThunk+0xd

00000000`012dfcf0 00000000`00000000 ntdll!RtlUserThreadStart+0x21
   9  Id: 58c.1394 Suspend: 1 Teb: 000007ff`fffa8000 Unfrozen

Child-SP          RetAddr           Call Site

00000000`0140f498 00000000`7768914b ntdll!ZwWaitForWorkViaWorkerFactory+0xa

00000000`0140f4a0 00000000`7746f56d ntdll!EtwTraceMessageVa+0x37b

00000000`0140f7a0 00000000`776a3281 kernel32!BaseThreadInitThunk+0xd

00000000`0140f7d0 00000000`00000000 ntdll!RtlUserThreadStart+0x21
  10  Id: 58c.1294 Suspend: 1 Teb: 000007ff`fffa6000 Unfrozen

Child-SP          RetAddr           Call Site

00000000`0182f758 00000000`7768914b ntdll!ZwWaitForWorkViaWorkerFactory+0xa

00000000`0182f760 00000000`7746f56d ntdll!EtwTraceMessageVa+0x37b

00000000`0182fa60 00000000`776a3281 kernel32!BaseThreadInitThunk+0xd

00000000`0182fa90 00000000`00000000 ntdll!RtlUserThreadStart+0x21
  11  Id: 58c.a98 Suspend: 1 Teb: 000007ff`fffa4000 Unfrozen

Child-SP          RetAddr           Call Site

00000000`0170f708 00000000`7768914b ntdll!ZwWaitForWorkViaWorkerFactory+0xa

00000000`0170f710 00000000`7746f56d ntdll!EtwTraceMessageVa+0x37b

00000000`0170fa10 00000000`776a3281 kernel32!BaseThreadInitThunk+0xd

00000000`0170fa40 00000000`00000000 ntdll!RtlUserThreadStart+0x21
  12  Id: 58c.121c Suspend: 1 Teb: 000007ff`fffa2000 Unfrozen

Child-SP          RetAddr           Call Site

00000000`0179fd68 000007fe`fd851203 ntdll!NtDelayExecution+0xa

00000000`0179fd70 000007fe`fe2cea00 KERNELBASE!SleepEx+0xb3

00000000`0179fe10 000007fe`fe2d2046 ole32!CROIDTable::WorkerThreadLoop+0x10

00000000`0179fe40 000007fe`fe2d358a ole32!CRpcThread::WorkerLoop+0x1e

00000000`0179fe80 00000000`7746f56d ole32!CRpcThreadCache::RpcWorkerThreadEntry+0x1a

00000000`0179feb0 00000000`776a3281 kernel32!BaseThreadInitThunk+0xd

00000000`0179fee0 00000000`00000000 ntdll!RtlUserThreadStart+0x21
Comments in italics are mine and express my own views, thoughts and opinions
Windows Internals by M. Russinovich, D. Solomon and A. Ionescu:
I/O Completion Ports (pp. 592 - 598) - my own architectural investigation from a complete memory dump perspective: http://www.dumpanalysis.org/blog/index.php/2007/11/27/understanding-io-completion-ports/
Lock contention (p. 594) - some patterns: http://www.dumpanalysis.org/blog/index.php/2010/09/21/contention-patterns/
Concurrency value may exceed concurrently limit for I/O CP (p. 595)
KeRemoveQueueEx (p. 596) - see also Passive System Thread pattern: http://www.dumpanalysis.org/blog/index.php/2007/11/20/crash-dump-analysis-patterns-part-31a/
I/O priority queues and strategies for IRP (p. 599) - priority fields in _EPROCESS and _ETHREAD structures from x64 W2K8 R2:
1: kd> dt _EPROCESS

ntdll!_EPROCESS

+0x000 Pcb              : _KPROCESS

[...]

+0x438 DefaultIoPriority : Pos 27, 3 Bits

[...]
1: kd> dt _ETHREAD

ntdll!_ETHREAD

+0x000 Tcb              : _KTHREAD

[...]

+0x448 ThreadIoPriority : Pos 10, 3 Bits

[...]
Driver Verifier (pp. 604 - 606) - see also Instrumentation Information pattern: http://www.dumpanalysis.org/blog/index.php/2010/09/27/crash-dump-analysis-patterns-part-107/
WDF book (p. 607) - there is also another book coming soon: http://www.dumpanalysis.org/blog/index.php/2010/08/19/windows-7-device-driver-book/
Listing KMDF drivers (p. 608) - here’s the output from x64 W2K8 R2 system:
1: kd> !wdfkd.wdfldr

LoadedModuleList      0xfffff8800115a2d8

----------------------------------

LIBRARY_MODULE  fffffa8003bc8d10

Version       v1.9 build(7600)

Service       \Registry\Machine\System\CurrentControlSet\Services\Wdf01000

ImageName     Wdf01000.sys

ImageAddress  0xfffff880010ae000

ImageSize     0xa4000

Associated Clients: 10
  ImageName      Version    WdfGlobals         FxGlobals          ImageAddress       ImageSize

peauth.sys     v1.7(6001) 0xfffffa8004bf6510 0xfffffa8004bf63c0 0xfffff88004600000 0x000a6000

monitor.sys    v1.9(7600) 0xfffffa80048f55d0 0xfffffa80048f5480 0xfffff88003752000 0x0000e000

umbus.sys      v1.9(7600) 0xfffffa8004371160 0xfffffa8004371010 0xfffff88002db0000 0x00012000

CompositeBus.sys v1.9(7600) 0xfffffa8004440800 0xfffffa80044406b0 0xfffff88002a45000 0x00010000

HDAudBus.sys   v1.7(6001) 0xfffffa80043c9160 0xfffffa80043c9010 0xfffff88002b48000 0x00024000

intelppm.sys   v1.9(7600) 0xfffffa8004271dd0 0xfffffa8004271c80 0xfffff88002ab0000 0x00016000

cdrom.sys      v1.9(7600) 0xfffffa80041f3fc0 0xfffffa80041f3e70 0xfffff88001400000 0x0002a000

vmstorfl.sys   v1.5(6000) 0xfffffa80040129e0 0xfffffa8004012890 0xfffff88001750000 0x00010000

msisadrv.sys   v1.9(7600) 0xfffffa8003ebb910 0xfffffa8003ebb7c0 0xfffff880012c6000 0x0000a000

vdrvroot.sys   v1.9(7600) 0xfffffa8003d3fa00 0xfffffa8003d3f8b0 0xfffff88001262000 0x0000d000

----------------------------------

Total: 1 library loaded
Extension of device extension extension into object context in KMDF (pp. 611 - 612)
UMDF reflectors (p. 617)
WUDFHost.exe (p. 618) - here’s its stack trace collection from x64 W2K8 R2 after I inserted an USB flash drive and attached WinDbg non-invasilvely:
0:000> ~*k
.  0  Id: 58c.12f4 Suspend: 1 Teb: 000007ff`fffde000 Unfrozen

Child-SP          RetAddr           Call Site

00000000`0018f988 000007fe`fd8510ac ntdll!ZwWaitForSingleObject+0xa

00000000`0018f990 00000000`ff3bba44 KERNELBASE!WaitForSingleObjectEx+0x9c

00000000`0018fa30 00000000`ff3b8ce7 WUDFHost!CLpcNotification::Run+0x1c

00000000`0018fa60 00000000`ff3d2cb1 WUDFHost!wmain+0xc7b

00000000`0018fc60 00000000`7746f56d WUDFHost!ConvertStringSidToSidW+0x19b

00000000`0018fca0 00000000`776a3281 kernel32!BaseThreadInitThunk+0xd

00000000`0018fcd0 00000000`00000000 ntdll!RtlUserThreadStart+0x21
   1  Id: 58c.1304 Suspend: 1 Teb: 000007ff`fffdc000 Unfrozen

Child-SP          RetAddr           Call Site

00000000`00c4f918 000007fe`fd8753d6 ntdll!NtDeviceIoControlFile+0xa

00000000`00c4f920 00000000`7746610f KERNELBASE!WaitNamedPipeW+0x16c6

00000000`00c4f990 000007fe`fb87dd94 kernel32!DeviceIoControlImplementation+0x7f

00000000`00c4f9e0 000007fe`fb87e6cd WUDFPlatform!WPP_SF_ssd+0x1e4

00000000`00c4fa70 000007fe`fb87b8af WUDFPlatform!WdfLpcCorePortInterface::GetMessageW+0x119

00000000`00c4fc20 00000000`ff3bd7de WUDFPlatform!WdfWorkerThread::WorkerThread+0x127

00000000`00c4fc70 00000000`7746f56d WUDFHost!LpcWorkerThreadThunk+0x62

00000000`00c4fca0 00000000`776a3281 kernel32!BaseThreadInitThunk+0xd

00000000`00c4fcd0 00000000`00000000 ntdll!RtlUserThreadStart+0x21
   2  Id: 58c.6e8 Suspend: 1 Teb: 000007ff`fffda000 Unfrozen

Child-SP          RetAddr           Call Site

00000000`00dfe988 000007fe`fd853ef8 ntdll!NtQueryAttributesFile+0xa

00000000`00dfe990 000007fe`f3be9970 KERNELBASE!GetFileAttributesW+0x78

00000000`00dfea30 000007fe`f27ce8c9 WpdFs!COperationGetFastBasicProperties::OnImpersonate+0x1c0

00000000`00dfea70 000007fe`f3be9734 WUDFx!CWdfIoRequest::Impersonate+0x151

00000000`00dfeae0 000007fe`f3bda26b WpdFs!COperationGetFastBasicProperties::Invoke+0x2c4

00000000`00dfeb50 000007fe`f3bd8837 WpdFs!WpdObjectProperties::GetValues+0x3f7

00000000`00dfecd0 000007fe`f3bd8344 WpdFs!WpdObjectProperties::OnGetValues+0x10b

00000000`00dfed50 000007fe`f3bcf974 WpdFs!WpdObjectProperties::DispatchWpdMessage+0x1a0

00000000`00dfee10 000007fe`f3bcd51a WpdFs!WpdBaseDriver::DispatchWpdMessage+0x4c0

00000000`00dfef60 000007fe`f3bcdd6c WpdFs!CQueue::ProcessWpdMessage+0x29a

00000000`00dff010 000007fe`f27bf610 WpdFs!CQueue::OnDeviceIoControl+0x494

00000000`00dff160 000007fe`f27c0b5a WUDFx!CWdfIoQueue::SubmitRequest+0x358

00000000`00dff1f0 000007fe`f27c0955 WUDFx!CWdfIoQueue::DispatchRequestToDriver+0x86

00000000`00dff240 000007fe`f27bff83 WUDFx!CWdfIoQueue::DispatchEvents+0x3cd

00000000`00dff2b0 000007fe`f27b61b5 WUDFx!CWdfIoQueue::QueueRequest+0x2c3

00000000`00dff300 000007fe`f27b6f20 WUDFx!CWdfDevice::DispatchRequest+0x149

00000000`00dff350 00000000`ff3ccbb6 WUDFx!CWdfDevice::DeviceControl+0x1a8

00000000`00dff3c0 00000000`ff3c2f92 WUDFHost!CWudfIoIrp::Dispatch+0x13e

00000000`00dff420 00000000`ff3bad47 WUDFHost!CWudfDeviceStack::Forward+0x41a

00000000`00dff490 000007fe`fb87da6a WUDFHost!CLpcNotification::Message+0xd9b

00000000`00dff6c0 000007fe`fb87c848 WUDFPlatform!WdfLpcPort::ProcessMessage+0x3be

00000000`00dff760 000007fe`fb87b299 WUDFPlatform!WdfLpcCommPort::ProcessMessage+0x214

00000000`00dff7b0 000007fe`fb87b900 WUDFPlatform!WdfLpcConnPort::ProcessMessage+0xf9

00000000`00dff830 00000000`ff3bd7de WUDFPlatform!WdfWorkerThread::WorkerThread+0x178

00000000`00dff880 00000000`7746f56d WUDFHost!LpcWorkerThreadThunk+0x62

00000000`00dff8b0 00000000`776a3281 kernel32!BaseThreadInitThunk+0xd

00000000`00dff8e0 00000000`00000000 ntdll!RtlUserThreadStart+0x21
   3  Id: 58c.2e4 Suspend: 1 Teb: 000007ff`fffd8000 Unfrozen

Child-SP          RetAddr           Call Site

00000000`00d7f5e8 000007fe`fd8753d6 ntdll!NtDeviceIoControlFile+0xa

00000000`00d7f5f0 00000000`7746610f KERNELBASE!WaitNamedPipeW+0x16c6

00000000`00d7f660 000007fe`fb87dd94 kernel32!DeviceIoControlImplementation+0x7f

00000000`00d7f6b0 000007fe`fb87e6cd WUDFPlatform!WPP_SF_ssd+0x1e4

00000000`00d7f740 000007fe`fb87b8af WUDFPlatform!WdfLpcCorePortInterface::GetMessageW+0x119

00000000`00d7f8f0 00000000`ff3bd7de WUDFPlatform!WdfWorkerThread::WorkerThread+0x127

00000000`00d7f940 00000000`7746f56d WUDFHost!LpcWorkerThreadThunk+0x62

00000000`00d7f970 00000000`776a3281 kernel32!BaseThreadInitThunk+0xd

00000000`00d7f9a0 00000000`00000000 ntdll!RtlUserThreadStart+0x21
   4  Id: 58c.12b4 Suspend: 1 Teb: 000007ff`fffd6000 Unfrozen

Child-SP          RetAddr           Call Site

00000000`00f8fa58 000007fe`fd8753d6 ntdll!NtDeviceIoControlFile+0xa

00000000`00f8fa60 00000000`7746610f KERNELBASE!WaitNamedPipeW+0x16c6

00000000`00f8fad0 000007fe`fb87dd94 kernel32!DeviceIoControlImplementation+0x7f

00000000`00f8fb20 000007fe`fb87e6cd WUDFPlatform!WPP_SF_ssd+0x1e4

00000000`00f8fbb0 000007fe`fb87b8af WUDFPlatform!WdfLpcCorePortInterface::GetMessageW+0x119

00000000`00f8fd60 00000000`ff3bd7de WUDFPlatform!WdfWorkerThread::WorkerThread+0x127

00000000`00f8fdb0 00000000`7746f56d WUDFHost!LpcWorkerThreadThunk+0x62

00000000`00f8fde0 00000000`776a3281 kernel32!BaseThreadInitThunk+0xd

00000000`00f8fe10 00000000`00000000 ntdll!RtlUserThreadStart+0x21
   5  Id: 58c.106c Suspend: 1 Teb: 000007ff`fffd3000 Unfrozen

Child-SP          RetAddr           Call Site

00000000`00f0f958 000007fe`fd8753d6 ntdll!NtDeviceIoControlFile+0xa

00000000`00f0f960 00000000`7746610f KERNELBASE!WaitNamedPipeW+0x16c6

00000000`00f0f9d0 000007fe`fb87dd94 kernel32!DeviceIoControlImplementation+0x7f

00000000`00f0fa20 000007fe`fb87e6cd WUDFPlatform!WPP_SF_ssd+0x1e4

00000000`00f0fab0 000007fe`fb87b8af WUDFPlatform!WdfLpcCorePortInterface::GetMessageW+0x119

00000000`00f0fc60 00000000`ff3bd7de WUDFPlatform!WdfWorkerThread::WorkerThread+0x127

00000000`00f0fcb0 00000000`7746f56d WUDFHost!LpcWorkerThreadThunk+0x62

00000000`00f0fce0 00000000`776a3281 kernel32!BaseThreadInitThunk+0xd

00000000`00f0fd10 00000000`00000000 ntdll!RtlUserThreadStart+0x21
   6  Id: 58c.8fc Suspend: 1 Teb: 000007ff`fffae000 Unfrozen

Child-SP          RetAddr           Call Site

00000000`0136f8c8 00000000`7758c95e USER32!NtUserGetMessage+0xa

00000000`0136f8d0 000007fe`f3bd26e5 USER32!GetMessageW+0x34

00000000`0136f900 00000000`7746f56d WpdFs!CDiskNotifier::NotificationThreadWorker+0x245

00000000`0136fa50 00000000`776a3281 kernel32!BaseThreadInitThunk+0xd

00000000`0136fa80 00000000`00000000 ntdll!RtlUserThreadStart+0x21
   7  Id: 58c.520 Suspend: 1 Teb: 000007ff`fffac000 Unfrozen

Child-SP          RetAddr           Call Site

00000000`0152f6f8 00000000`77689bd7 ntdll!ZwWaitForMultipleObjects+0xa

00000000`0152f700 00000000`7746f56d ntdll!EtwTraceMessageVa+0xe07

00000000`0152f9a0 00000000`776a3281 kernel32!BaseThreadInitThunk+0xd

00000000`0152f9d0 00000000`00000000 ntdll!RtlUserThreadStart+0x21
   8  Id: 58c.89c Suspend: 1 Teb: 000007ff`fffaa000 Unfrozen

Child-SP          RetAddr           Call Site

00000000`012df9b8 00000000`7768914b ntdll!ZwWaitForWorkViaWorkerFactory+0xa

00000000`012df9c0 00000000`7746f56d ntdll!EtwTraceMessageVa+0x37b

00000000`012dfcc0 00000000`776a3281 kernel32!BaseThreadInitThunk+0xd

00000000`012dfcf0 00000000`00000000 ntdll!RtlUserThreadStart+0x21
   9  Id: 58c.1394 Suspend: 1 Teb: 000007ff`fffa8000 Unfrozen

Child-SP          RetAddr           Call Site

00000000`0140f498 00000000`7768914b ntdll!ZwWaitForWorkViaWorkerFactory+0xa

00000000`0140f4a0 00000000`7746f56d ntdll!EtwTraceMessageVa+0x37b

00000000`0140f7a0 00000000`776a3281 kernel32!BaseThreadInitThunk+0xd

00000000`0140f7d0 00000000`00000000 ntdll!RtlUserThreadStart+0x21
  10  Id: 58c.1294 Suspend: 1 Teb: 000007ff`fffa6000 Unfrozen

Child-SP          RetAddr           Call Site

00000000`0182f758 00000000`7768914b ntdll!ZwWaitForWorkViaWorkerFactory+0xa

00000000`0182f760 00000000`7746f56d ntdll!EtwTraceMessageVa+0x37b

00000000`0182fa60 00000000`776a3281 kernel32!BaseThreadInitThunk+0xd

00000000`0182fa90 00000000`00000000 ntdll!RtlUserThreadStart+0x21
  11  Id: 58c.a98 Suspend: 1 Teb: 000007ff`fffa4000 Unfrozen

Child-SP          RetAddr           Call Site

00000000`0170f708 00000000`7768914b ntdll!ZwWaitForWorkViaWorkerFactory+0xa

00000000`0170f710 00000000`7746f56d ntdll!EtwTraceMessageVa+0x37b

00000000`0170fa10 00000000`776a3281 kernel32!BaseThreadInitThunk+0xd

00000000`0170fa40 00000000`00000000 ntdll!RtlUserThreadStart+0x21
  12  Id: 58c.121c Suspend: 1 Teb: 000007ff`fffa2000 Unfrozen

Child-SP          RetAddr           Call Site

00000000`0179fd68 000007fe`fd851203 ntdll!NtDelayExecution+0xa

00000000`0179fd70 000007fe`fe2cea00 KERNELBASE!SleepEx+0xb3

00000000`0179fe10 000007fe`fe2d2046 ole32!CROIDTable::WorkerThreadLoop+0x10

00000000`0179fe40 000007fe`fe2d358a ole32!CRpcThread::WorkerLoop+0x1e

00000000`0179fe80 00000000`7746f56d ole32!CRpcThreadCache::RpcWorkerThreadEntry+0x1a

00000000`0179feb0 00000000`776a3281 kernel32!BaseThreadInitThunk+0xd

00000000`0179fee0 00000000`00000000 ntdll!RtlUserThreadStart+0x21
Today we introduce an icon for Dispatch Level Spin pattern:
B/W

Color

- Dmitry Vostokov @ DumpAnalysis.org + TraceAnalysis.org -
Who’s your BOSS (Basic Operating Support System)?
I report to Memory……………………………………………………….
- Dmitry Vostokov @ DumpAnalysis.org + TraceAnalysis.org -
You are probably aware of Application and Driver Verifiers (including gflags.exe tool from Debugging Tools for Windows). These tools set flags that modify the behaviour of the system that is reflected in additional information being collected such as memory allocation history and in WinDbg output changes such as stack traces. These tools belong to a broad class of instrumentation tools and I call the analysis pattern Instrumentation Information. To check in a minidump, kernel and complete memory dumps whether Driver Verifier was enabled we use !verifier WinDbg command:
1: kd> !verifier
Verify Level 0 ... enabled options are:
Summary of All Verifier Statistics
RaiseIrqls                             0x0

AcquireSpinLocks                       0x0

Synch Executions                       0x0

Trims                                  0x0
Pool Allocations Attempted             0x0

Pool Allocations Succeeded             0x0

Pool Allocations Succeeded SpecialPool 0x0

Pool Allocations With NO TAG           0x0

Pool Allocations Failed                0x0

Resource Allocations Failed Deliberately   0x0
Current paged pool allocations         0x0 for 00000000 bytes

Peak paged pool allocations            0x0 for 00000000 bytes

Current nonpaged pool allocations      0x0 for 00000000 bytes

Peak nonpaged pool allocations         0x0 for 00000000 bytes
0: kd> !verifier
Verify Level 3 ... enabled options are:

       Special pool

       Special irql
Summary of All Verifier Statistics
RaiseIrqls                             0xdea5

AcquireSpinLocks                       0x87b5c

Synch Executions                       0x17b5

Trims                                  0xab36
Pool Allocations Attempted             0x8990e

Pool Allocations Succeeded             0x8990e

Pool Allocations Succeeded SpecialPool 0x29c0

Pool Allocations With NO TAG           0x1

Pool Allocations Failed                0x0

Resource Allocations Failed Deliberately   0x0
Current paged pool allocations         0x0 for 00000000 bytes

Peak paged pool allocations            0x0 for 00000000 bytes

Current nonpaged pool allocations      0x0 for 00000000 bytes

Peak nonpaged pool allocations         0x0 for 00000000 bytes
To check in a process user dump that Application Verifier (and gflags) was enabled use !avrf and !gflags WinDbg extension commands:
0:001> !avrf

Application verifier is not enabled for this process.

Page heap has been enabled separately.
0:001> !gflag

Current NtGlobalFlag contents: 0x02000000

    hpa - Place heap allocations at ends of pages
Here is an example of an instrumented stack trace:
68546e88 verifier!AVrfpDphFindBusyMemoryNoCheck+0xb8

68546f95 verifier!AVrfpDphFindBusyMemory+0×15

68547240 verifier!AVrfpDphFindBusyMemoryAndRemoveFromBusyList+0×20

68549080 verifier!AVrfDebugPageHeapFree+0×90

77190aac ntdll!RtlDebugFreeHeap+0×2f

7714a8ff ntdll!RtlpFreeHeap+0×5d

770f2a32 ntdll!RtlFreeHeap+0×142

75fb14d1 kernel32!HeapFree+0×14

748d4c39 msvcr80!free+0xcd

[…]

00a02bb2 ServiceA!ServiceMain+0×302

767175a8 sechost!ScSvcctrlThreadA+0×21

75fb3677 kernel32!BaseThreadInitThunk+0xe

770f9d42 ntdll!__RtlUserThreadStart+0×70

770f9d15 ntdll!_RtlUserThreadStart+0×1b
Another example that shows instrumentation difference. We run double free fault modeling application and see its stack trace from a crash dump:
0:000> !gflag

Current NtGlobalFlag contents: 0x00000000
0:000> kL 100

Child-SP          RetAddr           Call Site

00000000`002dec38 00000000`77735ce2 ntdll!NtWaitForSingleObject+0xa

00000000`002dec40 00000000`77735e85 ntdll!RtlReportExceptionEx+0x1d2

00000000`002ded30 00000000`77735eea ntdll!RtlReportException+0xb5

00000000`002dedb0 00000000`77736d25 ntdll!RtlpTerminateFailureFilter+0x1a

00000000`002dede0 00000000`77685148 ntdll!RtlReportCriticalFailure+0x96

00000000`002dee10 00000000`776a554d ntdll!_C_specific_handler+0x8c

00000000`002dee80 00000000`77685d1c ntdll!RtlpExecuteHandlerForException+0xd

00000000`002deeb0 00000000`776862ee ntdll!RtlDispatchException+0x3cb

00000000`002df590 00000000`77736cd2 ntdll!RtlRaiseException+0x221

00000000`002dfbd0 00000000`77737396 ntdll!RtlReportCriticalFailure+0x62

00000000`002dfca0 00000000`777386c2 ntdll!RtlpReportHeapFailure+0x26

00000000`002dfcd0 00000000`7773a0c4 ntdll!RtlpHeapHandleError+0x12

00000000`002dfd00 00000000`776dd1cd ntdll!RtlpLogHeapFailure+0xa4

00000000`002dfd30 00000000`77472c7a ntdll! ?? ::FNODOBFM::`string'+0x123b4

00000000`002dfdb0 00000000`6243c7bc kernel32!HeapFree+0xa

00000000`002dfde0 00000001`3f8f1033 msvcr90!free+0x1c

00000000`002dfe10 00000001`3f8f11f2 InstrumentedApp!wmain+0x33

00000000`002dfe50 00000000`7746f56d InstrumentedApp!__tmainCRTStartup+0x11a

00000000`002dfe80 00000000`776a3281 kernel32!BaseThreadInitThunk+0xd

00000000`002dfeb0 00000000`00000000 ntdll!RtlUserThreadStart+0x1d
Then we enable Application Verifier and full page heap in gflags.exe GUI. Actually 2 crash dumps are saved at the same time (we’d set up LocalDumps registry key on x64 W2K8 R2) with slightly different stack traces:
0:000> !gflag

Current NtGlobalFlag contents: 0x02000100

    vrf - Enable application verifier

    hpa - Place heap allocations at ends of pages
0:000> kL 100

Child-SP          RetAddr           Call Site

00000000`0022e438 00000000`77735ce2 ntdll!NtWaitForSingleObject+0xa

00000000`0022e440 00000000`77735e85 ntdll!RtlReportExceptionEx+0x1d2

00000000`0022e530 000007fe`f3ed26fb ntdll!RtlReportException+0xb5

00000000`0022e5b0 00000000`77688a8f verifier!AVrfpVectoredExceptionHandler+0×26b

00000000`0022e640 00000000`776859b2 ntdll!RtlpCallVectoredHandlers+0xa8

00000000`0022e6b0 00000000`776bfe48 ntdll!RtlDispatchException+0×22

00000000`0022ed90 000007fe`f3eca668 ntdll!KiUserExceptionDispatcher+0×2e

00000000`0022f350 000007fe`f3ec931d verifier!VerifierStopMessage+0×1f0

00000000`0022f400 000007fe`f3ec9736 verifier!AVrfpDphReportCorruptedBlock+0×155

00000000`0022f4c0 000007fe`f3ec99cd verifier!AVrfpDphCheckNormalHeapBlock+0xce

00000000`0022f530 000007fe`f3ec873a verifier!AVrfpDphNormalHeapFree+0×29

00000000`0022f560 00000000`7773c415 verifier!AVrfDebugPageHeapFree+0xb6

00000000`0022f5c0 00000000`776dd0fe ntdll!RtlDebugFreeHeap+0×35

00000000`0022f620 00000000`776c2075 ntdll! ?? ::FNODOBFM::`string’+0×122e2

00000000`0022f960 000007fe`f3edf4e1 ntdll!RtlFreeHeap+0×1a2

00000000`0022f9e0 00000000`77472c7a verifier!AVrfpRtlFreeHeap+0xa5

00000000`0022fa80 000007fe`f3ee09ae kernel32!HeapFree+0xa

00000000`0022fab0 00000000`642bc7bc verifier!AVrfpHeapFree+0xc6

00000000`0022fb40 00000001`3fac1033 msvcr90!free+0×1c

00000000`0022fb70 00000001`3fac11f2 InstrumentedApp!wmain+0×33

00000000`0022fbb0 00000000`7746f56d InstrumentedApp!__tmainCRTStartup+0×11a

00000000`0022fbe0 00000000`776a3281 kernel32!BaseThreadInitThunk+0xd

00000000`0022fc10 00000000`00000000 ntdll!RtlUserThreadStart+0×1d
0:000> kL 100

Child-SP          RetAddr           Call Site

00000000`0022e198 000007fe`f3ee0f82 ntdll!NtWaitForMultipleObjects+0xa

00000000`0022e1a0 000007fe`fd8513a6 verifier!AVrfpNtWaitForMultipleObjects+0×4e

00000000`0022e1e0 000007fe`f3ee0e2d KERNELBASE!WaitForMultipleObjectsEx+0xe8

00000000`0022e2e0 000007fe`f3ee0edd verifier!AVrfpWaitForMultipleObjectsExCommon+0xad

00000000`0022e320 00000000`77473143 verifier!AVrfpKernelbaseWaitForMultipleObjectsEx+0×2d

00000000`0022e370 00000000`774e9025 kernel32!WaitForMultipleObjectsExImplementation+0xb3

00000000`0022e400 00000000`774e91a7 kernel32!WerpReportFaultInternal+0×215

00000000`0022e4a0 00000000`774e91ff kernel32!WerpReportFault+0×77

00000000`0022e4d0 00000000`774e941c kernel32!BasepReportFault+0×1f

00000000`0022e500 00000000`7770573c kernel32!UnhandledExceptionFilter+0×1fc

00000000`0022e5e0 00000000`77685148 ntdll! ?? ::FNODOBFM::`string’+0×2365

00000000`0022e610 00000000`776a554d ntdll!_C_specific_handler+0×8c

00000000`0022e680 00000000`77685d1c ntdll!RtlpExecuteHandlerForException+0xd

00000000`0022e6b0 00000000`776bfe48 ntdll!RtlDispatchException+0×3cb

00000000`0022ed90 000007fe`f3eca668 ntdll!KiUserExceptionDispatcher+0×2e

00000000`0022f350 000007fe`f3ec931d verifier!VerifierStopMessage+0×1f0

00000000`0022f400 000007fe`f3ec9736 verifier!AVrfpDphReportCorruptedBlock+0×155

00000000`0022f4c0 000007fe`f3ec99cd verifier!AVrfpDphCheckNormalHeapBlock+0xce

00000000`0022f530 000007fe`f3ec873a verifier!AVrfpDphNormalHeapFree+0×29

00000000`0022f560 00000000`7773c415 verifier!AVrfDebugPageHeapFree+0xb6

00000000`0022f5c0 00000000`776dd0fe ntdll!RtlDebugFreeHeap+0×35

00000000`0022f620 00000000`776c2075 ntdll! ?? ::FNODOBFM::`string’+0×122e2

00000000`0022f960 000007fe`f3edf4e1 ntdll!RtlFreeHeap+0×1a2

00000000`0022f9e0 00000000`77472c7a verifier!AVrfpRtlFreeHeap+0xa5

00000000`0022fa80 000007fe`f3ee09ae kernel32!HeapFree+0xa

00000000`0022fab0 00000000`642bc7bc verifier!AVrfpHeapFree+0xc6

00000000`0022fb40 00000001`3fac1033 msvcr90!free+0×1c

00000000`0022fb70 00000001`3fac11f2 InstrumentedApp!wmain+0×33

00000000`0022fbb0 00000000`7746f56d InstrumentedApp!__tmainCRTStartup+0×11a

00000000`0022fbe0 00000000`776a3281 kernel32!BaseThreadInitThunk+0xd

00000000`0022fc10 00000000`00000000 ntdll!RtlUserThreadStart+0×1d
We also see above that enabling instrumentation triggers debug functions of runtime heap (RtlDebugFreeHeap).
- Dmitry Vostokov @ DumpAnalysis.org + TraceAnalysis.org -


