Understanding I/O Completion Ports
Many articles and books explain Windows I/O completion ports from high level design considerations arising when building high-performance server software. But it is hard to recall them later when someone asks to explain and not everyone writes that software. Looking at complete memory dumps has an advantage of a bottom-up or reverse engineering approach where we see internals of server software and can immediately grasp the implementation of certain architectural and design decisions.
Consider this thread stack trace we can find almost inside any service or network application process:
THREAD 86cf09c0  Cid 05cc.2030  Teb: 7ffd7000 Win32Thread: 00000000 WAIT: (Unknown) UserMode Non-Alertable

    8a3bb970  QueueObject

    86cf0a38  NotificationTimer

Not impersonating

DeviceMap                 e15af5a8

Owning Process            8a3803d8       Image:         svchost.exe

Wait Start TickCount      2131621        Ticks: 1264 (0:00:00:19.750)

Context Switch Count      6

UserTime                  00:00:00.000

KernelTime                00:00:00.000

Win32 Start Address RPCRT4!ThreadStartRoutine (0×77c5de6d)

Start Address kernel32!BaseThreadStartThunk (0×77e6b5f3)

Stack Init ba276000 Current ba275c38 Base ba276000 Limit ba273000 Call 0

Priority 8 BasePriority 8 PriorityDecrement 0

ChildEBP RetAddr

ba275c50 8083d3b1 nt!KiSwapContext+0×26

ba275c7c 8083dea2 nt!KiSwapThread+0×2e5

ba275cc4 8092b205 nt!KeRemoveQueue+0×417

ba275d48 80833a6f nt!NtRemoveIoCompletion+0xdc

ba275d48 7c82ed54 nt!KiFastCallEntry+0xfc

0093feac 7c821bf4 ntdll!KiFastSystemCallRet

0093feb0 77e66142 ntdll!NtRemoveIoCompletion+0xc

0093fedc 77c604c3 kernel32!GetQueuedCompletionStatus+0×29

0093ff18 77c60655 RPCRT4!COMMON_ProcessCalls+0xa1

0093ff84 77c5f9f1 RPCRT4!LOADABLE_TRANSPORT::ProcessIOEvents+0×117

0093ff8c 77c5f7dd RPCRT4!ProcessIOEventsWrapper+0xd

0093ffac 77c5de88 RPCRT4!BaseCachedThreadRoutine+0×9d

0093ffb8 77e6608b RPCRT4!ThreadStartRoutine+0×1b

0093ffec 00000000 kernel32!BaseThreadStart+0×34
We see that I/O completion port is implemented via kernel queue object so requests (work items, completion notifications, etc) are stored in that queue for further processing by threads. The number of active threads processing requests is bound to some maximum value that usually corresponds to the number of processors:
0: kd> dt _KQUEUE 8a3bb970

ntdll!_KQUEUE

   +0x000 Header           : _DISPATCHER_HEADER

   +0x010 EntryListHead    : _LIST_ENTRY [ 0x8a3bb980 - 0x8a3bb980 ]

   +0x018 CurrentCount     : 0

   +0×01c MaximumCount     : 2

   +0×020 ThreadListHead   : _LIST_ENTRY [ 0×86cf0ac8 - 0×89ff9520 ]
0: kd> !smt

SMT Summary:

------------

   KeActiveProcessors: **------------------------------ (00000003)

        KiIdleSummary: **------------------------------ (00000003)

No PRCB     Set Master SMT Set                                     IAID

 0 ffdff120 Master     **—————————— (00000003)  00

 1 f772f120 ffdff120   **—————————— (00000003)  01
Kernel work queues are also implemented via the same queue object as we might have guessed already:
THREAD 8a777660  Cid 0004.00d0  Teb: 00000000 Win32Thread: 00000000 WAIT: (Unknown) UserMode Non-Alertable

    808b707c  QueueObject

Not impersonating

DeviceMap                 e1000928

Owning Process            8a780818       Image:         System

Wait Start TickCount      2615           Ticks: 2130270 (0:09:14:45.468)

Context Switch Count      301

UserTime                  00:00:00.000

KernelTime                00:00:00.000

Start Address nt!ExpWorkerThread (0×8082d92b)

Stack Init f71e0000 Current f71dfcec Base f71e0000 Limit f71dd000 Call 0

Priority 12 BasePriority 12 PriorityDecrement 0

Kernel stack not resident.

ChildEBP RetAddr

f71dfd04 8083d3b1 nt!KiSwapContext+0×26

f71dfd30 8083dea2 nt!KiSwapThread+0×2e5

f71dfd78 8082d9c1 nt!KeRemoveQueue+0×417

f71dfdac 809208fc nt!ExpWorkerThread+0xc8

f71dfddc 8083fc9f nt!PspSystemThreadStartup+0×2e

00000000 00000000 nt!KiThreadStartup+0×16
0: kd> dt _KQUEUE 808b707c

ntdll!_KQUEUE

   +0x000 Header           : _DISPATCHER_HEADER

   +0x010 EntryListHead    : _LIST_ENTRY [ 0x808b708c - 0x808b708c ]

   +0x018 CurrentCount     : 0

   +0×01c MaximumCount     : 2

   +0×020 ThreadListHead   : _LIST_ENTRY [ 0×8a77a128 - 0×8a777768 ]
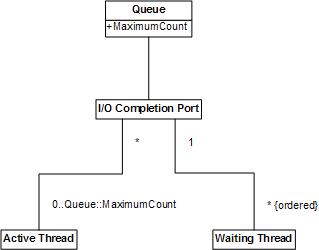
I’ve created the simple UML diagram showing high-level relationship between various objects seen from crash dumps. Note that Active Thread object can process items from more than one completion port if its wait was satisfied for one port and then for another but I have never seen this. Obviously Waiting thread can wait only for one completion port.
- Dmitry Vostokov @ DumpAnalysis.org -
November 27th, 2007 at 9:48 pm
Is “dt _KQUEUE 8a1e7150″ a typo? Shouldn’t the address be 8a3bb970 to match the QueueObject address highlighted in blue?
November 28th, 2007 at 10:18 am
Corrected. Thanks!
September 28th, 2010 at 4:33 pm
[…] I/O Completion Ports (pp. 592 - 598) - my own architectural investigation from a complete memory dump perspective: http://www.dumpanalysis.org/blog/index.php/2007/11/27/understanding-io-completion-ports/ […]
September 28th, 2010 at 4:42 pm
[…] I/O Completion Ports (pp. 592 - 598) - my own architectural investigation from a complete memory dump perspective: http://www.dumpanalysis.org/blog/index.php/2007/11/27/understanding-io-completion-ports/ […]