Trace Analysis Patterns (Part 253)

September 14th, 2025

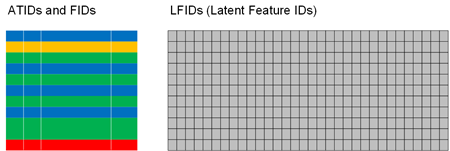
Message Embedding, as a representational technique in ML, are a variant of Trace Field. We can also consider the sequence of Message Embeddings as a trace itself with columns as latent features, forming separate latent Features of Activity. We can also treat these embeddings as sentence embeddings when interpreting traces and logs as Text Traces.

- Dmitry Vostokov @ DumpAnalysis.org + TraceAnalysis.org -
Trace Analysis Patterns (Part 252)

August 4th, 2025

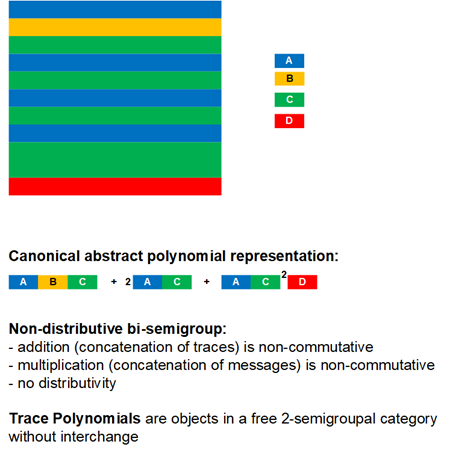
We can view traces and logs as abstract polynomials that consists of abstract monomials. For example, if we have trace messages A,B,C, and D, the trace ABCACACACCD represents a single monomial. The multiplication operation in monomials represents message concatenation. But we can also split the trace as an abstract sum of several monomials, for example, ABC + AC + AC + AC + CD, or ABC + 3*AC + CD. The addition operation is a concatenation of traces even if concatenated traces consist of just one message. Note the distinction here between concatenation of messages and traces. By Trace Polynomial we mean a canonical abstract polynomial representation where we divide the trace by monomial when the next message in the message stream is already contained in the previous monomial, for example, ABC + 2AC + AC^2D.

Both addition and multiplication are non-commutative, and no distributivity between them. Mathematically speaking, we have the so-called a non‑distributive bi‑semigroup, or, in a category-theoretic sense, such abstract polynomials are objects in a free 2‑semigroupal category without interchange.

- Dmitry Vostokov @ DumpAnalysis.org + TraceAnalysis.org -
Collection Patterns

June 8th, 2025

A page to reference all different kinds of collection-related analysis patterns is necessary, so I created this post:

I’ll update it as soon as I add more similar patterns.

- Dmitry Vostokov @ DumpAnalysis.org + TraceAnalysis.org -
Crash Dump Analysis Patterns (Part 299)

June 3rd, 2025

Interrupt Stack Collection is another area to mine for Execution Residue and Rough Stack Traces. Some Interrupt Stacks may be visible in Stack Trace Collections such as from CPUs. In addition to Stack Overflow double fault stack region, we also have debug, NMI, and machine check interrupt stack 6Kb regions:

6: kd> !idt

Dumping IDT: ffffbd014d6b1000

00: fffff806f53ad100 nt!KiDivideErrorFaultShadow
01: fffff806f53ad180 nt!KiDebugTrapOrFaultShadow Stack = 0xFFFFBD014D6B59D0
02: fffff806f53ad240 nt!KiNmiInterruptShadow Stack = 0xFFFFBD014D6B57D0
03: fffff806f53ad2c0 nt!KiBreakpointTrapShadow
04: fffff806f53ad340 nt!KiOverflowTrapShadow
05: fffff806f53ad3c0 nt!KiBoundFaultShadow
06: fffff806f53ad440 nt!KiInvalidOpcodeFaultShadow
07: fffff806f53ad4c0 nt!KiNpxNotAvailableFaultShadow
08: fffff806f53ad540 nt!KiDoubleFaultAbortShadow Stack = 0xFFFFBD014D6B53D0
09: fffff806f53ad5c0 nt!KiNpxSegmentOverrunAbortShadow
0a: fffff806f53ad640 nt!KiInvalidTssFaultShadow
0b: fffff806f53ad6c0 nt!KiSegmentNotPresentFaultShadow
0c: fffff806f53ad740 nt!KiStackFaultShadow
0d: fffff806f53ad7c0 nt!KiGeneralProtectionFaultShadow
0e: fffff806f53ad840 nt!KiPageFaultShadow
10: fffff806f53ad8c0 nt!KiFloatingErrorFaultShadow
11: fffff806f53ad940 nt!KiAlignmentFaultShadow
12: fffff806f53ad9c0 nt!KiMcheckAbortShadow Stack = 0xFFFFBD014D6B55D0
13: fffff806f53adac0 nt!KiXmmExceptionShadow
[…]

These stacks are different for each CPU. It is also possible to get these stack bases from TSS:

6: kd> ~0s

0: kd> !pcr
KPCR for Processor 0 at fffff80680079000:
Major 1 Minor 1
NtTib.ExceptionList: fffff8068743efb0
NtTib.StackBase: fffff8068743d000
NtTib.StackLimit: 0000000000000000
NtTib.SubSystemTib: fffff80680079000
NtTib.Version: 0000000080079180
NtTib.UserPointer: fffff80680079870
NtTib.SelfTib: 00000060414a8000

SelfPcr: 0000000000000000
Prcb: fffff80680079180
Irql: 0000000000000000
IRR: 0000000000000000
IDR: 0000000000000000
InterruptMode: 0000000000000000
IDT: 0000000000000000
GDT: 0000000000000000
TSS: 0000000000000000

CurrentThread: ffffa80b0c8240c0
NextThread: 0000000000000000
IdleThread: fffff806f57d0640

DpcQueue:

0: kd> dt nt!_KPCR fffff80680079000
nt!_KPCR
+0×000 NtTib : _NT_TIB
+0×000 GdtBase : 0xfffff806`8743efb0 _KGDTENTRY64
+0×008 TssBase : 0xfffff806`8743d000 _KTSS64
+0×010 UserRsp : 0
+0×018 Self : 0xfffff806`80079000 _KPCR
+0×020 CurrentPrcb : 0xfffff806`80079180 _KPRCB
+0×028 LockArray : 0xfffff806`80079870 _KSPIN_LOCK_QUEUE
+0×030 Used_Self : 0×00000060`414a8000 Void
+0×038 IdtBase : 0xfffff806`8743c000 _KIDTENTRY64
+0×040 Unused : [2] 0
+0×050 Irql : 0 ”
+0×051 SecondLevelCacheAssociativity : 0×10 ”
+0×052 ObsoleteNumber : 0 ”
+0×053 Fill0 : 0 ”
+0×054 Unused0 : [3] 0
+0×060 MajorVersion : 1
+0×062 MinorVersion : 1
+0×064 StallScaleFactor : 0×840
+0×068 Unused1 : [3] (null)
+0×080 KernelReserved : [15] 0
+0×0bc SecondLevelCacheSize : 0×800000
+0×0c0 HalReserved : [16] 0×7de29000
+0×100 Unused2 : 0
+0×108 KdVersionBlock : (null)
+0×110 Unused3 : (null)
+0×118 PcrAlign1 : [24] 0

0: kd> dt nt!_KTSS64 0xfffff806`8743d000
nt!_KTSS64
+0×000 Reserved0 : 0
+0×004 Rsp0 : 0xfffff806`87440200
+0×00c Rsp1 : 0
+0×014 Rsp2 : 0
+0×01c Ist : [8] 0
+0×05c Reserved1 : 0
+0×064 Reserved2 : 0
+0×066 IoMapBase : 0×68

0: kd> dps 0xfffff806`8743d000+1c L8
fffff806`8743d01c 00000000`00000000
fffff806`8743d024 fffff806`874403d0
fffff806`8743d02c fffff806`874405d0
fffff806`8743d034 fffff806`874407d0
fffff806`8743d03c fffff806`874409d0
fffff806`8743d044 00000000`00000000
fffff806`8743d04c 00000000`00000000
fffff806`8743d054 00000000`00000000

0: kd> !idt 2

Dumping IDT: fffff8068743c000

02: fffff806f53ad240 nt!KiNmiInterruptShadow Stack = 0xFFFFF806874407D0

These stack base values may be transition stack values. In such a case, a redirection is required:

0: kd> dps fffff806`874407d0 L4
fffff806`874407d0 fffff806`80079000
fffff806`874407d8 fffff806`87471fe0
fffff806`874407e0 fffff806`80079000
fffff806`874407e8 00000004`237bf002

0: kd> dpS fffff806`87471fe0+20-6000 L6000/8
fffff806`f4dcd566 nt!KiSaveProcessorState+0xb6
fffff806`f4dc588a nt!KiFreezeTargetExecution+0×1ba
fffff806`f4db72ea nt!KiCheckForFreezeExecution+0×2a
fffff806`f4dbb242 nt!KiProcessNMI+0×52
fffff806`f4eb0fc2 nt!KxNmiInterrupt+0×82
fffff806`f4dcd124 nt!KiMcheckFastForward+0×64

- Dmitry Vostokov @ DumpAnalysis.org + TraceAnalysis.org -
Trace Analysis Patterns (Part 251)

March 28th, 2025

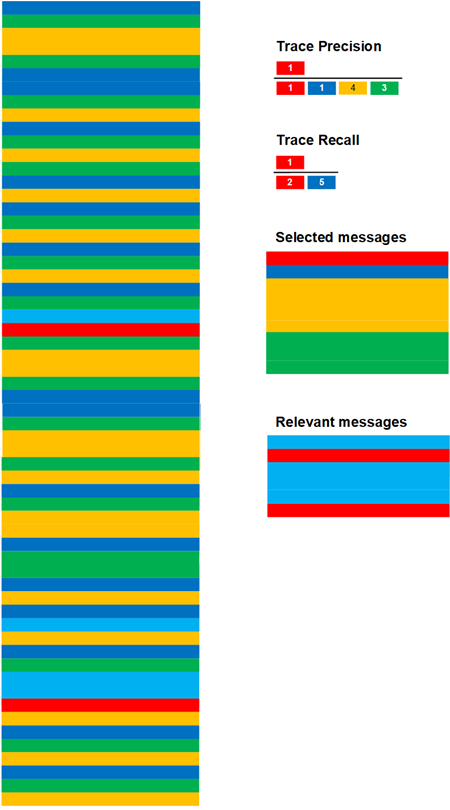
Trace Precision and Recall analysis patterns are borrowed from information retrieval and machine learning. In essence, Trace Precision is the fraction of trace messages used for successful diagnostics among all selected trace messages, for example, among CoTrace messages to reduce the noise. Trace Recall is the fraction of trace messages used for successful diagnostics among all relevant messages (these can also be messages not included in the trace, see Trace Bias).

- Dmitry Vostokov @ DumpAnalysis.org + TraceAnalysis.org -
Trace Analysis Patterns (Part 250)

March 18th, 2025

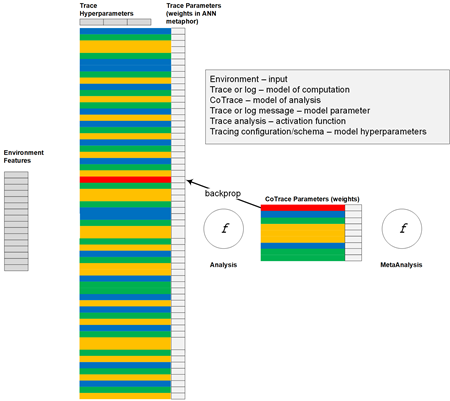
Traces and logs can be considered models of computation as was first proposed in Trace Bias analysis pattern. Borrowing metaphors from machine learning we can consider trace messages as Trace Parameters having associated values, for example, through Trace Field. These values can be numerical weights or linguistic values, for example, as proposed by Zadeh. Message values can be field values themselves, for example, Counter Values. As was noted in Trace Variance, different tracing environments with their set of “features” can be considered input data. if we use an artificial neural network metaphor, trace analysis itself can be considered as an activation function. CoTraces, as models of trace analysis, may form other “hidden” layers with “backpropagation” updating message weights. Tracing configuration parameters including Trace Schemas can be considered as Trace Hyperparameters. These concepts can be roughly illustrated by the following diagram:

To reduce the number of Trace Parameters we can use Quotient Traces.

- Dmitry Vostokov @ DumpAnalysis.org + TraceAnalysis.org -
Trace Analysis Patterns (Part 249)

March 16th, 2025

In some cases, when we have two trace messages we can infer the missing Implicit Message. This trace augmentation may help when we Sparse Traces and we want to train ML models on them. To illustrate, we asked ChatGPT:

We have a log file with two messages: 1. Reading file test.txt 2. Access denied. There is an implicit message in between.

The implicit message between the two log entries is:

“Attempting to open file ‘test.txt’.”

Reasoning:

  1. “Reading file test.txt” → This suggests that the system or user has issued a command to read the file.
  2. Implicit step (not logged explicitly) → The system attempts to open the file to read its contents.
  3. “Access denied.” → The attempt fails due to permission restrictions or security policies.

Thus, the missing step is the system trying to open or access the file, which leads to the access denial.

Implicit Messages are different from Silent Messages which are padding messages to occupy the minimum resolution gaps.

- Dmitry Vostokov @ DumpAnalysis.org + TraceAnalysis.org -
Trace Analysis Patterns (Part 248)

December 12th, 2024

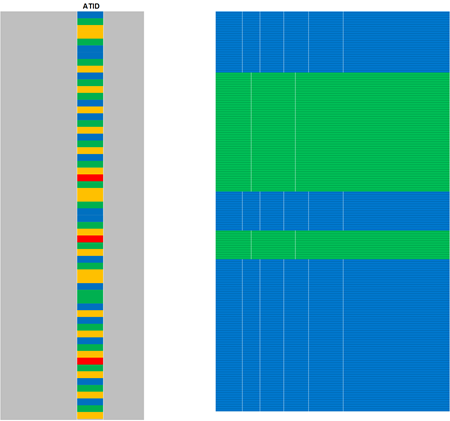
The fact that messages have types is mentioned in some trace and log analysis patterns but have never had its own analysis pattern. Trace and log messages may have the same Message Type if they have the same Adjoint Thread of Activity ATID (or Message Metadata) value, for example, “Warning”. Or they may have the same structure, for example, the same constants or message invariants, or belong to the same Trace Schema in Container Traces.

- Dmitry Vostokov @ DumpAnalysis.org + TraceAnalysis.org -
Crash Dump Analysis Patterns (Part 298)

September 14th, 2024

Terminated threads are not listed in unmanaged space Stack Trace Collections. In kernel space, we may notice them if we expect N kernel threads but see less like Missing Threads in user space. If we see less kernel threads in a process context then, definitely, user space counterparts to Dual Stack Traces are missing (but we may still recover Hidden Stacks). Sometimes, using appropriate extensions, like SwishDbgExt, we can see terminated threads based on exit time:

0: kd> !ms_process /pid 0x250 /threads
[...]
| 0x0250 | 0x02a0 | 0x00007FFC858FE680 | winsrvext!TerminalServerRequestThread | 13/11/2021 22:14:28 | 00/00/ 0 00:00:00 |
| 0×0250 | 0×02a4 | 0×00007FFC858F2710 | winsrvext!GdiAddInitialFontsThread | 13/11/2021 22:14:28 | 13/11/2021 22:14:29 |
| 0×0250 | 0×02a8 | 0×00007FFC858F3430 | winsrvext!NotificationThread | 13/11/2021 22:14:28 | 00/00/ 0 00:00:00 |
[…]

If we get thread ids from some Paratext, we can directly check if the thread is terminated or not:

0: kd> !thread -t 2a4 3f
THREAD ffffc38c3040e080 Cid 0250.02a4 Teb: 0000000000000000 Win32Thread: 0000000000000000 TERMINATED
Not impersonating
DeviceMap ffffac8a0423d290
Owning Process ffffc38c30880140 Image: csrss.exe
Attached Process N/A Image: N/A
Wait Start TickCount 1282 Ticks: 10674 (0:00:02:46.781)
Context Switch Count 1192 IdealProcessor: 0
UserTime 00:00:00.000
KernelTime 00:00:00.078
Win32 Start Address winsrvext!GdiAddInitialFontsThread (0×00007ffc858f2710)
Stack Init 0000000000000000 Current ffffbe8295331670
Base ffffbe8295332000 Limit ffffbe829532c000 Call 0000000000000000
Priority 14 BasePriority 13 IoPriority 2 PagePriority 5
Child-SP RetAddr Call Site
ffffbe82`953316b0 fffffc57`1e5ba085 0×4
ffffbe82`953316b8 fffff806`6255f501 0xfffffc57`1e5ba085
ffffbe82`953316c0 000002ac`02048e80 nt!PspThreadFromTicket+0×51
ffffbe82`953316f0 ffffffff`ffffffff 0×000002ac`02048e80
ffffbe82`953316f8 ffffbe82`95331b60 0xffffffff`ffffffff
ffffbe82`95331700 ffffbe82`953319a0 0xffffbe82`95331b60
ffffbe82`95331708 fffff806`62136778 0xffffbe82`953319a0
ffffbe82`95331710 fffff806`62138fdc nt!IoRemoveIoCompletion+0×98
ffffbe82`95331830 fffff806`62227b75 nt!NtWaitForWorkViaWorkerFactory+0×39c
ffffbe82`95331a70 00000000`00000000 nt!KiSystemServiceCopyEnd+0×25

Please note that in case of Incorrect Stack Trace we can get Rough Stack Trace or try to reconstruct the one manually from Execution Residue:

0: kd> dpS ffffbe829532c000 ffffbe8295332000
fffff806`6210aeb4 nt!MiGetPerfectColorHeadPage+0×94
fffff806`624e9fa2 nt!PspGetContext+0×2e2
fffff806`62a54e00 nt!MiSystemPartition
fffff806`624e9aba nt!PspGetSetContextInternal+0×3aa
fffff806`621090b1 nt!MiAddWorkingSetEntries+0×451
fffff806`62108965 nt!MiAllocateWsle+0×295
fffff806`62a54e00 nt!MiSystemPartition
fffff806`62107eac nt!MiCompletePrivateZeroFault+0×77c
fffff806`62a54e00 nt!MiSystemPartition
fffff806`62107315 nt!MiResolvePrivateZeroFault+0×1a5
fffff806`62105c28 nt!MiResolveDemandZeroFault+0×298
fffff806`62a54e00 nt!MiSystemPartition
fffff806`621290cc nt!MiDispatchFault+0×2ac
fffff806`6221db3d nt!PspGetSetContextSpecialApc+0×6d
fffff806`624ea5fd nt!PspSetContextThreadInternal+0×16d
fffff806`624e9083 nt!PspInitializeThunkContext+0×28f
00007ffc`884b6870 ntdll!TppWorkerThread
00007ffc`884a4830 ntdll!RtlUserThreadStart
fffff806`620d58e4 nt!EtwpEventWriteFull+0×3f4
fffff806`61e0f808 nt!ThreadWorkOnBehalfUpdate
fffff806`6221d818 nt!SwapContext+0×4d8
fffff806`6221d056 nt!KiSwapContext+0×76
fffff806`62132457 nt!KiSwapThread+0×3a7
fffff806`61e0f808 nt!ThreadWorkOnBehalfUpdate
fffff806`62134309 nt!KiCommitThreadWait+0×159
fffff806`62136d66 nt!KeRemoveQueueEx+0×2b6
fffff806`6255f501 nt!PspThreadFromTicket+0×51
fffff806`62136778 nt!IoRemoveIoCompletion+0×98
fffff806`6256d901 nt!ObpReferenceObjectByHandleWithTag+0×231
fffff806`6256d6be nt!ObReferenceObjectByHandle+0×2e
fffff806`62138fdc nt!NtWaitForWorkViaWorkerFactory+0×39c
fffff806`62227b75 nt!KiSystemServiceCopyEnd+0×25
00007ffc`88546f14 ntdll!NtWaitForWorkViaWorkerFactory+0×14

Such Historical Information may help in the reconstruction of past system behavior.

- Dmitry Vostokov @ DumpAnalysis.org + TraceAnalysis.org -
Trace Analysis Patterns (Part 247)

June 24th, 2024

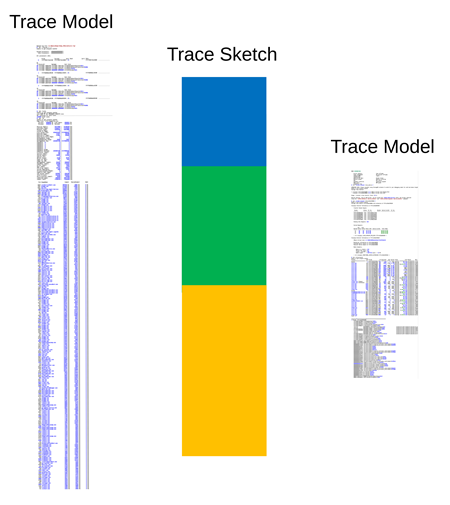
Trace Sketch can have several Trace Models (borrowed from model theory with sketches representing the logic of traces and logs) when messages satisfy trace and log analysis patterns sketched in Dia|gram language illustrations:

The same Trace Sketch induces an equivalence relation between different Trace Models, yet another Trace Similarity measure. Also, models of traces and logs having the same Trace Shapes may not be equivalent.

- Dmitry Vostokov @ DumpAnalysis.org + TraceAnalysis.org -

Trace Analysis Patterns (Part 246)

June 19th, 2024

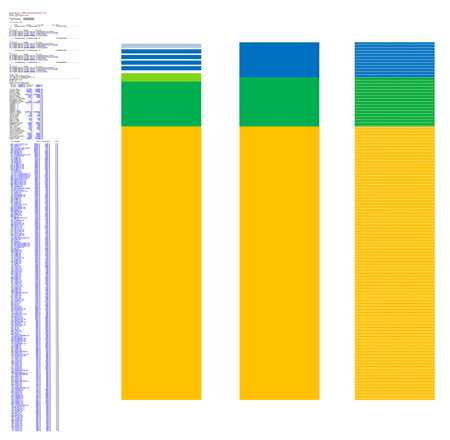
Trace Sketch embodies Dia|gram language approach: in essence each trace and log analysis pattern illustration is a sketch. For example, a WinDbg log is represented as sequence of different Activity Regions:

Another example of Trace Sketch is Trace Skeleton.

- Dmitry Vostokov @ DumpAnalysis.org + TraceAnalysis.org -

Crash Dump Analysis Patterns (Part 297, Linux)

June 15th, 2024

When analyzing Execution Residue we are interested in valid symbolic references, for example, valid return addresses for Rough Stack Trace and Past Stack Trace reconstruction. Some of them may be Coincidental Symbolic Information that we check with backward disassembly. However, some symbolic references may be Function Pointers if forward disassembly starts with valid function prologue. Some references may also point to the start of exception processing in the middle of a normal function body. These two variants are illustrated with the following two addresses taken from the raw stack data when debugging an x64 Linux process in WSL using the latest version of WinDbg:

0:000> u 00007f73`e45820b0
libgcc_s_so!Unwind_Backtrace+0x7c0:
00007f73`e45820b0 push r15
00007f73`e45820b2 push r14
00007f73`e45820b4 push r13
00007f73`e45820b6 push r12
00007f73`e45820b8 push rbp
00007f73`e45820b9 push rbx
00007f73`e45820ba sub rsp,58h
00007f73`e45820be mov ecx,dword ptr [rdx+28h]

0:000> u 00005564`99d582c8
ud5bv3!start_modeling+0xd7:
00005564`99d582c8 mov rdi,rax
00005564`99d582cb call ud5bv3!_cxa_begin_catch$plt (00005564`99d58040)
00005564`99d582d0 call ud5bv3!_cxa_end_catch$plt (00005564`99d580b0)
00005564`99d582d5 jmp ud5bv3!start_modeling+0x64 (00005564`99d58255)
00005564`99d582da leave
00005564`99d582db ret
ud5bv3!new_feature:
00005564`99d582dc push rbp
00005564`99d582dd mov rbp,rsp

0:000> ub 00005564`99d582c8
ud5bv3!start_modeling+0xb5:
00005564`99d582a6 mov rdi,rax
00005564`99d582a9 call ud5bv3!sem_close$plt (00005564`99d580a0)
00005564`99d582ae mov rax,qword ptr [rbp-8]
00005564`99d582b2 mov rdi,rax
00005564`99d582b5 call ud5bv3!sem_close$plt (00005564`99d580a0)
00005564`99d582ba lea rdi,[ud5bv3!IO_stdin_used+0x4 (00005564`99d59004)]
00005564`99d582c1 call ud5bv3!sem_unlink$plt (00005564`99d580c0)
00005564`99d582c6 jmp ud5bv3!start_modeling+0xe9 (00005564`99d582da)

As we see, some Function Pointers may have symbolic name plus some offset if they don’t have associated symbols.

- Dmitry Vostokov @ DumpAnalysis.org + TraceAnalysis.org -

Trace Analysis Patterns (Part 245)

April 20th, 2024

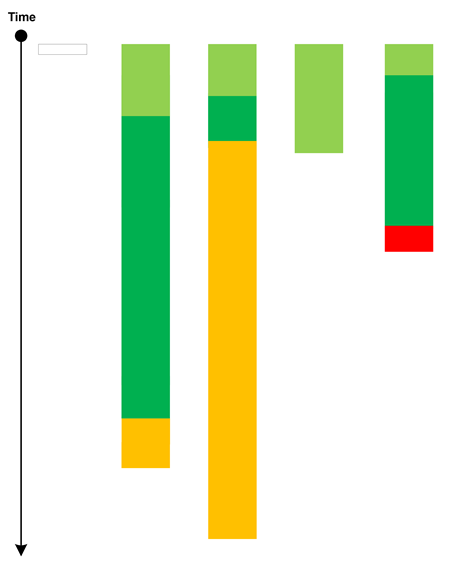
Feynman Trace borrows ideas from the path integral formulation of quantum mechanics. Such a trace includes all possible traces from all possible traces generated from all possible executions including Trace Amplitudes, Empty Traces, Use Case Trails, and traces with Error Messages, but excluding Impossible Traces:

Code flow Declarative Trace analysis can be used to assess the relative contributions of trace and log variants. To reduce infinities arising from loops, Renormalization can be used.

- Dmitry Vostokov @ DumpAnalysis.org + TraceAnalysis.org -

Crash Dump Analysis Patterns (Part 65, Linux)

April 17th, 2024

This analysis pattern is a Linux variant of the previous Not My Version Windows crash dump analysis pattern. In case of segmentation faults/core dumps with Stack Traces involving OS and 3rd-party shared libraries it is worth noting directories they come from:

(gdb) info sharedlibrary
From To Syms Read Shared Object Library
0x00007fad170d5950 0x00007fad170e2dc8 Yes (*) /lib64/lib3rdparty.so.0
0x00007fad170c3130 0x00007fad170c3eb5 Yes /lib/x86_64-linux-gnu/libdl.so.2
0x00007fad16f24320 0x00007fad1706a14b Yes /lib/x86_64-linux-gnu/libc.so.6
0x00007fad17103090 0x00007fad17120b50 Yes /lib64/ld-linux-x86-64.so.2
0x00007fad16bfd300 0x00007fad16c03578 Yes /lib/x86_64-linux-gnu/libnss_files.so.2

If you use WinDbg to analyze Linux core dumps, you can use lmv command or its variant. It is worth noting that referenced libraries can be symbolic links to different versions than you expect. Unfortunately, it is not so easy to extract library timestamps, so it is recommended to additionally use Paratext analysis pattern to supply such information.

- Dmitry Vostokov @ DumpAnalysis.org + TraceAnalysis.org -

Region Patterns

March 31st, 2024

A page to reference all different kinds of region-related analysis patterns is necessary, so I created this post:

I’ll update it as soon as I add more similar patterns.

- Dmitry Vostokov @ DumpAnalysis.org + TraceAnalysis.org -

Crash Dump Analysis Patterns (Part 296)

March 31st, 2024

If we dump contents of memory regions such as thread stacks we get different region memory addresses due to ASLR. To compare such regions from different executions we need to make them Normalized Regions replacing varying address parts with a common symbolic denominator, for example, 0-based addresses (or some other non-digital symbols to account of the possibility of already existing similar 0-based addresses) and adjusting address offsets appropriately. For example, the following raw stack region from Foreign Stack analysis pattern (we do not normalize foreign stack addresses below):

00000055`adbfe000 00000000`00000000
00000055`adbfe008 00000000`00000000
00000055`adbfe010 00000000`00000000
00000055`adbfe018 00000000`00000000
00000055`adbfe020 00000000`00000000

00000055`adbffa58 00000000`00000008
00000055`adbffa60 00000055`adbffb28
00000055`adbffa68 00007ff7`96e116a3 module!func+0×13
00000055`adbffa70 00000055`ad8ffde0
00000055`adbffa78 00000000`00000000
00000055`adbffa80 00000000`00000000
00000055`adbffa88 00007ffa`28ecc9a8 ucrtbase!`string’
00000055`adbffa90 00000000`00000000
00000055`adbffa98 00007ff7`96e116c3 module!thread_proc+0×13
00000055`adbffaa0 00000055`ad8ffde0
00000055`adbffaa8 00000055`adbffb28
00000055`adbffab0 ffffffff`ffffffff
00000055`adbffab8 00007ffa`28fa0748 KERNELBASE!GetAppModelPolicy+0×18
00000055`adbffac0 00000055`adbffba0
00000055`adbffac8 00007ff7`96e12657 module!std::invoke<void (__cdecl*)(int *),int *>+0×27
00000055`adbffad0 00000055`ad8ffde0
00000055`adbffad8 00000055`adbffb00
00000055`adbffae0 00000055`adbffb18

--------`00000000 00000000`00000000
--------`00000008 00000000`00000000
--------`00000010 00000000`00000000
--------`00000018 00000000`00000000
--------`00000020 00000000`00000000

--------`00001a58 00000000`00000008
--------`00001a60 --------`00001b28
--------`00001a68 00007ff7`96e116a3 module!func+0×13
--------`00001a70 00000055`ad8ffde0
--------`00001a78 00000000`00000000
--------`00001a80 00000000`00000000
--------`00001a88 00007ffa`28ecc9a8 ucrtbase!`string’
--------`00001a90 00000000`00000000
--------`00001a98 00007ff7`96e116c3 module!thread_proc+0×13
--------`00001aa0 00000055`ad8ffde0
--------`00001aa8 --------`00001b28
--------`00001ab0 ffffffff`ffffffff
--------`00001ab8 00007ffa`28fa0748 KERNELBASE!GetAppModelPolicy+0×18
--------`00001ac0 --------`00001ba0
--------`00001ac8 00007ff7`96e12657 module!std::invoke<void (__cdecl*)(int *),int *>+0×27
--------`00001ad0 00000055`ad8ffde0
--------`00001ad8 --------`00001b00
--------`00001ae0 --------`00001b18

- Dmitry Vostokov @ DumpAnalysis.org + TraceAnalysis.org -

Crash Dump Analysis Patterns (Part 295)

March 30th, 2024

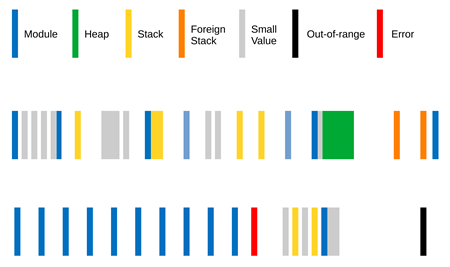
Values in memory regions, when interpreted as addresses, such as stack can be classified according to their categories such as zero, module (code and data), heap, stack, Foreign Stack, Small Value, error, and out-of-range (for example, kernel space address in user space). Such classification can be encoded and optionally visualized as Region Spectrum:

- Dmitry Vostokov @ DumpAnalysis.org + TraceAnalysis.org -

Crash Dump Analysis Patterns (Part 294)

March 18th, 2024

Generative AI LLM models such as GPT-4 can be used as Analysis Summary devices (although such summaries should be treated with caution and double-checked). For example, let’s look at the default !analyze -v WinDbg command summary:

Summarize:
0: kd> !analyze -v
*******************************************************************************
* *
* Bugcheck Analysis *
* *
*******************************************************************************

DRIVER_IRQL_NOT_LESS_OR_EQUAL (d1)
An attempt was made to access a pageable (or completely invalid) address at an
interrupt request level (IRQL) that is too high. This is usually
caused by drivers using improper addresses.
If kernel debugger is available get stack backtrace.
Arguments:
Arg1: ffffbc06b64895a0, memory referenced
Arg2: 0000000000000002, IRQL
Arg3: 0000000000000000, value 0 = read operation, 1 = write operation
Arg4: fffff80403c61981, address which referenced memory

Debugging Details:
------------------

Unable to load image \??\C:\WINDOWS\system32\drivers\myfault.sys, Win32 error 0n2

KEY_VALUES_STRING: 1

Key : Analysis.CPU.mSec
Value: 1717

Key : Analysis.Elapsed.mSec
Value: 7052

Key : Analysis.IO.Other.Mb
Value: 0

Key : Analysis.IO.Read.Mb
Value: 3

Key : Analysis.IO.Write.Mb
Value: 10

Key : Analysis.Init.CPU.mSec
Value: 82327

Key : Analysis.Init.Elapsed.mSec
Value: 75855690

Key : Analysis.Memory.CommitPeak.Mb
Value: 577

Key : Bugcheck.Code.KiBugCheckData
Value: 0xd1

Key : Bugcheck.Code.LegacyAPI
Value: 0xd1

Key : Bugcheck.Code.TargetModel
Value: 0xd1

Key : Failure.Bucket
Value: AV_myfault!unknown_function

Key : Failure.Hash
Value: {9745090a-9bce-ccba-c096-ca6e9ca04c64}

Key : Hypervisor.Enlightenments.Value
Value: 8480

Key : Hypervisor.Enlightenments.ValueHex
Value: 2120

Key : Hypervisor.Flags.AnyHypervisorPresent
Value: 1

Key : Hypervisor.Flags.ApicEnlightened
Value: 0

Key : Hypervisor.Flags.ApicVirtualizationAvailable
Value: 0

Key : Hypervisor.Flags.AsyncMemoryHint
Value: 0

Key : Hypervisor.Flags.CoreSchedulerRequested
Value: 0

Key : Hypervisor.Flags.CpuManager
Value: 0

Key : Hypervisor.Flags.DeprecateAutoEoi
Value: 0

Key : Hypervisor.Flags.DynamicCpuDisabled
Value: 0

Key : Hypervisor.Flags.Epf
Value: 0

Key : Hypervisor.Flags.ExtendedProcessorMasks
Value: 0

Key : Hypervisor.Flags.HardwareMbecAvailable
Value: 0

Key : Hypervisor.Flags.MaxBankNumber
Value: 0

Key : Hypervisor.Flags.MemoryZeroingControl
Value: 0

Key : Hypervisor.Flags.NoExtendedRangeFlush
Value: 1

Key : Hypervisor.Flags.NoNonArchCoreSharing
Value: 0

Key : Hypervisor.Flags.Phase0InitDone
Value: 1

Key : Hypervisor.Flags.PowerSchedulerQos
Value: 0

Key : Hypervisor.Flags.RootScheduler
Value: 0

Key : Hypervisor.Flags.SynicAvailable
Value: 0

Key : Hypervisor.Flags.UseQpcBias
Value: 0

Key : Hypervisor.Flags.Value
Value: 536584

Key : Hypervisor.Flags.ValueHex
Value: 83008

Key : Hypervisor.Flags.VpAssistPage
Value: 1

Key : Hypervisor.Flags.VsmAvailable
Value: 0

Key : Hypervisor.RootFlags.AccessStats
Value: 0

Key : Hypervisor.RootFlags.CrashdumpEnlightened
Value: 0

Key : Hypervisor.RootFlags.CreateVirtualProcessor
Value: 0

Key : Hypervisor.RootFlags.DisableHyperthreading
Value: 0

Key : Hypervisor.RootFlags.HostTimelineSync
Value: 0

Key : Hypervisor.RootFlags.HypervisorDebuggingEnabled
Value: 0

Key : Hypervisor.RootFlags.IsHyperV
Value: 0

Key : Hypervisor.RootFlags.LivedumpEnlightened
Value: 0

Key : Hypervisor.RootFlags.MapDeviceInterrupt
Value: 0

Key : Hypervisor.RootFlags.MceEnlightened
Value: 0

Key : Hypervisor.RootFlags.Nested
Value: 0

Key : Hypervisor.RootFlags.StartLogicalProcessor
Value: 0

Key : Hypervisor.RootFlags.Value
Value: 0

Key : Hypervisor.RootFlags.ValueHex
Value: 0

Key : SecureKernel.HalpHvciEnabled
Value: 0

Key : WER.OS.Branch
Value: co_release

Key : WER.OS.Version
Value: 10.0.22000.1

BUGCHECK_CODE: d1

BUGCHECK_P1: ffffbc06b64895a0

BUGCHECK_P2: 2

BUGCHECK_P3: 0

BUGCHECK_P4: fffff80403c61981

FILE_IN_CAB: MEMORY-WM.DMP

VIRTUAL_MACHINE: VMware

READ_ADDRESS: ffffbc06b64895a0 Paged pool

BLACKBOXBSD: 1 (!blackboxbsd)

BLACKBOXNTFS: 1 (!blackboxntfs)

BLACKBOXWINLOGON: 1

PROCESS_NAME: notmyfault64.exe

TRAP_FRAME: ffffa7848ee7d7c0 -- (.trap 0xffffa7848ee7d7c0)
NOTE: The trap frame does not contain all registers.
Some register values may be zeroed or incorrect.
rax=000000000210f204 rbx=0000000000000000 rcx=ffffbc06aa200380
rdx=0000000000000880 rsi=0000000000000000 rdi=0000000000000000
rip=fffff80403c61981 rsp=ffffa7848ee7d950 rbp=ffffa7848ee7dbc1
r8=ffffbc06b9320aa0 r9=0000000000000000 r10=ffffbc06aa200300
r11=ffffbc06b647e590 r12=0000000000000000 r13=0000000000000000
r14=0000000000000000 r15=0000000000000000
iopl=0 nv up ei ng nz na po nc
myfault+0x1981:
fffff804`03c61981 mov eax,dword ptr [rbx] ds:00000000`00000000=????????
Resetting default scope

STACK_TEXT:
ffffa784`8ee7d678 fffff804`04e28da9 : 00000000`0000000a ffffbc06`b64895a0 00000000`00000002 00000000`00000000 : nt!KeBugCheckEx
ffffa784`8ee7d680 fffff804`04e24f00 : ffffa784`8ee7d878 ffffa784`8ee7d7fc ffffbc06`b647e580 fffff804`04cfcba7 : nt!KiBugCheckDispatch+0x69
ffffa784`8ee7d7c0 fffff804`03c61981 : 00000000`00000000 ffff8008`aaed9ef0 00000000`00000000 00000000`00000000 : nt!KiPageFault+0x440
ffffa784`8ee7d950 fffff804`03c61d3d : ffff8008`0210f204 fffff906`021a0010 00000000`00000000 00000000`00000000 : myfault+0x1981
ffffa784`8ee7d980 fffff804`03c61ea1 : ffff8008`b0f05120 fffff804`050a4524 ffff8008`aa135b00 00000000`00001dc9 : myfault+0x1d3d
ffffa784`8ee7dac0 fffff804`04d03115 : ffff8008`b0f05120 00000000`00000002 00000000`000000f0 00000000`00000000 : myfault+0x1ea1
ffffa784`8ee7db20 fffff804`0516bbf2 : 00000000`00000001 ffff8008`b0f05120 ffffa784`8ee7dbc1 fffff804`04d02ed3 : nt!IofCallDriver+0x55
ffffa784`8ee7db60 fffff804`0516b9d2 : ffff8008`00000000 ffffa784`8ee7dea0 00000000`83360018 ffff8008`b0f05120 : nt!IopSynchronousServiceTail+0x1d2
ffffa784`8ee7dc10 fffff804`0516ad36 : 00000000`00000000 00000000`00000000 00000000`00000000 00000000`00000000 : nt!IopXxxControlFile+0xc82
ffffa784`8ee7dd40 fffff804`04e28775 : 00000000`00000000 00000000`00000000 ffff0cbf`113fcb36 00000000`00070000 : nt!NtDeviceIoControlFile+0x56
ffffa784`8ee7ddb0 00007ffe`4d263834 : 00007ffe`4a893ffb 00000000`0008040a 00000014`00000048 00007ffe`4b031434 : nt!KiSystemServiceCopyEnd+0x25
0000009b`cc0fedd8 00007ffe`4a893ffb : 00000000`0008040a 00000014`00000048 00007ffe`4b031434 00000000`00000000 : ntdll!NtDeviceIoControlFile+0x14
0000009b`cc0fede0 00007ffe`4bb95f91 : 00000000`83360018 00000000`00000000 00000000`00000000 00007ffe`4cda99f9 : KERNELBASE!DeviceIoControl+0x6b
0000009b`cc0fee50 00007ff7`6544342f : 00000000`0008050e 0000009b`cc0fef39 0000009b`cc0fef39 00000000`00000000 : KERNEL32!DeviceIoControlImplementation+0x81
0000009b`cc0feea0 00000000`0008050e : 0000009b`cc0fef39 0000009b`cc0fef39 00000000`00000000 00000000`00000000 : 0x00007ff7`6544342f
0000009b`cc0feea8 0000009b`cc0fef39 : 0000009b`cc0fef39 00000000`00000000 00000000`00000000 00000000`00000000 : 0x8050e
0000009b`cc0feeb0 0000009b`cc0fef39 : 00000000`00000000 00000000`00000000 00000000`00000000 0000009b`cc0feee0 : 0x0000009b`cc0fef39
0000009b`cc0feeb8 00000000`00000000 : 00000000`00000000 00000000`00000000 0000009b`cc0feee0 00000000`00000000 : 0x0000009b`cc0fef39

SYMBOL_NAME: myfault+1981

MODULE_NAME: myfault

IMAGE_NAME: myfault.sys

STACK_COMMAND: .cxr; .ecxr ; kb

BUCKET_ID_FUNC_OFFSET: 1981

FAILURE_BUCKET_ID: AV_myfault!unknown_function

OS_VERSION: 10.0.22000.1

BUILDLAB_STR: co_release

OSPLATFORM_TYPE: x64

OSNAME: Windows 10

FAILURE_ID_HASH: {9745090a-9bce-ccba-c096-ca6e9ca04c64}

Followup: MachineOwner
---------

This summary is based on a Windows bugcheck (blue screen of death) analysis report. The specific error encountered is DRIVER_IRQL_NOT_LESS_OR_EQUAL with a stop code of 0xD1. This error indicates that a driver attempted to access a pageable (or completely invalid) address at an interrupt request level (IRQL) that was too high, which is typically a result of drivers using improper addresses.

Key details from the analysis include:

  • Memory Referenced (Arg1): ffffbc06b64895a0. This is the memory address that was being accessed when the error occurred.
  • IRQL (Arg2): 2, indicating the interrupt request level at the time of the error.
  • Operation Type (Arg3): 0, meaning a read operation was being performed.
  • Address that Referenced Memory (Arg4): fffff80403c61981, the address within the driver or system component that attempted the illegal memory access.

Additional debugging details highlight that the error was caused by the myfault.sys driver, which is notably used for generating system crashes for testing purposes. The error occurred while running the process notmyfault64.exe, further suggesting that this was a deliberate test of system stability or error handling.

The analysis also included various technical details about the system state, such as CPU and memory usage metrics, the virtual machine environment (VMware), and other system flags. The failure bucket identifies the issue as an access violation (AV) within the myfault driver, without specifying a known function, indicating a potentially unknown or unexpected path within the driver causing the crash.

Given the context, it appears this crash was induced as part of a debugging or system testing exercise, likely to analyze how the system and its error handling mechanisms respond to driver-induced errors.

The following are Analysis Summaries from the two latest pattern cooperation case studies:

Spiking Thread, Top Module, Module Hint, and Memory Fluctuation

The analysis revolves around diagnosing a sluggish performance issue on a Windows 7 system, attributed to high CPU and physical memory usage by one of the svchost.exe processes. A process memory dump revealed a significantly large file size (almost 1.5 GB), hinting at abnormal behavior warranting a deeper investigation using crash and hang dump analysis techniques.

Key Observations:

  1. Spiking Thread Pattern: Initial analysis identified a single thread consuming a disproportionate amount of CPU time, indicative of a Spiking Thread pattern. This thread, identified through the !runaway command in WinDbg, significantly outpaced other threads in both user and kernel mode time.
  2. Windows Update Agent Activity: The stack trace of the spiking thread pointed to activity related to the Windows Update Agent (wuaueng.dll), suggesting that the Windows Update process was contributing to the system’s sluggish performance.
  3. Heap Usage and Potential Memory Leak: Examination of the process address space showed nearly 1 GB occupied by the process heap, with many large virtual blocks allocated. This was suspected to be indicative of a memory leak.
  4. Temporary Condition: Interestingly, the system’s performance normalized after about 20 minutes, and a subsequent memory dump was significantly smaller (less than 150 KB). Analysis of this dump showed a different thread (#32) as having consumed CPU time in the past, but with the system no longer exhibiting high CPU or memory usage.
  5. Memory Fluctuation: The investigation concluded that the observed behavior was a case of Memory Fluctuation, associated with the temporary demands of the Windows Update process. The initial large memory usage and CPU consumption were temporary and resolved without intervention, as evidenced by the normalization of resource usage and the significant reduction in the size of the process memory dump.

Conclusion:

The investigation showcases the importance of crash and hang dump analysis in diagnosing and understanding transient performance issues in Windows systems. It highlights how system processes, in this case, the Windows Update Agent, can temporarily consume significant system resources, leading to performance degradation. The analysis also demonstrates the system’s ability to recover from such states, emphasizing the temporary nature of certain performance issues.

Exception Stack Trace, Stored Exception, Translated Exception, Execution Residue, Hidden Exception, NULL Pointer, Exception Module, Stack Trace Motif, No Component Symbols, and Coincidental Symbolic Information

The analysis provided deals with an investigation into a series of crashes of the backgroundTaskHost.exe on a system, focusing on the crash dumps found in a specified folder set up through the LocalDumps Windows Error Reporting (WER) registry. These crashes are characterized by a consistent Exception Stack Trace and a Stored Exception that suggests a security vulnerability (stack buffer overrun) potentially exploitable by malicious actors. The investigation involves detailed WinDbg command outputs, providing insight into the nature of the crashes, the involved modules, and the potential causes.

Key Findings:

  1. Consistent Crash Cause: All crash dumps share the same Exception Stack Trace and Stored Exception, indicating a consistent failure mode across multiple instances. The failure is identified as a stack buffer overrun (c0000409), a type of vulnerability that could allow unauthorized control over the application.
  2. Exception Stack Trace Analysis: The stack trace points to several modules, including ucrtbase, vccorlib140_app, and Microsoft_Applications_Telemetry_Windows, among others. The presence of multiple calls to DllGetActivationFactory and the involvement of telemetry-related functions suggest the crashes may be related to the handling of telemetry data.
  3. Translated and Hidden Exceptions: The analysis reveals a discrepancy between the exception addresses and contexts reported by different WinDbg commands, suggesting the presence of translated exceptions. Further examination of the execution residue uncovers hidden exceptions, indicating that the initial crash may be concealing additional underlying issues.
  4. Module Involvement and Symbolic Information: The Microsoft_Applications_Telemetry_Windows module is highlighted as a significant factor in the crashes, particularly due to its association with telemetry data processing functions. However, the analysis also suggests that the symbolic information for this module may be coincidental, due to the absence of component symbols and an unusually large offset for the getJsonFormattedEvent function.
  5. Function Size Discrepancy: Discrepancies in the expected size of the getJsonFormattedEvent function, compared to its offset, raise questions about the accuracy of the symbolic information provided. This discrepancy also complicates the search for pointers to JSON strings in the memory dump, as typical commands do not reveal expected patterns.

Overall, the analysis suggests that the crashes may be related to the processing of telemetry data, potentially due to a stack buffer overrun vulnerability in the backgroundTaskHost.exe. The involvement of the Microsoft_Applications_Telemetry_Windows module and discrepancies in symbolic information point to the need for further investigation, including the possibility of missing or inaccurate debugging symbols that could clarify the root cause of these crashes.

- Dmitry Vostokov @ DumpAnalysis.org + TraceAnalysis.org -

Crash Dump Analysis Patterns (Part 293)

March 18th, 2024

Generative AI LLM models such as GPT-4 are very good at annotation and summarization of memory regions (Region Summaries) with symbolic information and may provide additional insight even without symbolic information (although all such insights should be treated with caution):

Summarize:
0: kd> dpS ffffa7848e4c5000 ffffa7848e4cb000
fffff804`04c0fa78 nt!HalpApicRequestInterrupt+0xd8
fffff804`04d2b18d nt!HalpInterruptSendIpi+0xfd
fffff804`04d091f1 nt!MiAddWorkingSetEntries+0x451
fffff804`04a0f800 nt!MiFreeThenFree
fffff804`04d08aa5 nt!MiAllocateWsle+0x295
fffff804`04d0a520 nt!MiGetPageChain+0xeb0
fffff804`05654fc0 nt!MiSystemPartition
fffff804`04d07fec nt!MiCompletePrivateZeroFault+0x77c
fffff804`04cd2d1d nt!HalRequestIpiSpecifyVector+0x7d
fffff804`04cd2aa7 nt!KiIpiSendRequest+0x397
fffff804`04d5f66c nt!KiIpiSendRequestEx+0x88
fffff804`04d5f5d1 nt!KxFlushEntireTb+0x1a5
fffff804`04c31710 nt!KiFlushCurrentTbWorker
fffff804`05654fc0 nt!MiSystemPartition
fffff804`04d5eccd nt!KeFlushTb+0xa1
fffff804`04c65e3e nt!MiFlushEntireTbDueToAttributeChange+0x4a
fffff804`04d0b1c4 nt!MiGetPerfectColorHeadPage+0x94
fffff804`05654f00 nt!PnpSystemHiveTooLarge
fffff804`04c6cfad nt!MiChangePageAttribute+0xed
fffff804`04cf7fc6 nt!MiFlushTbAsNeeded+0x156
fffff804`04d50053 nt!MiGetContainingPageTable+0x43
fffff804`04d4fc5c nt!MiAssignNonPagedPoolPte+0x1ac
fffff804`04c0fa78 nt!HalpApicRequestInterrupt+0xd8
fffff804`04d2b18d nt!HalpInterruptSendIpi+0xfd
fffff804`04cf86a6 nt!MmAllocatePoolMemory+0xca
fffff804`05654fc0 nt!MiSystemPartition
fffff804`04c6feeb nt!MiReplenishPageSlist+0x31b
fffff804`05654fc0 nt!MiSystemPartition
fffff804`04c1356a nt!HalPerformEndOfInterrupt+0x1a
fffff804`05655a00 nt!MiSystemPartition+0xa40
fffff804`04d2ee05 nt!ExReleaseAutoExpandPushLockShared+0x85
fffff804`0960cfde Ntfs!NtfsLookupNtfsMcbEntryWithSyncFlag+0x14e
fffff804`04e1e197 nt!SwapContext+0x1c7
fffff804`056eabd0 nt!KiAbTreeArray+0x52d0
fffff804`04cfb100 nt!KiAbEntryGetLockedHeadEntry+0x2a0
fffff804`04e1dce6 nt!KiSwapContext+0x76
fffff804`04cc0d52 nt!KiCancelTimer+0x262
fffff804`05653500 nt!MiState+0x4480
fffff804`04cdd148 nt!MiReservePtes+0x48
fffff804`09543e42 Wof!WofPostReadCallback+0x72
fffff804`096086a9 Ntfs!NtfsVerifyAndRevertUsaBlock+0x25d
fffff804`0893676f FLTMGR!FltpPerformPostCallbacksWorker+0x3bf
fffff804`04d2ba3b nt!KeQueryCurrentStackInformationEx+0x8b
fffff804`04c0fa78 nt!HalpApicRequestInterrupt+0xd8
fffff804`04d2b18d nt!HalpInterruptSendIpi+0xfd
fffff804`04d2f11f nt!KeSetEvent+0xdf
fffff804`04cc5dc7 nt!IopFreeIrp+0xf7
fffff804`04d34cc7 nt!IofCompleteRequest+0x17
fffff804`09619028 Ntfs!NtfsExtendedCompleteRequestInternal+0x218
fffff804`04d2ee05 nt!ExReleaseAutoExpandPushLockShared+0x85
fffff804`04d0e611 nt!MmCheckCachedPageStates+0x681
fffff804`05659240 nt!MiSystemPartition+0x4280
fffff804`04d0e611 nt!MmCheckCachedPageStates+0x681
fffff804`05654fc0 nt!MiSystemPartition
fffff804`04d30071 nt!MiUnlockWorkingSetShared+0x81
fffff804`04d2ee05 nt!ExReleaseAutoExpandPushLockShared+0x85
fffff804`04d0e611 nt!MmCheckCachedPageStates+0x681
fffff804`0960feca Ntfs!NtfsCheckMappingPairs+0xea
fffff804`0960cfde Ntfs!NtfsLookupNtfsMcbEntryWithSyncFlag+0x14e
fffff804`04c9b51a nt!SepNormalAccessCheck+0x1fa
fffff804`04d2f11f nt!KeSetEvent+0xdf
fffff804`04d0e611 nt!MmCheckCachedPageStates+0x681
fffff804`04c9ad64 nt!SepAccessCheck+0x304
fffff804`0960fe00 Ntfs!NtfsCheckMappingPairs+0x20
fffff804`054351f8 nt!IopFileMapping
fffff804`04c9a570 nt!SeAccessCheckWithHint+0x640
fffff804`054351f8 nt!IopFileMapping
fffff804`09721fb2 Ntfs!TxfAccessCheck+0x192
fffff804`05163eff nt!CcUnpinData+0x1f
fffff804`054351f8 nt!IopFileMapping
fffff804`04c93842 nt!FsRtlCheckOplockEx2+0x922
fffff804`04d3027b nt!ExReleaseResourceLite+0xeb
fffff804`050f44bb nt!SeUnlockSubjectContext+0x1b
fffff804`0971f872 Ntfs!NtfsAccessCheck+0x11b2
fffff804`04c92f0c nt!FsRtlCheckOplockEx+0x3c
fffff804`09721b48 Ntfs!NtfsOpenAttribute+0x1768
fffff804`0971e585 Ntfs!NtfsCheckExistingFile+0x775
fffff804`096e7a2c Ntfs!NtfsBreakBatchOplock+0xfc
fffff804`0971dce2 Ntfs!NtfsOpenExistingAttr+0x252
fffff804`0971d6cb Ntfs!NtfsOpenAttributeInExistingFile+0xcbb
fffff804`04d2dae9 nt!FsRtlLookupPerStreamContextInternal+0x1a9
fffff804`04d2ee05 nt!ExReleaseAutoExpandPushLockShared+0x85
fffff804`08934f4e FLTMGR!FltGetStreamContext+0xce
fffff804`095637c6 Wof!WofPostCleanupCallback+0xa6
fffff804`0893676f FLTMGR!FltpPerformPostCallbacksWorker+0x3bf
fffff804`04d302d6 nt!ExReleaseResourceLite+0x146
fffff804`05157ff1 nt!HvpGetCellContextInitialize+0x15
fffff804`051580aa nt!HvpMapEntryGetBlockAddress+0xe
fffff804`05157fcf nt!HvpReleaseCellPaged+0x2f
fffff804`05158072 nt!HvpGetCellPaged+0x72
fffff804`05157ff1 nt!HvpGetCellContextInitialize+0x15
fffff804`0515be21 nt!CmpCompareInIndex+0x211
fffff804`05157fcf nt!HvpReleaseCellPaged+0x2f
fffff804`04cc684c nt!KiSetAddressPolicy+0xc
fffff804`04cc6b6d nt!KiStackAttachProcess+0x24d
fffff804`04d2cd97 nt!wil_details_FeatureReporting_ReportUsageToServiceDirect+0xd7
fffff804`05157ff1 nt!HvpGetCellContextInitialize+0x15
fffff804`05157fcf nt!HvpReleaseCellPaged+0x2f
fffff804`04cc684c nt!KiSetAddressPolicy+0xc
fffff804`04c842f7 nt!wil_details_FeatureReporting_ReportUsageToService+0x37
fffff804`04cc6de5 nt!KiSwapProcess+0x75
fffff804`04cc6faa nt!KiUnstackDetachProcess+0x17a
fffff804`054b132b nt!CmpDetachFromRegistryProcess+0xb
fffff804`0517eee1 nt!CmpDoParseKey+0x2f11
fffff804`096e8d01 Ntfs!NtfsCompleteCleanupRequest+0x51
fffff804`04d40000 nt!MiFreeWsleList+0x130
fffff804`05654fc0 nt!MiSystemPartition
fffff804`095e71be WdFilter+0x571be
fffff804`095c8c5f WdFilter+0x38c5f
fffff804`04d2cd97 nt!wil_details_FeatureReporting_ReportUsageToServiceDirect+0xd7
fffff804`051b1ac1 nt!VrpRegistryCallback+0xc1
fffff804`0517f9c5 nt!CmpCallCallBacksEx+0x3f5
fffff804`04d2ce3f nt!CmpIsRegistryLockAcquired+0x2f
fffff804`0517bd15 nt!CmpParseKey+0x445
fffff804`04d28a55 nt!MiFastLockLeafPageTable+0x175
fffff804`04d24578 nt!MiGetPageProtection+0x408
fffff804`04d23a2e nt!MiQueryAddressState+0x6ee
fffff804`095e0000 WdFilter+0x50000
fffff804`04d1abe6 nt!MiQueryAddressSpan+0x1e6
fffff804`04d1a862 nt!MiUnlockAndDereferenceVadShared+0x62
fffff804`0517785c nt!MmQueryVirtualMemory+0x6bc
fffff804`0896d280 FLTMGR!FltpFastIoWrite+0x190
fffff804`0516dfc1 nt!ObpReferenceObjectByHandleWithTag+0x231
fffff804`0516dd41 nt!ObReferenceObjectByHandleWithTag+0x31
fffff804`0516ac7b nt!ObWaitForSingleObject+0xdb
fffff804`0516ab8a nt!NtWaitForSingleObject+0x6a
fffff804`04e28775 nt!KiSystemServiceCopyEnd+0x25
00007ffe`4d2637d4 ntdll!NtWaitForSingleObject+0x14

This output appears to be from the dpS (display words and symbols) debugger command, which is listing memory contents and associated symbols within a specified range (from ffffa7848e4c5000 to ffffa7848e4cb000). The listing shows addresses in memory alongside their corresponding symbol names, indicating various kernel and system functions being referenced in this memory range.

  • Functions from nt! (the NT kernel) dominate the list, suggesting this memory range is heavily involved in core operating system operations. This includes interrupt handling (HalpApicRequestInterrupt), memory management (MiAllocateWsle, MiGetPageChain), process and thread management (KiSwapProcess, KiUnstackDetachProcess), and others.
  • Specific actions related to memory management and page table entries are frequent, such as MiFlushEntireTbDueToAttributeChange, indicating operations that involve modifying the Translation Lookaside Buffer (TLB) as part of memory attribute changes.
  • There are references to file system operations and filter manager functions (e.g., Ntfs!NtfsOpenAttribute, FLTMGR!FltpPerformPostCallbacksWorker), pointing to disk I/O and file system activities within this memory range.
  • Several entries related to security and access control (e.g., SepAccessCheck, SeAccessCheckWithHint), showing that some operations in this range involve security checks.
  • The presence of symbols like WdFilter suggests Windows Defender operations, possibly indicating anti-malware activities happening or logged within this memory segment.
  • The repeated appearance of certain base addresses (MiSystemPartition) and operations (e.g., ExReleaseAutoExpandPushLockShared, KeSetEvent) highlights system-level management tasks, including synchronization and event signaling.
  • Additionally, there are references to Registry operations (e.g., CmpCallCallBacksEx, CmpParseKey), indicating some part of this memory is used for Registry access and manipulation.

Overall, the memory range contains a mix of low-level kernel operations, security checks, file system interactions, and system state management tasks, reflecting the complex and interwoven nature of operating system activities. This kind of data is typically used for deep debugging and analysis of system behavior, performance tuning, or troubleshooting specific issues.

Explain:
0: kd> dpp rsp
00000033`d2d7c1d8 00007ffe`1c9e705c 78c08500`00441f0f
00000033`d2d7c1e0 00007ffe`1ca0e818 00000000`00666544
00000033`d2d7c1e8 00000000`00001434
00000033`d2d7c1f0 0000015f`3fed7680 6f46203a`6c707041
00000033`d2d7c1f8 00007ffe`1ca07bea ccccccc3`28c48348
00000033`d2d7c200 00000000`000023b4
00000033`d2d7c208 0000015f`3db4c7b0 00000073`006c0043
00000033`d2d7c210 00000000`00000000
00000033`d2d7c218 00000000`00000000
00000033`d2d7c220 00000033`d2d7c2c8 00000000`04000000
00000033`d2d7c228 00007ffe`1ca02fb6 00000218`36ac8946
00000033`d2d7c230 00000033`d2d7c2c8 00000000`04000000
00000033`d2d7c238 00000000`00000000
00000033`d2d7c240 00007ffe`1ca1578c 00000000`00530025
00000033`d2d7c248 00007ffe`1ba95124 63656e6f`00000044
00000033`d2d7c250 00000000`00000000

The dpp command in the Windows Debugger (WinDbg) displays memory contents at the address specified by the stack pointer register (rsp) and attempts to resolve any pointers to their symbolic names, essentially showing a double word pointer list from the specified location.

Here’s a breakdown of the information provided by the output:

  • Each line shows two memory addresses. The left side shows the address being inspected, and the right side shows the content at that address, which may be a value or a pointer to another memory location. If the content is a pointer and a symbol is available, it will show the symbol name next to it.
  • For instance, the first line shows the memory address 00000033d2d7c1d8 contains the pointer 00007ffe1c9e705c, which doesn’t have an associated symbolic name provided in this snippet. This could be a function pointer, object pointer, or data pointer depending on the context which isn’t fully given here.
  • The output includes pointers to various memory locations, and some lines display what appears to be function pointers (e.g., 00007ffe1c9e705c) and possibly some constants or flags right next to them (e.g., 78c08500`00441f0f). Without more context or symbol information, it’s difficult to specify exactly what each value represents.
  • The snippet mentions several pointers that seem related to executable modules (indicated by the 7ffe segment in the addresses, which is common for user-mode addresses on a 64-bit system). These could point to functions or data structures within those modules.
  • Addresses like 0000015f3fed7680 or 0000015f3db4c7b0 appear to be heap or dynamically allocated memory addresses due to their range, which differs from the typical ranges used for executable modules or stack memory.

Without the full context, such as the associated source code, loaded modules list, or symbols, it’s challenging to derive a meaningful interpretation of what each pointer or value represents in this scenario. Typically, this command is used by developers or analysts to inspect the call stack, arguments to functions, or specific data structures in memory during debugging sessions to understand the state of an application or diagnose issues.

Please note, symbolic addresses may be Coincidental. Raw stack regions may also be treated as Rough Stack Trace with the corresponding Annotated Stack Traces.

- Dmitry Vostokov @ DumpAnalysis.org + TraceAnalysis.org -

Crash Dump Analysis Patterns (Part 292)

March 17th, 2024

Generative AI LLM models such as GPT-4 are very good at annotation and summarization of disassembly and may provide additional insight (although such insights should be treated with caution):

Summarize:
0: kd> ub fffff804`095c8c5f
WdFilter+0x38c3c:
fffff804`095c8c3c mov rcx,qword ptr [WdFilter+0x16000 (fffff804`095a6000)]
fffff804`095c8c43 mov edx,0Eh
fffff804`095c8c48 mov rcx,qword ptr [rcx+18h]
fffff804`095c8c4c call WdFilter+0x1150 (fffff804`09591150)
fffff804`095c8c51 mov rdi,qword ptr [rbp-39h]
fffff804`095c8c55 xor edx,edx
fffff804`095c8c57 lea ecx,[rdx+1]
fffff804`095c8c5a call WdFilter+0x57198 (fffff804`095e7198)

This sequence of instructions is from the WdFilter module, likely part of the Windows Defender filtering mechanism. The disassembled code provides a glimpse into how certain operations are performed within this module:

Instruction Breakdown:

  • The first instruction moves a value from a specific address within the WdFilter module into the rcx register. This address (WdFilter+0×16000) is likely a reference to a data structure or a function pointer used by the filter.
  • The mov edx, 0Eh instruction sets the edx register to 14 (in hexadecimal notation, 0Eh), which might be used as an argument for a subsequent function call or an operation code.
  • Another value is moved into rcx from the address pointed to by rcx+18h, updating rcx with a new address or value located 24 bytes (18h) from the initial reference. This suggests a traversal or access within a structured data or a chain of function pointers.
  • A call is made to another function within the WdFilter module (WdFilter+0×1150), indicating an internal operation or check being performed with the previously set parameters.
  • The value at rbp-39h is moved into the rdi register. This instruction likely retrieves a saved value or a pointer from the stack frame for use in subsequent operations.
  • The xor edx, edx instruction clears the edx register, setting it to zero. This is a common practice for resetting a register value efficiently.
  • The lea ecx,[rdx+1] instruction loads the effective address of edx+1 into ecx, effectively setting ecx to 1. This could be preparing an argument for the next function call.
  • Finally, a call is made to another function within the WdFilter module (WdFilter+0×57198), which could be part of the filtering, analysis, or action decision-making process based on the context set by the preceding instructions.

Summary:

This code snippet from the WdFilter module performs a series of data retrieval and setup operations before calling two internal functions. These functions could be involved in processing, analyzing, or taking actions on objects or events within the Windows Defender’s filtering system. The exact purpose of these operations would depend on the broader context of the WdFilter module’s functionality and the data structures it manipulates.

Please also note how instruction annotations are combined, for example, about xor and lea. This Disassembly Summary analysis pattern differs from Annotated Disassembly that is done by a debugger that has access to other parts of memory and meta and symbolic information not available to external text processing tools.

- Dmitry Vostokov @ DumpAnalysis.org + TraceAnalysis.org -