Trace Analysis Patterns (Part 161)

September 29th, 2018

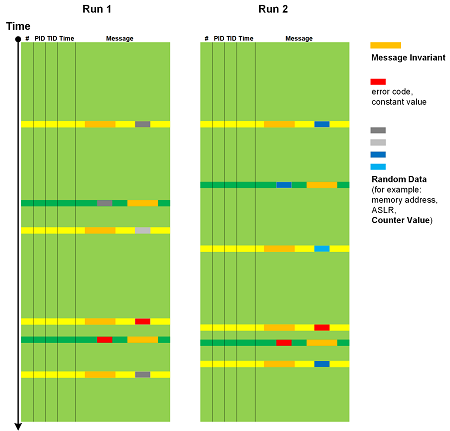
Trace and log message text usually consists of constant unchanging Message Invariants and some varying data. The latter can be classified into Random Data such as memory addresses, especially when ASLR is enabled, Counter Values, and variable data but constant in nature, such as error values and NULL pointer. Individual values from Signals are not considered random but their sequence can be. This analysis pattern is depicted in the following diagram (adopted from Data Association analysis pattern):

- Dmitry Vostokov @ DumpAnalysis.org + TraceAnalysis.org -

Trace Analysis Patterns (Part 160)

September 22nd, 2018

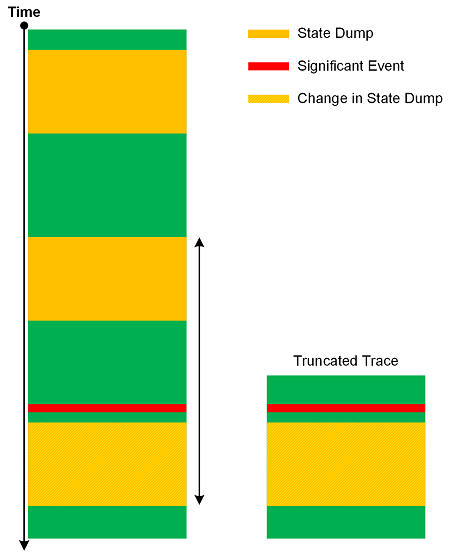
Sometimes, we ask for a log file to see State and Event pattern, and see it there, only to find that we cannot do Back Trace of State Dumps from some Significant Event for Inter-Correlation analysis because our Data Interval is truncated (Truncated Trace). This highlights the importance of proper tracing intervals that we call Significant Interval analysis pattern by analogy with significant digits in scientific measurements. The following diagram illustrate the pattern:

If you find out you get truncated traces and logs often you may want to increase Statement Current for state logging.

- Dmitry Vostokov @ DumpAnalysis.org + TraceAnalysis.org -

Trace Analysis Patterns (Part 159)

September 8th, 2018

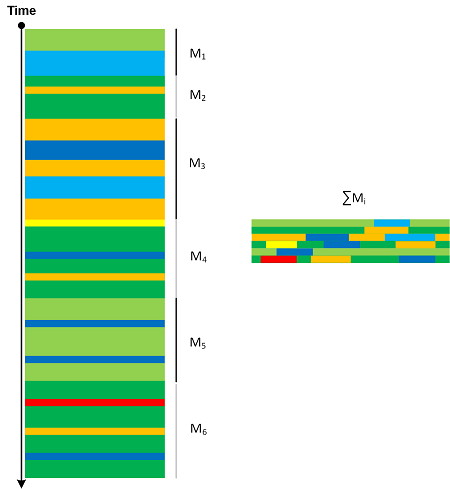
We can “integrate” trace message stream into another, smaller trace. By analogy with motivic integration in contemporary mathematics we call this analysis pattern Motivic Trace. There can be border cases where the whole trace is reduced to one message or every message is associated with a different message (perhaps shorter or a number). Message Sets that are integrated into Motivic Trace can be completely different (for example, based on Motives) in comparison with Quotient Trace where we reduce Message Sets that have the same common attribute.

- Dmitry Vostokov @ DumpAnalysis.org + TraceAnalysis.org -

Crash Dump Analysis Patterns (Part 8c)

August 11th, 2018

For completion, we introduce a managed space version of Hidden Exception in addition to user and kernel space variants.

0:000> ~*kL
[...]
13 Id: 1b70.1c2c Suspend: 0 Teb: 00446000 Unfrozen
# ChildEBP RetAddr
00 08e7ec4c 755e1cf3 ntdll!NtWaitForMultipleObjects+0xc
01 08e7ede0 6ef8bc6e KERNELBASE!WaitForMultipleObjectsEx+0x133
02 08e7ee30 6ef8b9b3 clr!WaitForMultipleObjectsEx_SO_TOLERANT+0x3c
03 08e7eebc 6ef8baa4 clr!Thread::DoAppropriateWaitWorker+0x237
04 08e7ef28 6ef8bc14 clr!Thread::DoAppropriateWait+0x64
05 08e7ef74 6eef648b clr!CLREventBase::WaitEx+0x128
06 08e7ef8c 6f0058f6 clr!CLREventBase::Wait+0x1a
07 08e7f018 6f005834 clr!AwareLock::EnterEpilogHelper+0xa8
08 08e7f060 6f005980 clr!AwareLock::EnterEpilog+0x48
09 08e7f078 6f00662c clr!AwareLock::Enter+0x4a
0a 08e7f104 08d71d79 clr!JITutil_MonEnterWorker+0x9c
WARNING: Frame IP not in any known module. Following frames may be wrong.
0b 08e7f120 6dd9608d 0x8d71d79
0c 08e7f12c 6ddc2925 mscorlib_ni+0x3c608d
0d 08e7f190 6ddc2836 mscorlib_ni+0x3f2925
0e 08e7f1a4 6ddc27f1 mscorlib_ni+0x3f2836
0f 08e7f1c0 6dd95fe8 mscorlib_ni+0x3f27f1
10 08e7f1d8 6ee6eaf6 mscorlib_ni+0x3c5fe8
11 08e7f1e4 6ee71d50 clr!CallDescrWorkerInternal+0x34
12 08e7f238 6ee77764 clr!CallDescrWorkerWithHandler+0x6b
13 08e7f2a0 6eef4d2d clr!MethodDescCallSite::CallTargetWorker+0x16a
14 08e7f414 6efae269 clr!ThreadNative::KickOffThread_Worker+0x173
15 08e7f428 6efae2d3 clr!ManagedThreadBase_DispatchInner+0x71
16 08e7f4cc 6efae3a0 clr!ManagedThreadBase_DispatchMiddle+0x7e
17 08e7f528 6ee7af05 clr!ManagedThreadBase_DispatchOuter+0x5b
18 08e7f534 6ee7aea2 clr!ManagedThreadBase_DispatchInCorrectAD+0x15
19 08e7f600 6ee7af4d clr!Thread::DoADCallBack+0x328
1a 08e7f624 6efae2d3 clr!ManagedThreadBase_DispatchInner+0x4e
1b 08e7f6c8 6efae3a0 clr!ManagedThreadBase_DispatchMiddle+0x7e
1c 08e7f724 6efae40f clr!ManagedThreadBase_DispatchOuter+0x5b
1d 08e7f748 6eef4be2 clr!ManagedThreadBase_FullTransitionWithAD+0x2f
1e 08e7f7c4 6eef62d1 clr!ThreadNative::KickOffThread+0x256
1f 08e7fbe4 76c28484 clr!Thread::intermediateThreadProc+0x55
20 08e7fbf8 77842fea kernel32!BaseThreadInitThunk+0x24
21 08e7fc40 77842fba ntdll!__RtlUserThreadStart+0x2f
22 08e7fc50 00000000 ntdll!_RtlUserThreadStart+0x1b
[...]

0:000> ~13s
eax=00000000 ebx=00000001 ecx=00000000 edx=00000000 esi=00000001 edi=00000001
eip=7784a7bc esp=08e7ec50 ebp=08e7ede0 iopl=0 nv up ei pl nz ac pe nc
cs=0023 ss=002b ds=002b es=002b fs=0053 gs=002b efl=00000216
ntdll!NtWaitForMultipleObjects+0xc:
7784a7bc c21400 ret 14h

0:013> !CLRStack
OS Thread Id: 0x1c2c (13)
Child SP IP Call Site
08e7efb4 7784a7bc [GCFrame: 08e7efb4]
08e7f094 7784a7bc [HelperMethodFrame_1OBJ: 08e7f094] System.Threading.Monitor.Enter(System.Object)
08e7f10c 08d71d79 UserQuery+ClassMain.thread_proc_1()
08e7f128 6dd9608d *** ERROR: Module load completed but symbols could not be loaded for mscorlib.ni.dll
System.Threading.ThreadHelper.ThreadStart_Context(System.Object)
08e7f134 6ddc2925 System.Threading.ExecutionContext.RunInternal(System.Threading.ExecutionContext, System.Threading.ContextCallback, System.Object, Boolean)
08e7f1a0 6ddc2836 System.Threading.ExecutionContext.Run(System.Threading.ExecutionContext, System.Threading.ContextCallback, System.Object, Boolean)
08e7f1b4 6ddc27f1 System.Threading.ExecutionContext.Run(System.Threading.ExecutionContext, System.Threading.ContextCallback, System.Object)
08e7f1cc 6dd95fe8 System.Threading.ThreadHelper.ThreadStart()
08e7f308 6ee6eaf6 [GCFrame: 08e7f308]
08e7f4e8 6ee6eaf6 [DebuggerU2MCatchHandlerFrame: 08e7f4e8]
08e7f554 6ee6eaf6 [ContextTransitionFrame: 08e7f554]
08e7f6e4 6ee6eaf6 [DebuggerU2MCatchHandlerFrame: 08e7f6e4]

0:013> !teb
TEB at 00446000
ExceptionList: 08e7edd0
StackBase: 08e80000
StackLimit: 08e7a000

SubSystemTib: 00000000
FiberData: 00001e00
ArbitraryUserPointer: 00000000
Self: 00446000
EnvironmentPointer: 00000000
ClientId: 00001b70 . 00001c2c
RpcHandle: 00000000
Tls Storage: 008eb8e8
PEB Address: 0040a000
LastErrorValue: 0
LastStatusValue: c0000034
Count Owned Locks: 0
HardErrorMode: 0

0:013> !DumpStackObjects 08e7a000 08e80000
OS Thread Id: 0×1c2c (13)
ESP/REG Object Name
08E7DD18 0270f714 LINQPad.ExecutionModel.OutPipe
08E7DD20 02736ca8 LINQPad.Disposable
08E7DD2C 0270f714 LINQPad.ExecutionModel.OutPipe
08E7DD3C 02736ca8 LINQPad.Disposable
08E7DD40 02736c88 System.Action
08E7DD44 02736ca8 LINQPad.Disposable
08E7DD64 0270f714 LINQPad.ExecutionModel.OutPipe
08E7DD98 02736ca8 LINQPad.Disposable
08E7DDB8 0270f714 LINQPad.ExecutionModel.OutPipe
08E7DE78 0270f9ec System.Object
08E7DE7C 0270f990 LINQPad.ObjectGraph.Formatters.HtmlWriter
08E7DEAC 0270f990 LINQPad.ObjectGraph.Formatters.HtmlWriter
08E7DEE4 0262e16c System.String
08E7DEF8 026aa9d0 System.String
08E7DF04 0270f990 LINQPad.ObjectGraph.Formatters.HtmlWriter
08E7E054 02724ecc System.Threading.ThreadHelper
08E7E058 026fad7c System.Threading.ContextCallback
08E7E06C 026fad7c System.Threading.ContextCallback
08E7E074 02724ecc System.Threading.ThreadHelper
08E7E0A8 0272fb68 System.NullReferenceException
08E7E0AC 026fad7c System.Threading.ContextCallback
08E7E0B8 02724ecc System.Threading.ThreadHelper
08E7E340 0272fcc0 System.Runtime.CompilerServices.RuntimeHelpers+TryCode
08E7E344 0272fce0 System.Runtime.CompilerServices.RuntimeHelpers+CleanupCode
08E7E348 0272fca4 System.Environment+ResourceHelper+GetResourceStringUserData
08E7E35C 0272fce0 System.Runtime.CompilerServices.RuntimeHelpers+CleanupCode
08E7E378 0272fca4 System.Environment+ResourceHelper+GetResourceStringUserData
08E7E37C 0272fc0c System.Environment+ResourceHelper
08E7E964 0272fb68 System.NullReferenceException
08E7EB3C 02724ecc System.Threading.ThreadHelper
08E7ECCC 02724ecc System.Threading.ThreadHelper
08E7ECD0 026fad7c System.Threading.ContextCallback
08E7ECD8 0272fa88 System.String critical section 1
08E7EFE8 0272fabc System.String critical section 2
08E7F034 026fad7c System.Threading.ContextCallback
08E7F088 02724ecc System.Threading.ThreadHelper
08E7F08C 026fad7c System.Threading.ContextCallback
08E7F0B8 02724ecc System.Threading.ThreadHelper
08E7F0C0 026fad7c System.Threading.ContextCallback
08E7F0F0 0272fabc System.String critical section 2
08E7F11C 026fad7c System.Threading.ContextCallback
08E7F128 02724f00 System.Threading.ExecutionContext
08E7F134 02724e98 System.Threading.Thread
08E7F144 02724e98 System.Threading.Thread
08E7F188 02724f00 System.Threading.ExecutionContext
08E7F18C 026fad7c System.Threading.ContextCallback
08E7F19C 02724ecc System.Threading.ThreadHelper
08E7F1B0 02724ecc System.Threading.ThreadHelper
08E7F1B8 02724ecc System.Threading.ThreadHelper
08E7F1BC 02724f00 System.Threading.ExecutionContext
08E7F1C8 02724ecc System.Threading.ThreadHelper
08E7F244 02724ee0 System.Threading.ThreadStart
08E7F2C4 02724ee0 System.Threading.ThreadStart
08E7F2D8 02724ee0 System.Threading.ThreadStart

The example dump can be downloaded from here.

- Dmitry Vostokov @ DumpAnalysis.org + TraceAnalysis.org -
Crash Dump Analysis Patterns (Part 256)

August 4th, 2018

Backwards disassembling used in memory analysis patterns such as Coincidental Symbolic Information may be ambiguous and can show Wild Code output. This may also be debugger disassembling algorithm dependent. For example, default 8-instruction backwards disassembly shows this code:

0:011> ub 00007ff8`cdc9b4bf
00007ff8`cdc9b4ab 855948 test dword ptr [rcx+48h],ebx
00007ff8`cdc9b4ae b988bf03a8 mov ecx,0A803BF88h
00007ff8`cdc9b4b3 f4 hlt
00007ff8`cdc9b4b4 0100 add dword ptr [rax],eax
00007ff8`cdc9b4b6 00488b add byte ptr [rax-75h],cl
00007ff8`cdc9b4b9 09e8 or eax,ebp
00007ff8`cdc9b4bb 117236 adc dword ptr [rdx+36h],esi
00007ff8`cdc9b4be 5f pop rdi

However, if we specify the number of instructions to disassemble except 7 and 8 we get a different result (which is more correct from the forward code execution view since we disassembled the saved return address from the stack region):

0:011> ub 00007ff8`cdc9b4bf L1
00007ff8`cdc9b4ba e81172365f call clr!JIT_MonEnter (00007ff9`2d0026d0)

0:011> ub 00007ff8`cdc9b4bf L2
00007ff8`cdc9b4b7 488b09 mov rcx,qword ptr [rcx]
00007ff8`cdc9b4ba e81172365f call clr!JIT_MonEnter (00007ff9`2d0026d0)

0:011> k L10
# Child-SP RetAddr Call Site
00 0000002a`fc23e308 00007ff9`53d06099 ntdll!NtWaitForMultipleObjects+0x14
01 0000002a`fc23e310 00007ff9`2d1a96be KERNELBASE!WaitForMultipleObjectsEx+0xf9
02 0000002a`fc23e610 00007ff9`2d1a951c clr!WaitForMultipleObjectsEx_SO_TOLERANT+0x62
03 0000002a`fc23e670 00007ff9`2d1a9315 clr!Thread::DoAppropriateWaitWorker+0x1e4
04 0000002a`fc23e770 00007ff9`2d0c2b7f clr!Thread::DoAppropriateWait+0x7d
05 0000002a`fc23e7f0 00007ff9`2d1aa491 clr!CLREventBase::WaitEx+0xc4
06 0000002a`fc23e880 00007ff9`2d1aa39e clr!AwareLock::EnterEpilogHelper+0xc2
07 0000002a`fc23e940 00007ff9`2d1c1a92 clr!AwareLock::EnterEpilog+0x62
08 0000002a`fc23e9a0 00007ff8`cdc9b4bf clr!JITutil_MonEnterWorker+0xe2
09 0000002a`fc23eb40 00007ff9`275231d3 0×00007ff8`cdc9b4bf
0a 0000002a`fc23eb80 00007ff9`27523064 mscorlib_ni+0×5031d3
0b 0000002a`fc23ec50 00007ff9`27523032 mscorlib_ni+0×503064
0c 0000002a`fc23ec80 00007ff9`2751c812 mscorlib_ni+0×503032
0d 0000002a`fc23ecd0 00007ff9`2d006bb3 mscorlib_ni+0×4fc812
0e 0000002a`fc23ed10 00007ff9`2d006a70 clr!CallDescrWorkerInternal+0×83
0f 0000002a`fc23ed50 00007ff9`2d00735d clr!CallDescrWorkerWithHandler+0×4e

We call this analysis pattern Disassembly Ambiguity. The example dump can be downloaded from here.

- Dmitry Vostokov @ DumpAnalysis.org + TraceAnalysis.org -
Trace Analysis Patterns (Part 158)

June 28th, 2018

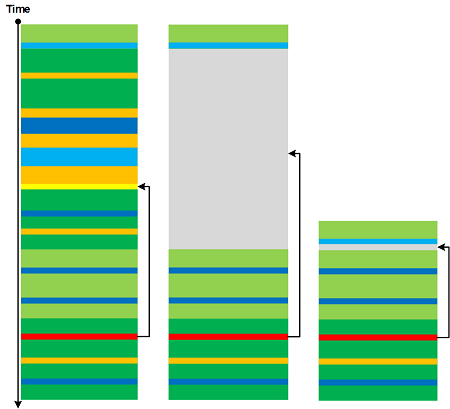
Using the metaphor of renormalization from physics we introduce Renormalization trace and log analysis pattern where a selected message and its Message Context are replaced by a single message:

- Dmitry Vostokov @ DumpAnalysis.org + TraceAnalysis.org -
Trace Analysis Patterns (Part 157)

May 13th, 2018

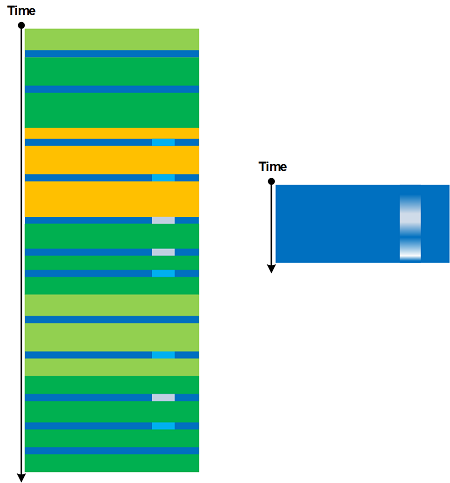
According to the definition in “Topological Signal Processing” by Michael Robinson (ISBN: 978-3662522844) “a signal consists of a collection of related measurements” (p. 5). For traces and logs we can apply the similar definition and consider Signal as a collection of local messages having the same Message Invariant and related variable data values. Signals are examples of Message Sets. The typical example are sets of related Counter Value messages. Signals can be obtained by obtaining Adjoint Thread of Activity of a specific message (to filter out Background Components “noise”) as illustrated in the following diagram:

Generally, the variable “measurement” part can form Braid of Activity.

We introduce Signal analysis pattern to bridge the gap between Software Narratology and Hardware Narratology.

- Dmitry Vostokov @ DumpAnalysis.org + TraceAnalysis.org -
Crash Dump Analysis Patterns (Part 255)

March 11th, 2018

A virtual memory may contain regions that are memories of some other processes or systems. We do not consider the ordinary case of memory-mapped regions here but the case of type 2 hypervisor. In such a case, memory regions may be “physical memories” of Virtualized Systems. For example, we discovered such a region in crashed vmware-vmx.exe process memory dump:

0:007> !address -summary

--- Usage Summary ---------------- RgnCount ----------- Total Size -------- %ofBusy %ofTotal
Free 231 7ffe`d009b000 ( 127.995 TB) 100.00%
<unknown> 518 1`2508e000 ( 4.579 GB) 96.41% 0.00%
Image 547 0`07056000 ( 112.336 MB) 2.31% 0.00%
Heap 73 0`0216a000 ( 33.414 MB) 0.69% 0.00%
Stack 81 0`01b00000 ( 27.000 MB) 0.56% 0.00%
Other 11 0`001d0000 ( 1.813 MB) 0.04% 0.00%
TEB 27 0`00036000 ( 216.000 kB) 0.00% 0.00%
PEB 1 0`00001000 ( 4.000 kB) 0.00% 0.00%

--- Type Summary (for busy) ------ RgnCount ----------- Total Size -------- %ofBusy %ofTotal
MEM_MAPPED 88 1`0e25a000 ( 4.221 GB) 88.88% 0.00%
MEM_PRIVATE 623 0`1aca5000 ( 428.645 MB) 8.81% 0.00%
MEM_IMAGE 547 0`07056000 ( 112.336 MB) 2.31% 0.00%

--- State Summary ---------------- RgnCount ----------- Total Size -------- %ofBusy %ofTotal
MEM_FREE 231 7ffe`d009b000 ( 127.995 TB) 100.00%
MEM_COMMIT 1185 1`27657000 ( 4.616 GB) 97.18% 0.00%
MEM_RESERVE 73 0`088fe000 ( 136.992 MB) 2.82% 0.00%

--- Protect Summary (for commit) - RgnCount ----------- Total Size -------- %ofBusy %ofTotal
PAGE_READWRITE 473 1`1f38b000 ( 4.488 GB) 94.49% 0.00%
PAGE_READONLY 400 0`04a05000 ( 74.020 MB) 1.52% 0.00%
PAGE_EXECUTE_READ 196 0`0367a000 ( 54.477 MB) 1.12% 0.00%
PAGE_WRITECOPY 59 0`001de000 ( 1.867 MB) 0.04% 0.00%
PAGE_READWRITE|PAGE_GUARD 27 0`00051000 ( 324.000 kB) 0.01% 0.00%
PAGE_NOACCESS 27 0`0001b000 ( 108.000 kB) 0.00% 0.00%
PAGE_EXECUTE_READWRITE 3 0`00003000 ( 12.000 kB) 0.00% 0.00%

--- Largest Region by Usage ----------- Base Address -------- Region Size ----------
Free 290`ffe50000 7d66`9b210000 ( 125.401 TB)
<unknown> 28f`f8f90000 1`00000000 ( 4.000 GB)
Image 7ffa`9969f000 0`00e47000 ( 14.277 MB)
Heap 28f`95c7b000 0`00ae4000 ( 10.891 MB)
Stack b8`f7b00000 0`000fc000 (1008.000 kB)
Other 28f`f2050000 0`00181000 ( 1.504 MB)
TEB b8`f7147000 0`00002000 ( 8.000 kB)
PEB b8`f7146000 0`00001000 ( 4.000 kB)

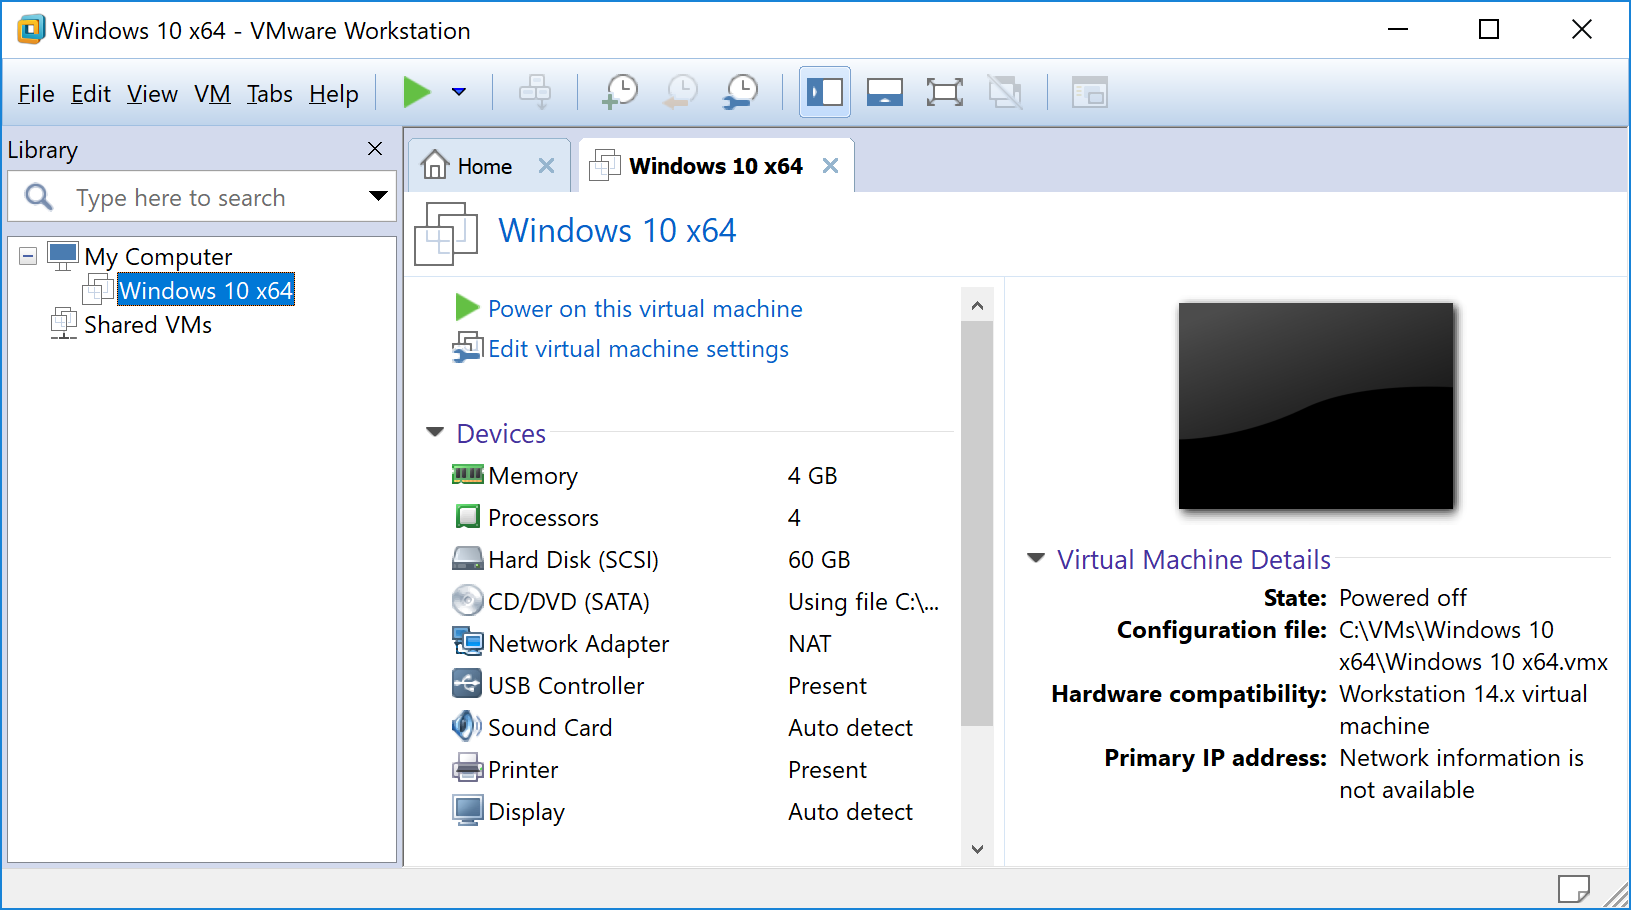
The size of the region is 4 GB which coincides with the size of Windows VM:

We assume that the whole VM physical space was placed there and we had an instance of a physical memory dump inside a process memory dump. Whatever is such a physical memory dump internal organization, most likely the pages correspond to 4 Kb memory chunks inside. We can employ WinDbg commands that allow the address parameter. For example, we can look for Hidden Modules:

0:007> .imgscan /r 28f`f8f90000 L?1`00000000
[…]
MZ at 00000290`f5867000 - size 7f000
Name: HAL.dll
[…]
MZ at 00000290`a089b000 - size 3000
Name: TDI.SYS
[…]

0:007> !dh 00000290`a089b000

File Type: DLL
FILE HEADER VALUES
14C machine (i386)
2 number of sections
592AD310 time date stamp Sun May 28 06:39:28 2017

0 file pointer to symbol table
0 number of symbols
E0 size of optional header
2122 characteristics
Executable
App can handle >2gb addresses
32 bit word machine
DLL

OPTIONAL HEADER VALUES
10B magic #
9.00 linker version
A00 size of code
400 size of initialized data
0 size of uninitialized data
0 address of entry point
1000 base of code
----- new -----
ffffffff8a7d0000 image base
1000 section alignment
200 file alignment
3 subsystem (Windows CUI)
10.00 operating system version
10.00 image version
5.01 subsystem version
3000 size of image
400 size of headers
10F33 checksum
0000000000040000 size of stack reserve
0000000000001000 size of stack commit
0000000000100000 size of heap reserve
0000000000001000 size of heap commit
540 DLL characteristics
Dynamic base
NX compatible
No structured exception handler
1140 [ 73A] address [size] of Export Directory
0 [ 0] address [size] of Import Directory
2000 [ 3E8] address [size] of Resource Directory
0 [ 0] address [size] of Exception Directory
0 [ 0] address [size] of Security Directory
0 [ 0] address [size] of Base Relocation Directory
1000 [ 1C] address [size] of Debug Directory
0 [ 0] address [size] of Description Directory
0 [ 0] address [size] of Special Directory
0 [ 0] address [size] of Thread Storage Directory
0 [ 0] address [size] of Load Configuration Directory
0 [ 0] address [size] of Bound Import Directory
0 [ 0] address [size] of Import Address Table Directory
0 [ 0] address [size] of Delay Import Directory
0 [ 0] address [size] of COR20 Header Directory
0 [ 0] address [size] of Reserved Directory

SECTION HEADER #1
.text name
87A virtual size
1000 virtual address
A00 size of raw data
400 file pointer to raw data
0 file pointer to relocation table
0 file pointer to line numbers
0 number of relocations
0 number of line numbers
60000020 flags
Code
(no align specified)
Execute Read

Debug Directories(1)
Type Size Address Pointer
cv 20 101c 41c Format: RSDS, guid, 1, tdi.pdb

SECTION HEADER #2
.rsrc name
3E8 virtual size
2000 virtual address
400 size of raw data
E00 file pointer to raw data
0 file pointer to relocation table
0 file pointer to line numbers
0 number of relocations
0 number of line numbers
40000040 flags
Initialized Data
(no align specified)
Read Only
[...]

We call such pattern Hyperdump:

- Dmitry Vostokov @ DumpAnalysis.org + TraceAnalysis.org -
Crash Dump Analysis Patterns (Part 254)

January 31st, 2018

Sometimes we can diagnose potential data races by looking at Stack Trace Collection (from all processes and threads or from CPUs). For example, if we have one Exception Stack Trace and a very similar stack trace, for example, with Constant Subtrace and the same Stack Trace Motif, it may point to such a situation with potential diagnosis of related components. Here’s an example from a kernel memory dump where it was suggested as a workaround to close ProcessA before hibernating a system (the problem repeatedly happened on wake up):

0: kd> !analyze -v

[...]

KERNEL_SECURITY_CHECK_FAILURE (139)
A kernel component has corrupted a critical data structure. The corruption
could potentially allow a malicious user to gain control of this machine.
Arguments:
Arg1: 0000000000000003, A LIST_ENTRY has been corrupted (i.e. double remove).
Arg2: ffff8900ea8fae40, Address of the trap frame for the exception that caused the bugcheck
Arg3: ffff8900ea8fad98, Address of the exception record for the exception that caused the bugcheck
Arg4: 0000000000000000, Reserved

[...]

EXCEPTION_RECORD: ffff8900ea8fad98 -- (.exr 0xffff8900ea8fad98)
ExceptionAddress: fffff8034a9e2e93 (nt!CmpFreeKeyControlBlock+0x0000000000106a73)
ExceptionCode: c0000409 (Security check failure or stack buffer overrun)
ExceptionFlags: 00000001
NumberParameters: 1
Parameter[0]: 0000000000000003
Subcode: 0x3 FAST_FAIL_CORRUPT_LIST_ENTRY

[...]

0: kd> k
# Child-SP RetAddr Call Site
00 ffff8900`ea8fab18 fffff803`4a576ba9 nt!KeBugCheckEx
01 ffff8900`ea8fab20 fffff803`4a576f50 nt!KiBugCheckDispatch+0x69
02 ffff8900`ea8fac60 fffff803`4a575286 nt!KiFastFailDispatch+0xd0
03 ffff8900`ea8fae40 fffff803`4a9e2e93 nt!KiRaiseSecurityCheckFailure+0x3c6
04 ffff8900`ea8fafd0 fffff803`4a8c444b nt!CmpFreeKeyControlBlock+0×106a73
05 ffff8900`ea8fb000 fffff803`4a8e1392 nt!CmpDoParseKey+0×2adb
06 ffff8900`ea8fb3d0 fffff803`4a8bdd61 nt!CmpParseKey+0×302
07 ffff8900`ea8fb570 fffff803`4a8d3a2d nt!ObpLookupObjectName+0xb71
08 ffff8900`ea8fb740 fffff803`4a8d370d nt!ObOpenObjectByNameEx+0×1dd
09 ffff8900`ea8fb880 fffff803`4a8cfc5f nt!CmOpenKey+0×29d
0a ffff8900`ea8fba40 fffff803`4a576683 nt!NtOpenKeyEx+0xf
0b ffff8900`ea8fba80 00007ffc`ac3b82b4 nt!KiSystemServiceCopyEnd+0×13
0c 00000001`2c0feb28 00000000`00000000 0×00007ffc`ac3b82b4

0: kd> !stacks 2 nt!Cmp

[...]

[ffffaa0a35ccb2c0 winlogon.exe]
13dc.002668 ffffaa0a37e02080 fff4e8f4 RUNNING nt!KeBugCheckEx
nt!KiBugCheckDispatch+0×69
nt!KiFastFailDispatch+0xd0
nt!KiRaiseSecurityCheckFailure+0×3c6

nt!CmpFreeKeyControlBlock+0×106a73
nt!CmpDoParseKey+0×2adb
nt!CmpParseKey+0×302
nt!ObpLookupObjectName+0xb71
nt!ObOpenObjectByNameEx+0×1dd
nt!CmOpenKey+0×29d
nt!NtOpenKeyEx+0xf

nt!KiSystemServiceCopyEnd+0×13
+0×7ffcac3b82b4

[...]

[ffffaa0a35bda780 ProcessA.exe]
1794.0017e4 ffffaa0a35c06080 fff4e8f4 RUNNING nt!CmpLockKcbStackShared+0×2
nt!CmpWalkOneLevel+0×93
nt!CmpDoParseKey+0×1c36
nt!CmpParseKey+0×302
nt!ObpLookupObjectName+0xb71
nt!ObOpenObjectByNameEx+0×1dd
nt!CmOpenKey+0×29d
nt!NtOpenKeyEx+0xf

nt!KiSystemServiceCopyEnd+0×13
+0×7ffcac3b82b4

[...]

[ffffaa0a35bb8780 svchost.exe]
1754.001fec ffffaa0a3636a7c0 fff4e8f4 READY nt!KxDispatchInterrupt+0x122
nt!KiDpcInterrupt+0x3a6
nt!KeAbPreAcquire+0xd7
nt!ExfAcquirePushLockExclusiveEx+0x10b
nt!CmpDoParseKey+0×294e
nt!CmpParseKey+0×302
nt!ObpLookupObjectName+0xb71
nt!ObOpenObjectByNameEx+0×1dd
nt!CmOpenKey+0×29d
nt!NtOpenKeyEx+0xf

nt!KiSystemServiceCopyEnd+0×13
+0×7ffcac3b82b4

[...]

We call this pattern Stack Trace Race.

- Dmitry Vostokov @ DumpAnalysis.org + TraceAnalysis.org -
Trace Analysis Patterns (Part 156)

January 18th, 2018

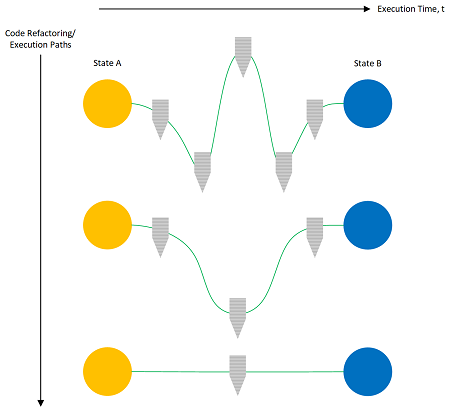
We have analysis patterns that compare changes in software traces and logs during different executions (Master Trace) and during the evolution of software itself (Meta Trace). Such patterns are general enough, and often we are interested in their restriction to different execution paths or changes in code that leave start and end software states invariant:

We call such analysis pattern Trace Homotopy by analogy with homotopy in mathematics where a curve or sequence of operations can vary with constant endpoints.

- Dmitry Vostokov @ DumpAnalysis.org + TraceAnalysis.org -

Trace Analysis Patterns (Part 155)

November 26th, 2017

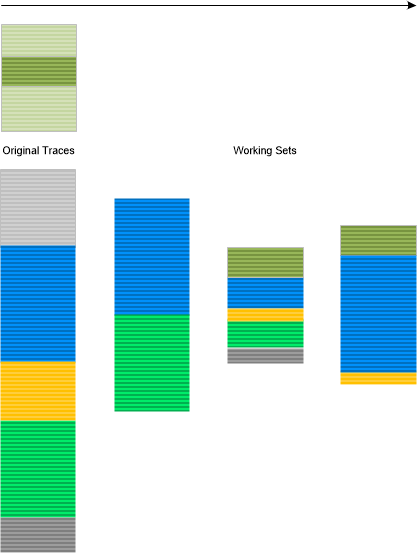
When we analyze traces and logs we work with only a small subset of log messages. We call any such current subset Working Set by analogy with working sets in operating system memory paging implementations:

This analysis pattern can also be reconciled with an operadic approach to trace and log analysis by chaining appropriate diagnostic operads from the original traces to the desired working sets:

- Dmitry Vostokov @ DumpAnalysis.org + TraceAnalysis.org -
Crash Dump Analysis Patterns (Part 134b)

November 25th, 2017

This is a variant of Data Correlation (function parameters) analysis pattern where we look at correlations across memory structures. Simple arithmetical ratios may link such structures and correlate corresponding behavioral processes. Here we look at a recent instance of calc.exe consuming a lot of CPU. Upon the discovery of that process we were curious and saved its full process memory dump via Task Manager. In the dump we discovered 4 Spiking Threads:

0:000> !runaway f
User Mode Time
Thread       Time
13:1b68      0 days 1:51:39.906
10:23a8      0 days 1:51:37.796

11:1b98      0 days 0:00:09.890
14:88c       0 days 0:00:09.828

1:2eb4      0 days 0:00:00.390
18:2a44      0 days 0:00:00.015
19:28f0      0 days 0:00:00.000
17:22c0      0 days 0:00:00.000
16:232c      0 days 0:00:00.000
15:2008      0 days 0:00:00.000
12:2880      0 days 0:00:00.000
9:2f38      0 days 0:00:00.000
8:1a98      0 days 0:00:00.000
7:1dcc      0 days 0:00:00.000
6:c58       0 days 0:00:00.000
5:1550      0 days 0:00:00.000
4:2938      0 days 0:00:00.000
3:2b64      0 days 0:00:00.000
2:2f90      0 days 0:00:00.000
0:dc4       0 days 0:00:00.000
[…]

We see that 10/13 approx. equals 1 and #11/#14 too, or #10/#11 approx. equals #13/#14 in user mode CPU consumption. If we look at kernel times we see the same ratios:

[...]
Kernel Mode Time
Thread Time
10:23a8 0 days 0:10:36.718
13:1b68 0 days 0:10:32.968

14:88c 0 days 0:00:23.859
11:1b98 0 days 0:00:23.812

1:2eb4 0 days 0:00:00.218
2:2f90 0 days 0:00:00.015
0:dc4 0 days 0:00:00.015
19:28f0 0 days 0:00:00.000
18:2a44 0 days 0:00:00.000
17:22c0 0 days 0:00:00.000
16:232c 0 days 0:00:00.000
15:2008 0 days 0:00:00.000
12:2880 0 days 0:00:00.000
9:2f38 0 days 0:00:00.000
8:1a98 0 days 0:00:00.000
7:1dcc 0 days 0:00:00.000
6:c58 0 days 0:00:00.000
5:1550 0 days 0:00:00.000
4:2938 0 days 0:00:00.000
3:2b64 0 days 0:00:00.000
[…]

Elapsed times are also correlated and we see that correlated threads were created in pairs {#10, #11} and {#13, #14}:

[...]
Elapsed Time
Thread Time
0:dc4 0 days 18:20:55.778
1:2eb4 0 days 18:20:55.731
2:2f90 0 days 18:20:55.725
3:2b64 0 days 18:20:55.721
4:2938 0 days 18:20:55.715
5:1550 0 days 18:20:55.582
6:c58 0 days 18:20:55.522
7:1dcc 0 days 18:20:55.522
8:1a98 0 days 18:20:55.522
9:2f38 0 days 18:20:55.522
10:23a8 0 days 16:12:52.330
11:1b98 0 days 16:12:52.329
12:2880 0 days 16:12:52.195
13:1b68 0 days 16:11:44.822
14:88c 0 days 16:11:44.821
15:2008 0 days 16:11:44.693
16:232c 0 days 2:09:35.021
17:22c0 0 days 2:05:13.038
18:2a44 0 days 0:23:38.000
19:28f0 0 days 0:00:24.261

This suggests that the threads are related. We call such analysis pattern variant Data Correlation (CPU times). It may also help in finding weak Coupled Processes.

- Dmitry Vostokov @ DumpAnalysis.org + TraceAnalysis.org -
Crash Dump Analysis Patterns (Part 253)

November 25th, 2017

Usually threads are Blocked waiting for synchronization objects or Active running threads. There is a different category of threads that appear blocked in user space but in fact may be doing a lot of invisible work (not visible from the dump type) in kernel space. We call such an analysis pattern System Call. Compare these thread Stack Traces from Stack Trace Collection:

# Call Site
00 ntdll!NtWaitForMultipleObjects
01 KERNELBASE!WaitForMultipleObjectsEx
02 user32!MsgWaitForMultipleObjectsEx
03 combase!ASTAWaitContext::KernelWait
04 combase!ASTAWaitContext::Wait
05 combase!CoMsgWaitInProcessEvents
06 Windows_UI!Windows::UI::Core::CDispatcher::WaitAndProcessMessages
07 Windows_UI!Windows::UI::Core::CDispatcher::ProcessEvents
08 Windows_UI_Xaml!CJupiterWindow::RunCoreWindowMessageLoop
09 Windows_UI_Xaml!CJupiterControl::RunMessageLoop
0a Windows_UI_Xaml!DirectUI::DXamlCore::RunMessageLoop
0b twinapi_appcore!Windows::ApplicationModel::Core::CoreApplicationView::Run
[...]
0e kernel32!BaseThreadInitThunk
0f ntdll!RtlUserThreadStart

# Call Site
00 user32!NtUserCallNoParam
01 user32!MsgWaitForMultipleObjectsEx
02 combase!ASTAWaitContext::KernelWait
03 combase!ASTAWaitContext::Wait
04 combase!CoMsgWaitInProcessEvents
05 Windows_UI!Windows::UI::Core::CDispatcher::WaitAndProcessMessages
06 Windows_UI!Windows::UI::Core::CDispatcher::ProcessEvents
07 Windows_UI_Xaml!CJupiterWindow::RunCoreWindowMessageLoop
08 Windows_UI_Xaml!CJupiterControl::RunMessageLoop
09 Windows_UI_Xaml!DirectUI::DXamlCore::RunMessageLoop
0a twinapi_appcore!Windows::ApplicationModel::Core::CoreApplicationView::Run
[…]
0d kernel32!BaseThreadInitThunk
0e ntdll!RtlUserThreadStart

The first is traditionally waiting, but the other was waked up to process an input message and may be other blocked in kernel or doing some work there. In case of a doubt we can double check the last executed instruction (from the stack trace perspective):

# Child-SP          RetAddr           Call Site
00 000000b9`358bf068 00007ffd`3de0a3be user32!NtUserCallNoParam+0xa
01 000000b9`358bf070 00007ffd`3dbdc106 user32!MsgWaitForMultipleObjectsEx+0×15e
[…]

0:000> ub user32!NtUserCallNoParam+0xa
user32!NtUserInvalidateRect:
00007ffd`3de1fc90 4c8bd1          mov     r10,rcx
00007ffd`3de1fc93 b807100000      mov     eax,1007h
00007ffd`3de1fc98 0f05            syscall
00007ffd`3de1fc9a c3              ret
00007ffd`3de1fc9b 0f1f440000      nop     dword ptr [rax+rax]
user32!NtUserCallNoParam:
00007ffd`3de1fca0 4c8bd1          mov     r10,rcx
00007ffd`3de1fca3 b808100000      mov     eax,1008h
00007ffd`3de1fca8 0f05            syscall

System Calls (especially discovered in unmanaged Execution Residue data and from Past Stack Traces reconstruction from raw stack regions and Historical Information) may aid in memory forensics (broadly speaking as reconstruction of past behaviour) in addition to System Objects.

- Dmitry Vostokov @ DumpAnalysis.org + TraceAnalysis.org -
Trace Analysis Patterns (Part 154)

October 4th, 2017

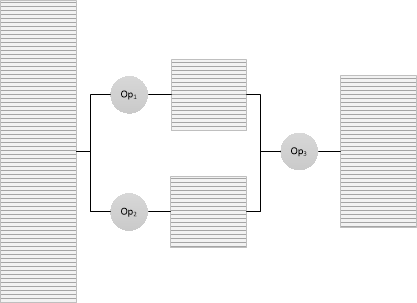
Messages that contain scripting statements can be signs of malnarratives that resulted from log injection during attempts to exploit possible cross channel scripting (XCS) and cross-site scripting (XSS) vulnerabilities. Such Script Messages may be spread across a log as illustrated in the following diagram:

- Dmitry Vostokov @ DumpAnalysis.org + TraceAnalysis.org -
Trace Analysis Patterns (Part 153)

August 6th, 2017

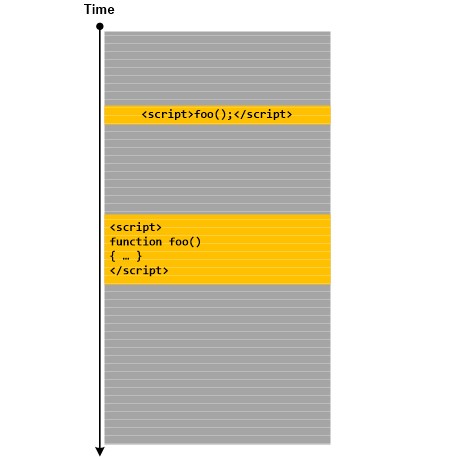
We can associate a function with a domain of trace messages (M) to some other range either continuous (T) or discreet (D). We call this analysis pattern Trace Field by analogy with fields in physics:

Or, in general, Trace Field, is a functor between the domain of the category of trace messages (M) and a codomain of some other category, not necessarily numerical. Typical examples include Trace Presheaves and Fiber Bundles. Another example, for generalized logs, is Memory Fibration taken to extreme.

- Dmitry Vostokov @ DumpAnalysis.org + TraceAnalysis.org -
Trace Analysis Patterns (Part 152)

August 2nd, 2017

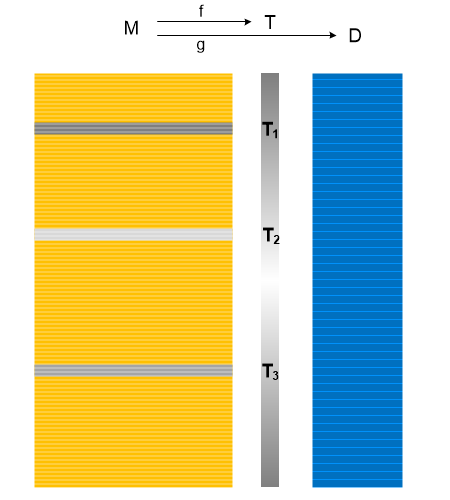
Sometimes we have variable sequences of Significant Events when we expect the certain constant number of such events in repeated normal and problem cases. For example, in repeated normal cases we expect more than 10 of events but in repeated abnormal cases - just 2 events. The latter cases would indicate that something happened inside the processing of the second event. But if one or more such cases contain 3 or 4 events that would point to some external influence that aborted the sequence of events. We call such variable event sequences Hedges by analogy with hedge variables or variadic variables. One of the recent example that we encountered involved multiple abnormal cases with just 2 events. We were about to investigate the internals of the second event but noticed that one of the cases contained 3 events. Further analysis indicated that the whole sequence was aborted by some external process after reaching the certain timeout. In the case of 3 events the first 2 happened too earlier and that allowed for the 3rd event to happen before the timeout was triggered:

- Dmitry Vostokov @ DumpAnalysis.org + TraceAnalysis.org -
Trace Analysis Patterns (Part 151)

July 20th, 2017

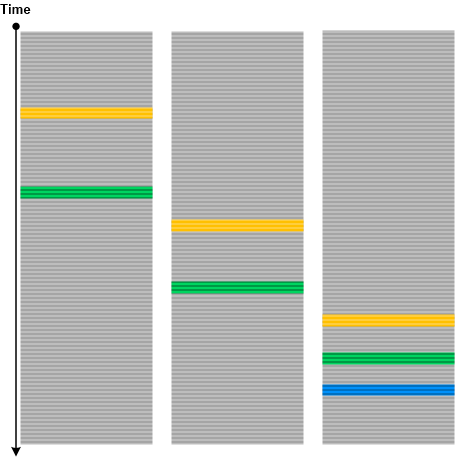
Certain types of blind SQL injection attacks may leave log messages with just one byte difference. We call with analysis pattern Ultrasimilar Messages by analogy with an ultrametric space in mathematics and the interpretation of messages as p-adic numbers. Since, such messages may be scattered in a log we can choose Message Pattern based on some Message Invariant (for example, parts of SQL request) and then analyze its Fiber of Activity (for example, Data Flow of its variable part). A log with two different types of Ultrasimilar Messages is shown in the following diagram:

- Dmitry Vostokov @ DumpAnalysis.org + TraceAnalysis.org -
Trace Analysis Patterns (Part 150)

May 22nd, 2017

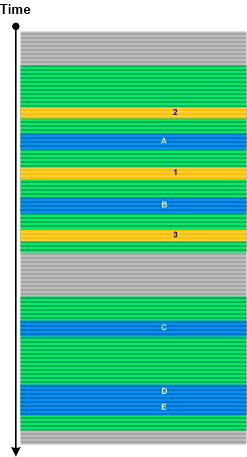
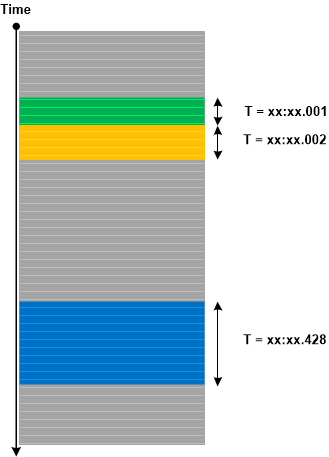
Sometimes we are interested in Message Set that has the same time attribute value (or rounded to some digit). We call this analysis pattern Activity Packet by analogy with wave packets. It may allow identification of related threads and activities.

It is different from Activity Quantum analysis pattern where time attribute value may change for continuous Message Set with the same thread id.

- Dmitry Vostokov @ DumpAnalysis.org + TraceAnalysis.org -
Crash Dump Analysis Patterns (Part 252)

May 21st, 2017

Some Stack Traces reveal a functional purpose, for example, painting, querying a database, doing HTML or JavaScript processing, loading a file, printing, or something else. Such traces from various Stack Trace Collections (unmanaged, managed, predicate, CPUs) may be compared for similarity and help with analysis patterns, such as examples in Wait Chain (C++11 condition variable, SRW lock), finding semantically Coupled Processes, and many others where we look at the meaning of stack trace frame sequences to relate them to each other. We call this analysis pattern Stack Trace Motif by analogy with Motif trace and log analysis pattern. Longer stack traces may contain several Motives and also Technology-Specific Subtraces (for example, COM interface invocation frames).

- Dmitry Vostokov @ DumpAnalysis.org + TraceAnalysis.org -

Crash Dump Analysis Patterns (Part 42o)

May 20th, 2017

Slim Reader/Writer locks are available from Windows Vista and sometimes we can see them in Stack Trace Collection. Although, at the time of this writing, there is no WinDbg support for them, the techniques described in the example for C++11 condition variable Wait Chain analysis pattern can be used. Here is an example where we used semantics of stack trace similarity such as “rendering” to find the stack trace of the possible owner thread:

0:000> ~*k

[...]

4  Id: be4.2af4 Suspend: 0 Teb: 7efa1000 Unfrozen
# ChildEBP RetAddr
00 0414bfe8 776e2157 ntdll_77670000!NtWaitForKeyedEvent+0×15
01 0414c054 5c9c3f8e ntdll_77670000!RtlAcquireSRWLockExclusive+0×12e

02 0414c06c 5ca2ad83 mshtml!TSmartResource<CDXRenderLock>::Acquire<enum DXLock::Type>+0×5e
03 0414c09c 5cdffa63 mshtml!CDXSystem::CheckAndHandleDeviceReset+0×43
04 0414c0b0 5cdff9eb mshtml!CDoc::CheckAndHandleDeviceReset+0×23
05 0414c130 5cabe82e mshtml!CDoc::OnPaint+0xcb
06 0414c164 5c9d632b mshtml!CServer::OnWindowMessage+0xfb
07 0414c324 5c9bbcb0 mshtml!CDoc::OnWindowMessage+0×24c
08 0414c354 76ea62fa mshtml!CServer::WndProc+0×58
09 0414c380 76ea731e user32!InternalCallWinProc+0×23
0a 0414c3f8 76ea6ded user32!UserCallWinProcCheckWow+0xd8
0b 0414c458 76ea6e4c user32!DispatchClientMessage+0xec
0c 0414c494 7768011a user32!__fnDWORD+0×2b
0d 0414c4cc 76eb1342 ntdll_77670000!KiUserCallbackDispatcher+0×2e
0e 0414c514 76ea789a user32!DispatchMessageWorker+0×442
0f 0414c524 5f69a97c user32!DispatchMessageW+0xf
10 0414f6f4 5f6dc648 ieframe!CTabWindow::_TabWindowThreadProc+0×464
11 0414f7b4 7543dbfc ieframe!LCIETab_ThreadProc+0×3e7
12 0414f7cc 6b303a31 iertutil!_IsoThreadProc_WrapperToReleaseScope+0×1c
13 0414f804 7696338a IEShims!NS_CreateThread::DesktopIE_ThreadProc+0×94
14 0414f810 776a9902 kernel32!BaseThreadInitThunk+0xe
15 0414f850 776a98d5 ntdll_77670000!__RtlUserThreadStart+0×70
16 0414f868 00000000 ntdll_77670000!_RtlUserThreadStart+0×1b

[...]

23  Id: be4.b88 Suspend: 0 Teb: 7ef4a000 Unfrozen
# ChildEBP RetAddr
00 0f3cbb60 76a815ce ntdll_77670000!NtWaitForSingleObject+0x15
01 0f3cbbcc 76961194 KERNELBASE!WaitForSingleObjectEx+0x98
02 0f3cbbe4 76961148 kernel32!WaitForSingleObjectExImplementation+0x75
03 0f3cbbf8 746a5aa5 kernel32!WaitForSingleObject+0x12
04 0f3cbcac 6aef2f6c dwmapi!DwmpDxGetWindowSharedSurface+0x374
05 0f3cc198 6aef1c2e dxgi!CDXGISwapChain::PresentImpl+0x6fa
06 0f3cc1f0 5d59339f dxgi!CDXGISwapChain::Present+0x5d
07 0f3cc214 5cea42bc mshtml!CDXSwapChainTargetSurface::OnPresent+0x2f
08 0f3cc240 5cea360d mshtml!CDXRenderTarget::Present+0×5c
09 0f3cc5c4 5cdbf5e1 mshtml!CPaintHandler::RenderInternal+0xad3
0a 0f3cc5f0 5ca1da8e mshtml!CPaintController::Render+0×39
0b 0f3cc630 5ce8692b mshtml!CRenderTaskDrawInPlace::Execute+0xc1
0c 0f3cc66c 5ca1c4c9 mshtml!CRenderTaskQueue::AddRenderTask+0xd2
0d 0f3cc6e0 5ca1a466 mshtml!CView::RenderInPlace+0×3cd
0e 0f3cc718 5ca1a4d4 mshtml!CDoc::PaintWorker+0×24d
0f 0f3cc738 5ca2983b mshtml!CDoc::PaintInPlace+0×40
10 0f3cc76c 5ca2978a mshtml!CPaintController::RunRenderingLoop+0×68

11 0f3cc790 5ca1180c mshtml!CPaintController::OnUpdateBeat+0×66
12 0f3cc7cc 5ca2a7af mshtml!CPaintBeat::OnBeat+0×234
13 0f3cc7f8 5c9bd27b mshtml!CPaintBeat::OnVSyncMethodCall+0×86
14 0f3cc840 5c9bc99c mshtml!GlobalWndOnMethodCall+0×17b
15 0f3cc894 76ea62fa mshtml!GlobalWndProc+0×103
16 0f3cc8c0 76ea6d3a user32!InternalCallWinProc+0×23
17 0f3cc938 76ea77d3 user32!UserCallWinProcCheckWow+0×109
18 0f3cc99c 76ea789a user32!DispatchMessageWorker+0×3cb
19 0f3cc9ac 5f69a97c user32!DispatchMessageW+0xf
1a 0f3cfb7c 5f6dc648 ieframe!CTabWindow::_TabWindowThreadProc+0×464
1b 0f3cfc3c 7543dbfc ieframe!LCIETab_ThreadProc+0×3e7
1c 0f3cfc54 6b303a31 iertutil!_IsoThreadProc_WrapperToReleaseScope+0×1c
1d 0f3cfc8c 7696338a IEShims!NS_CreateThread::DesktopIE_ThreadProc+0×94
1e 0f3cfc98 776a9902 kernel32!BaseThreadInitThunk+0xe
1f 0f3cfcd8 776a98d5 ntdll_77670000!__RtlUserThreadStart+0×70
20 0f3cfcf0 00000000 ntdll_77670000!_RtlUserThreadStart+0×1b

[...]

28  Id: be4.17c8 Suspend: 0 Teb: 7ef3d000 Unfrozen
# ChildEBP RetAddr
00 0ee2c988 776e2157 ntdll_77670000!NtWaitForKeyedEvent+0×15
01 0ee2c9f4 5c9c3f8e ntdll_77670000!RtlAcquireSRWLockExclusive+0×12e

02 0ee2ca0c 5cc69e25 mshtml!TSmartResource<CDXRenderLock>::Acquire<enum DXLock::Type>+0×5e
03 0ee2ca3c 5cc71743 mshtml!CDXSystemShared::PurgeResourceCaches+0×29
04 0ee2ca50 5cc7170d mshtml!CDXSystem::~CDXSystem+0×1d
05 0ee2ca5c 5cc716e6 mshtml!RefCounted<CDXSystem,SingleThreadedRefCount>::`vector deleting destructor’+0xd
06 0ee2ca6c 5c9bea0d mshtml!RefCounted<CDXSystem,SingleThreadedRefCount>::Release+0×2d
07 0ee2ca7c 5cc6a734 mshtml!TSmartPointer<Windows::Foundation::IAsyncOperation<Windows::Foundation:: Collections::IMapView<HSTRING__ *,Windows::Storage::Streams::RandomAccessStreamReference *> *> >::~TSmartPointer<Windows::Foundation::IAsyncOperation<Windows::Foundation:: Collections::IMapView<HSTRING__ *,Windows::Storage::Streams::RandomAccessStreamReference *> *> >+0×1d
08 0ee2ca84 5cc6a6e0 mshtml!DeinitRenderSystem+0×14
09 0ee2caa0 5cc6a63a mshtml!DeinitThreadStateStruct<void (__stdcall*)(EXTENDEDTHREADSTATE *),EXTENDEDTHREADSTATE>+0×22
0a 0ee2cab0 5d272f1d mshtml!DeinitExtendedThreadState+0×24
0b 0ee2cacc 5cabd85e mshtml!_DecrementObjectCount+0×79
0c 0ee2cad8 5f78b662 mshtml!CBaseLockCF::LockServer+0×4a
0d 0ee2cafc 5f797c4d ieframe!CBaseBrowser2::~CBaseBrowser2+0×265
0e 0ee2cb08 5f797c2e ieframe!CShellBrowser2::`vector deleting destructor’+0xd
0f 0ee2cb24 5f78e7bf ieframe!CShellBrowser2::Release+0×47
10 0ee2fcf4 5f6dc648 ieframe!CTabWindow::_TabWindowThreadProc+0×83e
11 0ee2fdb4 7543dbfc ieframe!LCIETab_ThreadProc+0×3e7
12 0ee2fdcc 6b303a31 iertutil!_IsoThreadProc_WrapperToReleaseScope+0×1c
13 0ee2fe04 7696338a IEShims!NS_CreateThread::DesktopIE_ThreadProc+0×94
14 0ee2fe10 776a9902 kernel32!BaseThreadInitThunk+0xe
15 0ee2fe50 776a98d5 ntdll_77670000!__RtlUserThreadStart+0×70
16 0ee2fe68 00000000 ntdll_77670000!_RtlUserThreadStart+0×1b

- Dmitry Vostokov @ DumpAnalysis.org + TraceAnalysis.org -