Archive for the ‘WinDbg Tips and Tricks’ Category
Tuesday, November 25th, 2008
I’m pleased to announce that OpenTask has submitted the book Dumps, Bugs and Debugging Forensics: The Adventures of Dr. Debugalov for printing and here is the link to TOC:
Table of Contents
- Dmitry Vostokov @ DumpAnalysis.org -
Posted in Announcements, Books, Bugtations, Cartoons, Certification, Code Reading, Crash Dump Analysis, Crash Dumps for Dummies, Debugging, Fun with Crash Dumps, Memory Analysis Forensics and Intelligence, New Words, Philosophy, Publishing, Science of Memory Dump Analysis, Software Technical Support, Testing, WinDbg Tips and Tricks | No Comments »
Monday, November 24th, 2008
Thanks to shellexecute I got the news of this release. Remember, you can always access quick download links from www.windbg.org.
Dmitry Vostokov @ DumpAnalysis.org -
Posted in Announcements, Crash Dump Analysis, Debugging, Software Technical Support, Tools, WinDbg Tips and Tricks | 4 Comments »
Monday, November 10th, 2008
While working on WinDbg command cards and even before that when compiling a comparison table for both WinDbg and GDB I came to an idea of abstract debugging commands that correspond to common debugging tasks, have clear syntax and semantics and serve metaphorically as a basis for conversion of analog thinking to digital debugger assistance (see analog-to-digital conversion for ADC abbreviation). Here a WinDbg extension can help but now I think about using a tree-based approach similar to CMDTREE.TXT for CDA Checklist. More on this later. Any comments or suggestions are greatly appreciated.
- Dmitry Vostokov @ DumpAnalysis.org -
Posted in Announcements, Crash Dump Analysis, Debugging, Software Architecture, Software Technical Support, WinDbg Tips and Tricks | 2 Comments »
Monday, November 10th, 2008
Suddenly the course of my publishing activities bended a little to produce a DIY poster and learning cards to be published soon. Here are the product details:
Annotation:
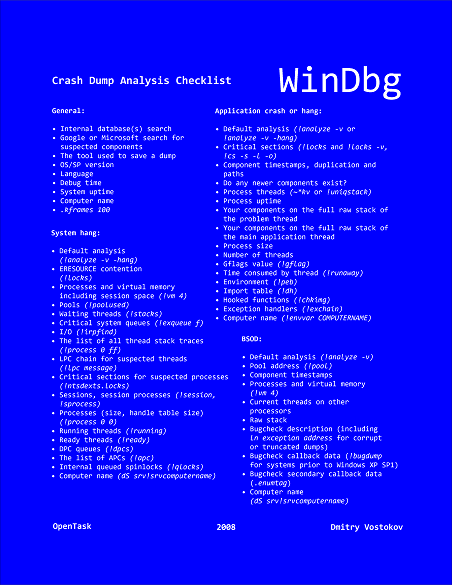
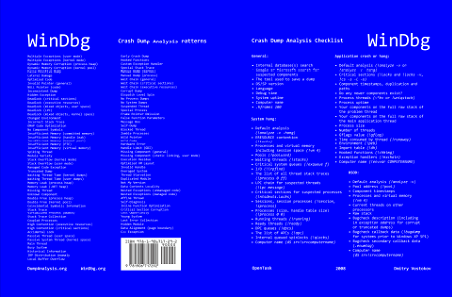
WinDbg is a powerful debugger from Microsoft Debugging Tools for Windows. It has more than 350 commands that can be used in different debugging scenarios. The cover of this book is a poster featuring crash dump analysis checklist and common patterns seen in memory dumps and live debugging sessions. Inside the book you can find ready to cut learning cards with commands and their descriptions coloured according to their use for crash dump or live debugging sessions and user, kernel or complete memory dumps. Tossing cards can create unexpected connections between commands and help to learn them more quickly. Uncut pages can also serve as birds eye view to WinDbg debugging capabilities. More than 350 WinDbg commands including meta-commands and extensions are included.
- Title: WinDbg: A Reference Poster and Learning Cards
- Authors: Dmitry Vostokov
- Publisher: Opentask (20 November 2008)
- Language: English
- Product Dimensions: 28.0 x 21.6
- ISBN-13: 978-1-906717-29-2
- Paperback: 20 pages
Book Excerpt
Front cover:
Back cover:
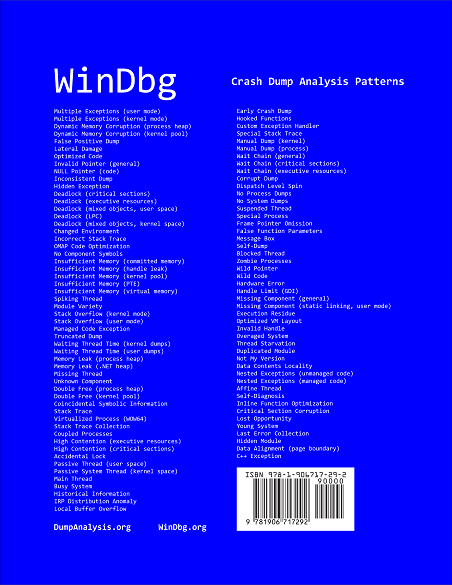
After you take inside pages out you are left with a cover that you can use as a crash dump analysis checklist and patterns poster:
I also plan to update this book on a yearly basis.
- Dmitry Vostokov @ DumpAnalysis.org -
Posted in Announcements, Books, Crash Dump Analysis, Crash Dump Patterns, Debugging, Publishing, Software Technical Support, Tools, Training and Seminars, WinDbg Scripts, WinDbg Tips and Tricks, WinDbg for GDB Users | 3 Comments »
Friday, October 31st, 2008
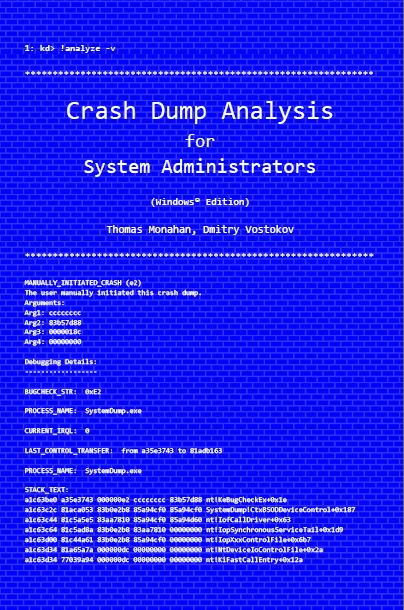
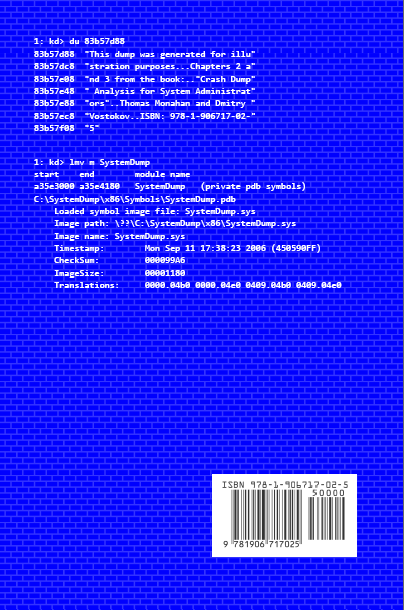
Previously announced book Crash Dump Analysis for System Administrators and Support Engineers (Windows Edition) has got its draft cover featuring WinDbg output from a kernel memory dump forced by Citrix SystemDump tool.
Front:
Back:
- Dmitry Vostokov @ DumpAnalysis.org -
Posted in Announcements, Books, Citrix, Crash Dump Analysis, Crash Dumps for Dummies, Minidump Analysis, Publishing, Security, Software Technical Support, Testing, Tools, Training and Seminars, Vista, WinDbg Tips and Tricks, Windows Server 2008 | No Comments »
Saturday, October 18th, 2008
Paperback edition of Memory Dump Analysis Anthology, Volume 2 is finally available on Amazon and Barnes & Noble. Search Inside is also available on Amazon. In addition, I updated the list of recommended books:
Listmania! Crash Dump Analysis and Debugging
Hardcover edition will be available on Amazon and B&N in 2-3 weeks.
- Dmitry Vostokov @ DumpAnalysis.org -
Posted in Announcements, Assembly Language, Books, Bugchecks Depicted, CDF Analysis Tips and Tricks, Certification, Citrix, Common Mistakes, Crash Dump Analysis, Crash Dump Patterns, Crash Dumps for Dummies, Data Recovery, DebugWare Patterns, Debugging, Fun with Crash Dumps, Hardware, Kernel Development, Memory Analysis Forensics and Intelligence, Memory Dump Analysis Jobs, Memory Visualization, Minidump Analysis, Music for Debugging, New Words, Philosophy, Publishing, Science of Memory Dump Analysis, Security, Software Architecture, Software Technical Support, Stack Trace Collection, Testing, Tools, Training and Seminars, Troubleshooting Methodology, Virtualization, Vista, WinDbg Scripts, WinDbg Tips and Tricks, WinDbg for GDB Users, Windows Server 2008 | No Comments »
Saturday, October 11th, 2008
Seems railroad to it was a success: just got this message in my e-mail:
“Congratulations on passing your recent Microsoft Certification exam, inspiring confidence for your employer, your peers, and yourself with a widely-recognized validation of your skills on Microsoft technology.“
Because I haven’t done any exam since Windows Internals beta I assumed that I passed it and I was right! After registering at Microsoft certification site as MCP I was able to build my logo:
_1125.png)
Here is the link to Exam 70-660 information and required skills:
http://www.microsoft.com/learning/en/us/Exams/70-660.aspx
- Dmitry Vostokov @ DumpAnalysis.org -
Posted in Announcements, Assembly Language, Bugchecks Depicted, Certification, Citrix, Crash Dump Analysis, Debugging, Hardware, Kernel Development, Memory Analysis Forensics and Intelligence, Minidump Analysis, Software Technical Support, Tools, Training and Seminars, WinDbg Tips and Tricks | 6 Comments »
Friday, October 3rd, 2008
“Everything is memory dump.”
I’m very excited to announce that Volume 2 is available in paperback, hardcover and digital editions:
Memory Dump Analysis Anthology, Volume 2
In one or two weeks paperback edition should also appear on Amazon and other bookstores. Amazon hardcover edition is planned to be available by the end of October.
I’m often asked when Volume 3 is available and I currently plan to release it in October - November, 2009. In the mean time I’m planning to concentrate on other publishing projects.
- Dmitry Vostokov @ DumpAnalysis.org -
Posted in Announcements, Assembly Language, Books, Bugchecks Depicted, CDF Analysis Tips and Tricks, Citrix, Common Mistakes, Crash Dump Analysis, Crash Dump Patterns, Crash Dumps for Dummies, Data Recovery, DebugWare Patterns, Debugging, Fun with Crash Dumps, Kernel Development, Memory Analysis Forensics and Intelligence, Memory Dump Analysis Jobs, Memory Visualization, Minidump Analysis, Music for Debugging, New Words, Philosophy, Publishing, Science of Memory Dump Analysis, Security, Software Architecture, Software Technical Support, Stack Trace Collection, Testing, Tools, Training and Seminars, Troubleshooting Methodology, Virtualization, Vista, WinDbg Scripts, WinDbg Tips and Tricks, WinDbg for GDB Users, Windows Server 2008 | No Comments »
Wednesday, October 1st, 2008
The book is nearly finished and here is the final TOC:
Memory Dump Analysis Anthology, Volume 2: Table of Contents
- Dmitry Vostokov @ DumpAnalysis.org -
Posted in Announcements, Assembly Language, Books, Bugchecks Depicted, CDF Analysis Tips and Tricks, Citrix, Common Mistakes, Crash Dump Analysis, Crash Dump Patterns, Crash Dumps for Dummies, Data Recovery, DebugWare Patterns, Debugging, Fun with Crash Dumps, Kernel Development, Memory Dump Analysis Jobs, Memory Visualization, Minidump Analysis, Music for Debugging, Publishing, Science of Memory Dump Analysis, Security, Software Technical Support, Stack Trace Collection, Tools, Troubleshooting Methodology, Virtualization, Vista, WinDbg Scripts, WinDbg Tips and Tricks, WinDbg for GDB Users, Windows Server 2008 | No Comments »
Tuesday, September 30th, 2008
Today Citrix officially joined the club of public symbol server companies! Please refer to the following article for details:
How to Use the Citrix Symbol Server to Obtain Debug Symbols
- Dmitry Vostokov @ DumpAnalysis.org -
Posted in Announcements, Citrix, Crash Dump Analysis, Crash Dumps for Dummies, Debugging, Minidump Analysis, Software Technical Support, Stack Trace Collection, Tools, Vista, WinDbg Tips and Tricks, Windows Server 2008 | 4 Comments »
Friday, September 19th, 2008
Previously I introduced Hooked Functions pattern where I used !chkimg WinDbg command and today after accidentally discovering yet another patched DLL module in one process I created this simple command to check all modules:
!for_each_module !chkimg -lo 50 -d !${@#ModuleName} -v
0:000:x86> !for_each_module !chkimg -lo 50 -d !${@#ModuleName} -v

[...]

Scanning section:    .text

Size: 74627

Range to scan: 71c01000-71c13383

71c02430-71c02434  5 bytes - WS2_32!WSASend

[ 8b ff 55 8b ec:e9 cb db 1c 0d ]

71c0279b-71c0279f  5 bytes - WS2_32!select (+0x36b)

[ 6a 14 68 58 28:e9 60 d8 15 0d ]

71c0290e-71c02912  5 bytes - WS2_32!WSASendTo (+0x173)

[ 8b ff 55 8b ec:e9 ed d6 1b 0d ]

71c02cb2-71c02cb6  5 bytes - WS2_32!closesocket (+0x3a4)

[ 8b ff 55 8b ec:e9 49 d3 19 0d ]

71c02e12-71c02e16  5 bytes - WS2_32!WSAIoctl (+0x160)

[ 8b ff 55 8b ec:e9 e9 d1 1e 0d ]

71c02ec2-71c02ec6  5 bytes - WS2_32!send (+0xb0)

[ 8b ff 55 8b ec:e9 39 d1 14 0d ]

71c02f7f-71c02f83  5 bytes - WS2_32!recv (+0xbd)

[ 8b ff 55 8b ec:e9 7c d0 17 0d ]

71c03c04-71c03c08  5 bytes - WS2_32!WSAGetOverlappedResult (+0xc85)

[ 8b ff 55 8b ec:e9 f7 c3 1f 0d ]

71c03c75-71c03c79  5 bytes - WS2_32!recvfrom (+0x71)

[ 8b ff 55 8b ec:e9 86 c3 16 0d ]

71c03d14-71c03d18  5 bytes - WS2_32!sendto (+0x9f)

[ 8b ff 55 8b ec:e9 e7 c2 13 0d ]

71c03da8-71c03dac  5 bytes - WS2_32!WSACleanup (+0x94)

[ 8b ff 55 8b ec:e9 53 c2 25 0d ]

71c03f38-71c03f3c  5 bytes - WS2_32!WSASocketW (+0x190)

[ 6a 20 68 08 40:e9 c3 c0 11 0d ]

71c0446a-71c0446e  5 bytes - WS2_32!connect (+0x532)

[ 8b ff 55 8b ec:e9 91 bb 18 0d ]

71c04f3b-71c04f3f  5 bytes - WS2_32!WSAStartup (+0xad1)

[ 6a 14 68 60 50:e9 c0 b0 29 0d ]

71c06162-71c06166  5 bytes - WS2_32!shutdown (+0x1227)

[ 8b ff 55 8b ec:e9 99 9e 12 0d ]

71c069e9-71c069ed  5 bytes - WS2_32!WSALookupServiceBeginW (+0x887)

[ 8b ff 55 8b ec:e9 12 96 0f 0d ]

71c06c91-71c06c95  5 bytes - WS2_32!WSALookupServiceNextW (+0x2a8)

[ 8b ff 55 8b ec:e9 6a 93 10 0d ]

71c06ecd-71c06ed1  5 bytes - WS2_32!WSALookupServiceEnd (+0x23c)

[ 8b ff 55 8b ec:e9 2e 91 0e 0d ]

71c090be-71c090c2  5 bytes - WS2_32!WSAEventSelect (+0x21f1)

[ 8b ff 55 8b ec:e9 3d 6f 20 0d ]

71c09129-71c0912d  5 bytes - WS2_32!WSACreateEvent (+0x6b)

[ 33 c0 50 50 6a:e9 d2 6e 22 0d ]

71c0938e-71c09392  5 bytes - WS2_32!WSACloseEvent (+0x265)

[ 6a 0c 68 c8 93:e9 6d 6c 24 0d ]

71c093d9-71c093dd  5 bytes - WS2_32!WSAWaitForMultipleEvents (+0x4b)

[ 8b ff 55 8b ec:e9 22 6c 1a 0d ]

71c093ea-71c093ee  5 bytes - WS2_32!WSAEnumNetworkEvents (+0x11)

[ 8b ff 55 8b ec:e9 11 6c 21 0d ]

71c09480-71c09484  5 bytes - WS2_32!WSARecv (+0x96)

[ 8b ff 55 8b ec:e9 7b 6b 1d 0d ]

71c0eecb-71c0eecf  5 bytes - WS2_32!WSACancelAsyncRequest (+0x5a4b)

[ 8b ff 55 8b ec:e9 30 11 26 0d ]

71c10d39-71c10d3d  5 bytes - WS2_32!WSAAsyncSelect (+0x1e6e)

[ 8b ff 55 8b ec:e9 c2 f2 26 0d ]

71c10ee3-71c10ee7  5 bytes - WS2_32!WSAConnect (+0x1aa)

[ 8b ff 55 8b ec:e9 18 f1 22 0d ]

71c10f9f-71c10fa3  5 bytes - WS2_32!WSAAccept (+0xbc)

[ 8b ff 55 8b ec:e9 5c f0 27 0d ]

Total bytes compared: 74627(100%)

Number of errors: 140

140 errors : !WS2_32 (71c02430-71c10fa3)

[...]
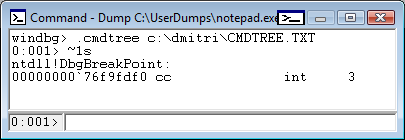
CMDTREE.TXT was also updated with this command.
- Dmitry Vostokov @ DumpAnalysis.org -
Posted in Crash Dump Analysis, Crash Dump Patterns, Debugging, Malware Analysis, Security, WinDbg Tips and Tricks | 2 Comments »
Thursday, September 18th, 2008
Thanks to Roberto Farah who blogged about .cmdtree command I was able to create the first version of cmdtree.txt for Crash Dump Analysis Checklist to include common commands that I use. It can be found here:
CMDTREE.TXT for .cmdtree WinDbg command
The link to the file was also added to:
http://www.windbg.org/
Here is the screenshot of it:
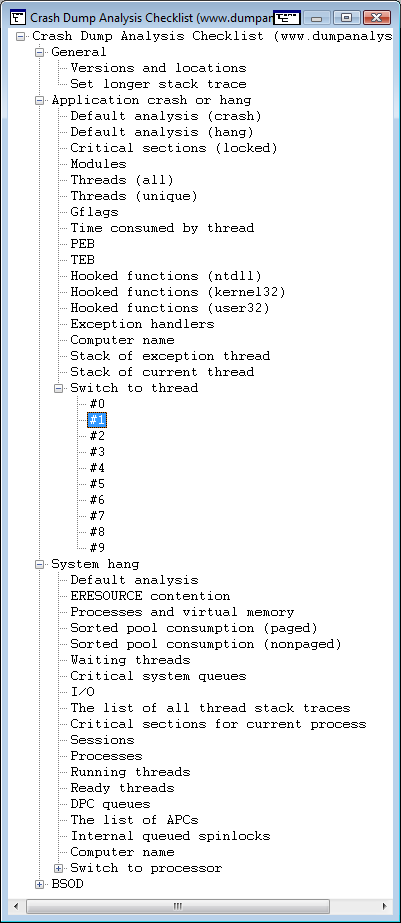
It is useful for complex commands including command sequences and scripts. You can also include special guidelines and reminders as well. In the latter cases you can specify empty command or output something you prefer with .echo, for example command templates to fill manually.
This seems to be similar to EasyDbg.
- Dmitry Vostokov @ DumpAnalysis.org -
Posted in Announcements, Crash Dump Analysis, Debugging, WinDbg Tips and Tricks | 3 Comments »
Thursday, September 11th, 2008
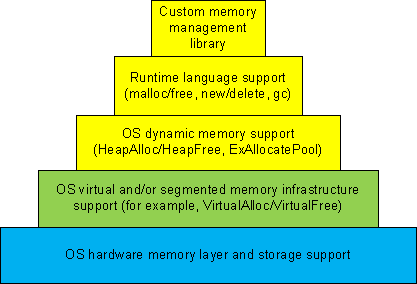
Dynamic memory allocation architecture usually consists of different layers where the lower layers provide support for the upper ones and some general layers can be combined or omitted like in TCP/IP implementation of OSI reference model:
-
1a. Custom memory management library.
-
1b. Runtime language support (malloc/free, new/delete, gc).
-
1c. OS dynamic memory support (HeapAlloc/HeapFree, ExAllocatePool/ExFreePool).
-
2. OS virtual and/or segmented memory infrastructure support (VirtualAlloc/VirtualFree).
-
3. OS hardware memory layer and storage support.
We can call it DMI (Dynamic Memory Infrastructure) and this can be summarized on the following diagram:
First-order memory leaks happen when an application uses layers 1a, 1b or 1c and doesn’t free allocated memory. Typical pattern examples include:
What we cover here are second-order leaks in layers 2 an 3. These include cases when an application frees memory but the underlying supporting layer doesn’t due to its design or factors like fragmentation. Consider an example of a Windows service that undergone committed memory increase from 600Mb to almost 1.2Gb during peak hours and then remained at that size even when no activity happened afterwards. We can examine virtual memory statistics using !address WinDbg command from 3 sampled memory dumps:
Before peak hours:
-------------------- Usage SUMMARY --------------------------

    TotSize (      KB)   Pct(Tots) Pct(Busy)   Usage

    734d000 (  118068) : 05.63%    07.50%    : RegionUsageIsVAD

   1ff11000 (  523332) : 24.96%    00.00%    : RegionUsageFree

    4352000 (   68936) : 03.29%    04.38%    : RegionUsageImage

    5a00000 (   92160) : 04.39%    05.86%    : RegionUsageStack

      5a000 (     360) : 00.02%    00.02%    : RegionUsageTeb

   4efe3000 ( 1294220) : 61.72%    82.24%    : RegionUsageHeap

          0 (       0) : 00.00%    00.00%    : RegionUsagePageHeap

       1000 (       4) : 00.00%    00.00%    : RegionUsagePeb

       1000 (       4) : 00.00%    00.00%    : RegionUsageProcessParametrs

       1000 (       4) : 00.00%    00.00%    : RegionUsageEnvironmentBlock

       Tot: 7fff0000 (2097088 KB) Busy: 600df000 (1573756 KB)
-------------------- Type SUMMARY --------------------------

    TotSize (      KB)   Pct(Tots)  Usage

   1ff11000 (  523332) : 24.96%   : <free>

    4352000 (   68936) : 03.29%   : MEM_IMAGE

     b78000 (   11744) : 00.56%   : MEM_MAPPED

   5b215000 ( 1493076) : 71.20%   : MEM_PRIVATE
-------------------- State SUMMARY --------------------------

    TotSize (      KB)   Pct(Tots)  Usage

   25e50000 (  620864) : 29.61%   : MEM_COMMIT

   1ff11000 (  523332) : 24.96%   : MEM_FREE

   3a28f000 (  952892) : 45.44%   : MEM_RESERVE
During peak hours:
-------------------- Usage SUMMARY --------------------------

  TotSize ( KB) Pct(Tots) Pct(Busy) Usage

  734d000 ( 118068) : 05.63% 07.49% : RegionUsageIsVAD

  1fd0f000 ( 521276) : 24.86% 00.00% : RegionUsageFree

  4352000 ( 68936) : 03.29% 04.37% : RegionUsageImage

  5c00000 ( 94208) : 04.49% 05.98% : RegionUsageStack

  5c000 ( 368) : 00.02% 00.02% : RegionUsageTeb

4efe3000 ( 1294220) : 61.72% 82.13% : RegionUsageHeap

  0 ( 0) : 00.00% 00.00% : RegionUsagePageHeap

  1000 ( 4) : 00.00% 00.00% : RegionUsagePeb

  1000 ( 4) : 00.00% 00.00% : RegionUsageProcessParametrs

  1000 ( 4) : 00.00% 00.00% : RegionUsageEnvironmentBlock

  Tot: 7fff0000 (2097088 KB) Busy: 602e1000 (1575812 KB)
-------------------- Type SUMMARY --------------------------

  TotSize ( KB) Pct(Tots) Usage

  1fd0f000 ( 521276) : 24.86% :

  4352000 ( 68936) : 03.29% : MEM_IMAGE

  b78000 ( 11744) : 00.56% : MEM_MAPPED

  5b417000 ( 1495132) : 71.30% : MEM_PRIVATE
-------------------- State SUMMARY --------------------------

  TotSize ( KB) Pct(Tots) Usage

41498000 ( 1069664) : 51.01% : MEM_COMMIT

  1fd0f000 ( 521276) : 24.86% : MEM_FREE

  1ee49000 ( 506148) : 24.14% : MEM_RESERVE
After peak hours:
-------------------- Usage SUMMARY --------------------------

    TotSize (      KB)   Pct(Tots) Pct(Busy)   Usage

    734d000 (  118068) : 05.63%    07.49%    : RegionUsageIsVAD

   1fd0f000 (  521276) : 24.86%    00.00%    : RegionUsageFree

    4352000 (   68936) : 03.29%    04.37%    : RegionUsageImage

    5c00000 (   94208) : 04.49%    05.98%    : RegionUsageStack

      5c000 (     368) : 00.02%    00.02%    : RegionUsageTeb

   4efe3000 ( 1294220) : 61.72%    82.13%    : RegionUsageHeap

          0 (       0) : 00.00%    00.00%    : RegionUsagePageHeap

       1000 (       4) : 00.00%    00.00%    : RegionUsagePeb

       1000 (       4) : 00.00%    00.00%    : RegionUsageProcessParametrs

       1000 (       4) : 00.00%    00.00%    : RegionUsageEnvironmentBlock

       Tot: 7fff0000 (2097088 KB) Busy: 602e1000 (1575812 KB)
-------------------- Type SUMMARY --------------------------

    TotSize (      KB)   Pct(Tots)  Usage

   1fd0f000 (  521276) : 24.86%   : <free>

    4352000 (   68936) : 03.29%   : MEM_IMAGE

     b78000 (   11744) : 00.56%   : MEM_MAPPED

   5b417000 ( 1495132) : 71.30%   : MEM_PRIVATE
-------------------- State SUMMARY --------------------------

    TotSize (      KB)   Pct(Tots)  Usage

   4505d000 ( 1130868) : 53.93%   : MEM_COMMIT

   1fd0f000 (  521276) : 24.86%   : MEM_FREE

   1b284000 (  444944) : 21.22%   : MEM_RESERVE
We see that in every memory dump the amount of process heap is the same 1.2Gb but during peak hours the amount of committed memory increased by 20% and remained the same even after. At the same time if we look at process heap statistics we would see the increase of free heap KB and blocks and this means that allocated memory was freed after peak hours but underlying virtual memory ranges were not decommitted and fragmentation increased by 25%.
Before peak hours:
0:000> !heap -s

LFH Key : 0x07262959

  Heap     Flags   Reserv  Commit  Virt   Free  List   UCR  Virt  Lock  Fast

                    (k)     (k)    (k)     (k) length      blocks cont. heap

[...]

00310000 00001002 1255320 512712 1177236 260583 45362 41898 2 3751a5 L

  External fragmentation 50 % (45362 free blocks)

  Virtual address fragmentation 56 % (41898 uncommited ranges)

  Lock contention 3625381

[…]
During peak hours:
0:000> !heap -s

LFH Key : 0x07262959

  Heap     Flags   Reserv  Commit  Virt   Free  List   UCR  Virt  Lock  Fast

                    (k)     (k)    (k)     (k) length      blocks cont. heap

[...]

00310000 00001002 1255320 961480 1249548 105378 0 16830 2 453093 L

  Virtual address fragmentation 23 % (16830 uncommited ranges)

  Lock contention 4534419

[…]
After peak hours:
0:000> !heap -s

LFH Key : 0x07262959

  Heap     Flags   Reserv  Commit  Virt   Free  List   UCR  Virt  Lock  Fast

                    (k)     (k)    (k)     (k) length      blocks cont. heap

[...]

00310000 00001002 1255320 1022648 1224344 772682 264787 17512 2 580634 L

  External fragmentation 75 % (264787 free blocks)

  Virtual address fragmentation 16 % (17512 uncommited ranges)

  Lock contention 5768756

[…]
Another example would be custom memory management library that by design never releases virtual memory allocated to accommodate the increased number of allocation requests after all of them are freed.
- Dmitry Vostokov @ DumpAnalysis.org -
Posted in Crash Dump Analysis, Crash Dump Patterns, Debugging, WinDbg Tips and Tricks | No Comments »
Monday, September 8th, 2008
I needed to check some data structures and how they change in the case of heap memory leaks and wrote a very small C program that was allocating memory in a loop using malloc function. The VM size was growing very fast and I saved process memory dumps at 200Mb and 500Mb. When checking heap segments I noticed that they had not increased although the process was allocating 0×1000000 chunks of heap memory:
0:000> !heap 0 0

Index   Address  Name      Debugging options enabled

  1:   00260000

    Segment at 0000000000260000 to 0000000000360000 (00008000 bytes committed)

  2:   00360000

    Segment at 0000000000360000 to 0000000000370000 (00004000 bytes committed)

  3:   00440000

    Segment at 0000000000440000 to 0000000000450000 (00010000 bytes committed)

    Segment at 0000000000450000 to 0000000000550000 (00021000 bytes committed)

  4:   00560000

    Segment at 0000000000560000 to 0000000000570000 (00010000 bytes committed)

    Segment at 0000000000570000 to 0000000000670000 (0003a000 bytes committed)
I was puzzled because inspection of virtual memory showed those chunks as belonging to heap regions:
0:000> !address

[...]

    0000000009700000 : 0000000009700000 - 0000000001002000

                    Type     00020000 MEM_PRIVATE

                    Protect  00000004 PAGE_READWRITE

                    State    00001000 MEM_COMMIT

                    Usage    RegionUsageHeap

                    Handle   0000000000560000

    000000000a702000 : 000000000a702000 - 000000000000e000

                    Type     00000000

                    Protect  00000001 PAGE_NOACCESS

                    State    00010000 MEM_FREE

                    Usage    RegionUsageFree

    000000000a710000 : 000000000a710000 - 0000000001002000

                    Type     00020000 MEM_PRIVATE

                    Protect  00000004 PAGE_READWRITE

                    State    00001000 MEM_COMMIT

                    Usage    RegionUsageHeap

                    Handle   0000000000560000

    000000000b712000 : 000000000b712000 - 0000000004aee000

                    Type     00000000

                    Protect  00000001 PAGE_NOACCESS

                    State    00010000 MEM_FREE

                    Usage    RegionUsageFree

[…]
And then I recalled that large allocations for a process heap go to a separate linked list:
0:000> !peb

PEB at 000007fffffdb000
0:000> dt _PEB 000007fffffdb000

ntdll!_PEB

[...]

   +0x0f0 ProcessHeaps     : 0×00000000`77fa3460  -> 0×00000000`00260000

[..]
0:000> dq 0×00000000`77fa3460

00000000`77fa3460  00000000`00260000 00000000`00360000

00000000`77fa3470  00000000`00440000 00000000`00560000

00000000`77fa3480  00000000`00000000 00000000`00000000

00000000`77fa3490  00000000`00000000 00000000`00000000

00000000`77fa34a0  00000000`00000000 00000000`00000000

00000000`77fa34b0  00000000`00000000 00000000`00000000

00000000`77fa34c0  00000000`00000000 00000000`00000000

00000000`77fa34d0  00000000`00000000 00000000`00000000
0:000> dt _HEAP 00000000`00260000

ntdll!_HEAP

[...]

   +0×090 VirtualAllocdBlocks : _LIST_ENTRY [ 0×00000000`00260090 - 0×260090 ]

[…]
0:000> dl 00000000`00260000+90 10 2

00000000`00260090  00000000`00260090 00000000`00260090
0:000> dl 00000000`00360000+90 10 2

00000000`00360090  00000000`00360090 00000000`00360090
0:000> dl 00000000`00440000+90 10 2

00000000`00440090  00000000`00440090 00000000`00440090
0:000> dl 00000000`00560000+90 10 2

00000000`00560090  00000000`00670000 00000000`0a710000

00000000`00670000  00000000`01680000 00000000`00560090

00000000`01680000  00000000`02690000 00000000`00670000

00000000`02690000  00000000`036a0000 00000000`01680000

00000000`036a0000  00000000`046b0000 00000000`02690000

00000000`046b0000  00000000`056c0000 00000000`036a0000

00000000`056c0000  00000000`066d0000 00000000`046b0000

00000000`066d0000  00000000`076e0000 00000000`056c0000

00000000`076e0000  00000000`086f0000 00000000`066d0000

00000000`086f0000  00000000`09700000 00000000`076e0000

00000000`09700000  00000000`0a710000 00000000`086f0000

00000000`0a710000  00000000`00560090 00000000`09700000
We see that the last process heap has large allocations directly from virtual memory, for example:
0:000> !address 00000000`0a710000

    000000000a710000 : 000000000a710000 - 0000000001002000

                    Type     00020000 MEM_PRIVATE

                    Protect  00000004 PAGE_READWRITE

                    State    00001000 MEM_COMMIT

                    Usage    RegionUsageHeap

                    Handle   0000000000560000
Actually if I used heap statistics option for !heap command I would see these large allocations:
0:000> !heap -s

LFH Key                   : 0x000000a4e8aa078c

          Heap     Flags   Reserv  Commit  Virt   Free  List   UCR  Virt  Lock  Fast

                            (k)     (k)    (k)     (k) length      blocks cont. heap

0000000000260000 00000002    1024     32     32      7     1     1    0      0   L

0000000000360000 00008000      64     16     16     12     1     1    0      0

0000000000440000 00001002    1088    196    196      4     1     1    0      0   LFH

Virtual block: 0000000000670000 - 0000000000670000

Virtual block: 0000000001680000 - 0000000001680000

Virtual block: 0000000002690000 - 0000000002690000

Virtual block: 00000000036a0000 - 00000000036a0000

Virtual block: 00000000046b0000 - 00000000046b0000

Virtual block: 00000000056c0000 - 00000000056c0000

Virtual block: 00000000066d0000 - 00000000066d0000

Virtual block: 00000000076e0000 - 00000000076e0000

Virtual block: 00000000086f0000 - 00000000086f0000

Virtual block: 0000000009700000 - 0000000009700000

Virtual block: 000000000a710000 - 000000000a710000

0000000000560000 00001002    1088    296    296     18     3     1   11      0   LFH
The dump file can be downloaded from FTP to play with:
ftp://dumpanalysis.org/pub/LargeHeapAllocations.zip
- Dmitry Vostokov @ DumpAnalysis.org -
Posted in Crash Dump Analysis, Debugging, WinDbg Tips and Tricks | 1 Comment »
Saturday, August 16th, 2008
Suppose we set up breakpoints to catch a random issue or at the end of a lengthy loop and we don’t want to sit tight, stare at the screen and wait for a debugger notification event. We just want to sit relaxed and read our favourite book or do something else. I discovered this meta-command where we can specify a wave file to be played every time a debugger breaks into a command prompt:
The .sound_notify command causes a sound to be played when WinDbg enters the wait-for-command state (from WinDbg help).
For example:
(15dc.dd0): Break instruction exception - code 80000003 (first chance)

eax=7ffde000 ebx=00000000 ecx=00000000 edx=77b3d094 esi=00000000 edi=00000000

eip=77af7dfe esp=01c6fbf4 ebp=01c6fc20 iopl=0 nv up ei pl zr na pe nc

cs=001b  ss=0023  ds=0023  es=0023  fs=003b  gs=0000             efl=00000246

ntdll!DbgBreakPoint:

77af7dfe cc              int     3
windbg> .sound_notify /ef c:\Windows\Media\tada.wav

Sound notification: file 'c:\Windows\Media\tada.wav'
0:001> g

(15dc.175c): Break instruction exception - code 80000003 (first chance)

eax=7ffde000 ebx=00000000 ecx=00000000 edx=77b3d094 esi=00000000 edi=00000000

eip=77af7dfe esp=01cafc08 ebp=01cafc34 iopl=0 nv up ei pl zr na pe nc

cs=001b  ss=0023  ds=0023  es=0023  fs=003b  gs=0000             efl=00000246

ntdll!DbgBreakPoint:

77af7dfe cc              int     3
[tada.wav is played when we break into]
- Dmitry Vostokov @ DumpAnalysis.org -
Posted in Crash Dump Analysis, Debugging, WinDbg Tips and Tricks | No Comments »
Wednesday, August 13th, 2008
.dump WinDbg command doesn’t have an option to include the process name although we can specify PID, date and time using /u option. This question came to me ages ago but only yesterday one of the visitors (Thomas B.) provided a hint to use aliases:
as /c CrashApp [get a module name here]
.dump /ma /u c:\UserDumps\${CrashApp}.dmp
Unfortunately an attempt to use lm command fails due to a line break in the output:
0:001> lmM *.exe 1m

notepad
0:001> as /c CrashApp lmM *.exe 1m
0:001> .dump /ma /u c:\UserDumps\${CrashApp}.dmp

Unable to create file 'c:\UserDumps\notepad

_06ec_2008-08-13_14-39-30-218_06cc.dmp‘ - Win32 error 0n123

    “The filename, directory name, or volume label syntax is incorrect.”
After some thinking I recalled that .printf command doesn’t output line breaks. Also the module name can be extracted from _PEB structure if it is accessible. $peb pseudo-register can be used to get PEB address automatically. Therefore I came up with the following alias:
as /c CrashFirstModule .printf "%mu", @@c++((*(ntdll!_LDR_DATA_TABLE_ENTRY**)&@$peb->Ldr->InLoadOrderModuleList.Flink)->BaseDllName.Buffer)
0:001> as /c CrashFirstModule .printf "%mu", @@c++((*(ntdll!_LDR_DATA_TABLE_ENTRY**)&@$peb->Ldr->InLoadOrderModuleList.Flink)->BaseDllName.Buffer)
0:001> .dump /ma /u c:\UserDumps\${CrashFirstModule}.dmp

Creating c:\UserDumps\notepad.exe_06ec_2008-08-13_14-44-51-702_06cc.dmp - mini user dump

Dump successfully written
These commands can be included in a script for a postmortem debugger, for example, CDB.
- Dmitry Vostokov @ DumpAnalysis.org -
Posted in Crash Dump Analysis, Debugging, WinDbg Scripts, WinDbg Tips and Tricks | 1 Comment »
Tuesday, August 12th, 2008
I needed to quickly check preferred load address for one DLL and recalled that I once used WinDbg as a binary editor. So I loaded that DLL as a crash dump:
Loading Dump File [C:\kktools\userdump8.1\x64\usrxcptn.dll]

Symbol search path is: srv*c:\mss*http://msdl.microsoft.com/download/symbols

Executable search path is:

ModLoad: 00000000`00400000 00000000`00406000   C:\kktools\userdump8.1\x64\usrxcptn.dll

usrxcptn!DllMainCRTStartupForGS:

00000000`00401200 4883ec28        sub     rsp,28h
0:000> lm

start             end                 module name

00000000`00400000 00000000`00406000   usrxcptn   (pdb symbols)          c:\mss\usrxcptn.pdb\[…]\usrxcptn.pdb
lm command already shows that but we can also check formatted PE headers as well:
0:000> !dh 00000000`00400000
File Type: DLL

FILE HEADER VALUES

    8664 machine (X64)

       5 number of sections

45825DE6 time date stamp Fri Dec 15 08:33:42 2006
       0 file pointer to symbol table

       0 number of symbols

      F0 size of optional header

    2022 characteristics

            Executable

            App can handle >2gb addresses

            DLL
OPTIONAL HEADER VALUES

     20B magic #

    8.00 linker version

     E00 size of code

    1200 size of initialized data

       0 size of uninitialized data

    1200 address of entry point

    1000 base of code

         ----- new -----

0000000000400000 image base

    1000 section alignment

     200 file alignment

       3 subsystem (Windows CUI)

    5.02 operating system version

    5.02 image version

    5.02 subsystem version

    6000 size of image

     400 size of headers

    DA18 checksum

0000000000040000 size of stack reserve

0000000000001000 size of stack commit

0000000000100000 size of heap reserve

0000000000001000 size of heap commit

    1AB0 [     213] address [size] of Export Directory

    18B4 [      3C] address [size] of Import Directory

    4000 [     418] address [size] of Resource Directory

    3000 [      48] address [size] of Exception Directory

    1E00 [    2580] address [size] of Security Directory

    5000 [      10] address [size] of Base Relocation Directory

    1080 [      1C] address [size] of Debug Directory

       0 [       0] address [size] of Description Directory

       0 [       0] address [size] of Special Directory

       0 [       0] address [size] of Thread Storage Directory

       0 [       0] address [size] of Load Configuration Directory

       0 [       0] address [size] of Bound Import Directory

    1000 [      78] address [size] of Import Address Table Directory

       0 [       0] address [size] of Delay Import Directory

       0 [       0] address [size] of COR20 Header Directory

       0 [       0] address [size] of Reserved Directory

SECTION HEADER #1

   .text name

     CC3 virtual size

    1000 virtual address

     E00 size of raw data

     400 file pointer to raw data

       0 file pointer to relocation table

       0 file pointer to line numbers

       0 number of relocations

       0 number of line numbers

60000020 flags

         Code

         (no align specified)

         Execute Read

Debug Directories(1)

 Type       Size     Address  Pointer

 cv           25        10b0      4b0 Format: RSDS, guid, 1, usrxcptn.pdb
SECTION HEADER #2

   .data name

     744 virtual size

    2000 virtual address

     200 size of raw data

    1200 file pointer to raw data

       0 file pointer to relocation table

       0 file pointer to line numbers

       0 number of relocations

       0 number of line numbers

C0000040 flags

         Initialized Data

         (no align specified)

         Read Write
SECTION HEADER #3

  .pdata name

      48 virtual size

    3000 virtual address

     200 size of raw data

    1400 file pointer to raw data

       0 file pointer to relocation table

       0 file pointer to line numbers

       0 number of relocations

       0 number of line numbers

40000040 flags

         Initialized Data

         (no align specified)

         Read Only
SECTION HEADER #4

   .rsrc name

     418 virtual size

    4000 virtual address

     600 size of raw data

    1600 file pointer to raw data

       0 file pointer to relocation table

       0 file pointer to line numbers

       0 number of relocations

       0 number of line numbers

40000040 flags

         Initialized Data

         (no align specified)

         Read Only
SECTION HEADER #5

  .reloc name

      34 virtual size

    5000 virtual address

     200 size of raw data

    1C00 file pointer to raw data

       0 file pointer to relocation table

       0 file pointer to line numbers

       0 number of relocations

       0 number of line numbers

42000040 flags

         Initialized Data

         Discardable

         (no align specified)

         Read Only
- Dmitry Vostokov @ DumpAnalysis.org -
Posted in WinDbg Tips and Tricks | 1 Comment »
Sunday, August 10th, 2008
This is a new word I’ve just coined to describe applications heavily dependent on various hooks that are either injected by normal Windows hooking mechanism, registry or via more elaborate tricks like remote threads or patching code. Originally I thought of hookware but found that this term is already in use for completely different purpose.
Now I list various patterns in memory dumps that help in detection, troubleshooting and debugging of hooksware:
- Hooked Functions (user space)
- Hooked Functions (kernel space)
- Hooking Level
This is the primary detection mechanism for hooks that patch code.
See also Raw Pointer and Out-of-Module Pointer patterns.
- Hooked Modules
The WinDbg script to run when you don’t know which module was patched.
- Changed Environment
Loaded hooks shift other DLLs by changing their load address and therefore might expose dormant bugs.
- Insufficient Memory (module fragmentation)
Hooks loaded in the middle of address space limit the maximum amount of memory that can be allocated at once. For example, various virtual machines, like Java, reserve the big chunk of memory at the start up.
- No Component Symbols
We can get an approximate picture of what a 3rd-party hook module does by looking at its import table or in the case of patching by looking at the list of deviations returned by .chkimg command.
- Unknown Component
Might give an idea about the author of the hook.
- Coincidental Symbolic Information
Sometimes hooks are loaded at round addresses like 0×10000000 and these values are very frequently used as flags or constants too.
- Wild Code
When hooking goes wrong the execution path goes into the wild territory.
- Execution Residue
Here we can find various hooks that use normal Windows hooking mechanism. Sometimes the search for “hook” word in symbolic raw stack output of dds command reveals them but beware of Coincidental Symbolic Information. See also Raw Stack Analysis Scripts page.
- Message Hooks - Modeling Example
Windows message hooking pattern example.
- Hidden Module
Some hooks may hide themselves.
- Dmitry Vostokov @ DumpAnalysis.org + TraceAnalysis.org -
Posted in Announcements, CDA Pattern Classification, Crash Dump Analysis, Crash Dump Patterns, Debugging, Malware Analysis, Malware Patterns, Memory Analysis Forensics and Intelligence, New Words, WinDbg Scripts, WinDbg Tips and Tricks | 2 Comments »
Thursday, August 7th, 2008
Sometimes we look for modules that were loaded and unloaded at some time. lm command lists unloaded modules but some of them could be mapped to address space without using runtime loader. The latter case is common for drm-type protection tools, rootkits, malware or crimeware which can influence a process execution. In such cases we can hope that they still remain in virtual memory and search for them. WinDbg .imgscan command greatly helps in identifying MZ/PE module headers. The following example just illustrates this command without implying that the found module did any harm:
0:000> .imgscan

MZ at 000d0000, prot 00000002, type 01000000 - size 6000

  Name: usrxcptn.dll

MZ at 00350000, prot 00000002, type 01000000 - size 9b000

  Name: ADVAPI32.dll

MZ at 00400000, prot 00000002, type 01000000 - size 23000

  Name: javaw.exe

MZ at 01df0000, prot 00000002, type 01000000 - size 8b000

  Name: OLEAUT32.dll

MZ at 01e80000, prot 00000002, type 01000000 - size 52000

  Name: SHLWAPI.dll

[…]
We don’t see usrxcptn in either loaded or unloaded module lists:
0:002> lm

start    end        module name

00350000 003eb000   advapi32

00400000 00423000   javaw

01df0000 01e7b000   oleaut32

01e80000 01ed2000   shlwapi

[...]
Unloaded modules:
This is why I call this pattern Hidden Module. We can use Unknown Component pattern to see the module resources if present in memory:
0:002> !dh 000d0000
[...]
SECTION HEADER #4

   .rsrc name

     418 virtual size

    4000 virtual address

     600 size of raw data

    1600 file pointer to raw data

       0 file pointer to relocation table

       0 file pointer to line numbers

       0 number of relocations

       0 number of line numbers

40000040 flags

         Initialized Data

         (no align specified)

         Read Only
[...]
0:002> dc 000d0000+4000 L418

[…]

000d4140  […] n…z.)…F.i.l.

000d4150  […] e.D.e.s.c.r.i.p.

000d4160  […] t.i.o.n…..U.s.

000d4170  […]   e.r. .D.u.m.p. .

000d4180  […] U.s.e.r. .M.o.d.

000d4190  […] e. .E.x.c.e.p.t.

000d41a0  […] i.o.n. .D.i.s.p.

000d41b0  […] a.t.c.h.e.r…..
0:002> du 000d416C

000d416c  "User Dump User Mode Exception Di"

000d41ac  "spatcher"
This component seems to be loaded or mapped only if userdump package was fully installed where usrxcptn.dll is a part of its redistribution. Although from the memory dump comment we also see that the dump was taken manually using command line userdump.exe we see that the full userdump package was additionally installed which was probably not necessary (see Correcting Microsoft article about userdump.exe):
Loading Dump File [javaw.dmp]

User Mini Dump File with Full Memory: Only application data is available
Comment: 'Userdump generated complete user-mode minidump with Standalone function on COMPUTER-NAME'
- Dmitry Vostokov @ DumpAnalysis.org -
Posted in Crash Dump Analysis, Crash Dump Patterns, Debugging, Malware Analysis, Memory Analysis Forensics and Intelligence, Security, WinDbg Tips and Tricks | 8 Comments »
Tuesday, August 5th, 2008
Sometimes a dump file looks normal inside and at least we don’t see any suspicious past activity. However, as it often happens, the dump was saved manually as a response to some failure. Here Last Error Collection might help in finding further troubleshooting suggestions. If we have a process memory dump we can get all errors and NTSTATUS values at once using !gle command with -all parameter:
0:000> !gle -all

Last error for thread 0:

LastErrorValue: (Win32) 0x3e5 (997) - Overlapped I/O operation is in progress.

LastStatusValue: (NTSTATUS) 0x103 - The operation that was requested is pending completion.
Last error for thread 1:

LastErrorValue: (Win32) 0 (0) - The operation completed successfully.

LastStatusValue: (NTSTATUS) 0 - STATUS_WAIT_0
Last error for thread 2:

LastErrorValue: (Win32) 0 (0) - The operation completed successfully.

LastStatusValue: (NTSTATUS) 0 - STATUS_WAIT_0
Last error for thread 3:

LastErrorValue: (Win32) 0 (0) - The operation completed successfully.

LastStatusValue: (NTSTATUS) 0 - STATUS_WAIT_0
[...]
Last error for thread 28:

LastErrorValue: (Win32) 0 (0) - The operation completed successfully.

LastStatusValue: (NTSTATUS) 0 - STATUS_WAIT_0
Last error for thread 29:

LastErrorValue: (Win32) 0×6ba (1722) - The RPC server is unavailable.

LastStatusValue: (NTSTATUS) 0 - STATUS_WAIT_0
Last error for thread 2a:

LastErrorValue: (Win32) 0 (0) - The operation completed successfully.

LastStatusValue: (NTSTATUS) 0 - STATUS_WAIT_0
Last error for thread 2b:

LastErrorValue: (Win32) 0 (0) - The operation completed successfully.

LastStatusValue: (NTSTATUS) 0 - STATUS_WAIT_0
[...]
For complete memory dumps we can employ the following command or similar to it:
!for_each_thread ".thread /r /p @#Thread; .if (@$teb != 0) { !teb; !gle; }"
0: kd> !for_each_thread ".thread /r /p @#Thread; .if (@$teb != 0) { !teb; !gle; }"
[...]
Implicit thread is now 8941eb40

Implicit process is now 8a4ac498

Loading User Symbols

TEB at 7ff3e000

    ExceptionList:        0280ffa8

    StackBase:            02810000

    StackLimit:           0280b000

    SubSystemTib:         00000000

    FiberData:            00001e00

    ArbitraryUserPointer: 00000000

    Self:                 7ff3e000

    EnvironmentPointer:   00000000

    ClientId:             00001034 . 000012b0

    RpcHandle:            00000000

    Tls Storage:          00000000

    PEB Address:          7ffde000

    LastErrorValue:       0

    LastStatusValue:      c00000a3

    Count Owned Locks:    0

    HardErrorMode:        0

LastErrorValue: (Win32) 0 (0) - The operation completed successfully.

LastStatusValue: (NTSTATUS) 0xc00000a3 - {Drive Not Ready}  The drive is not ready for use; its door may be open.  Please check drive %hs and make sure that a disk is inserted and that the drive door is closed.
[...]
- Dmitry Vostokov @ DumpAnalysis.org -
Posted in Crash Dump Analysis, Crash Dump Patterns, Debugging, WinDbg Tips and Tricks | 2 Comments »