Introducing EasyDbg
This is already written application (10 years ago by me) that I’m adapting as a high-level interface to WinDbg (can be any GUI debugger actually). The basic idea revolves around floating buttons (listbox and task bar icons, optionally) that dynamically change with every new window or application. The number of buttons can be unlimited, they have tooltips and can be repositioned to any corner of the screen, they can play sounds, show video and pictures. On click they execute elaborated macro commands, including keystrokes and mouse movements, written in a special scripting language. For example, we can create buttons for CDA checklist.
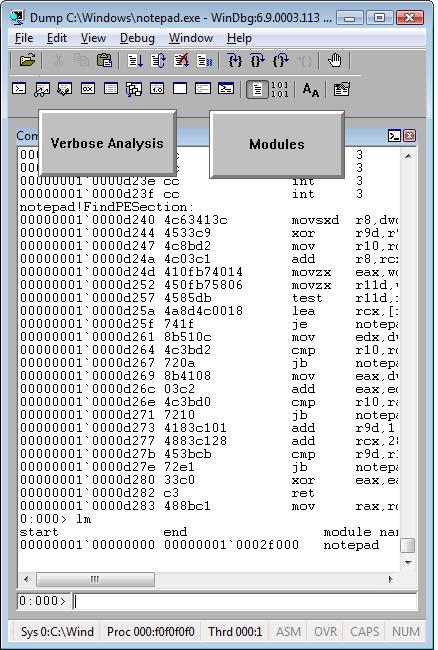
I’ve created 2 buttons for WinDbg window:
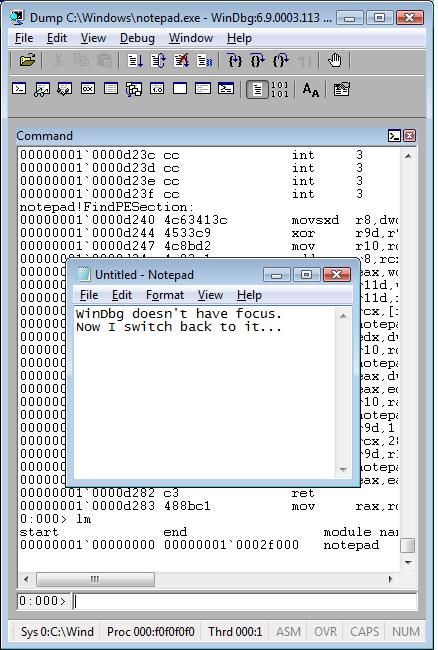
When we switch from WinDbg to another application they disappear:
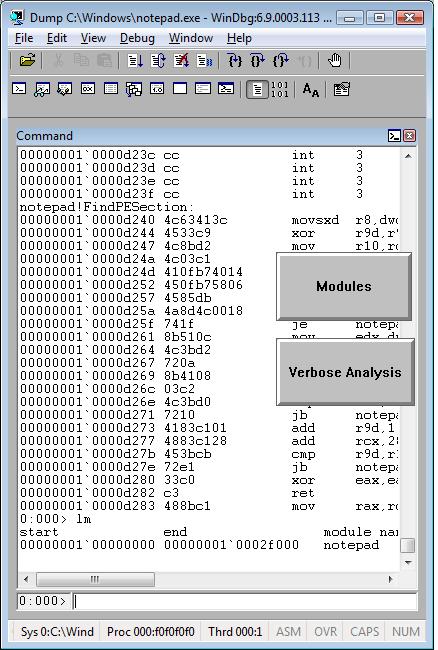
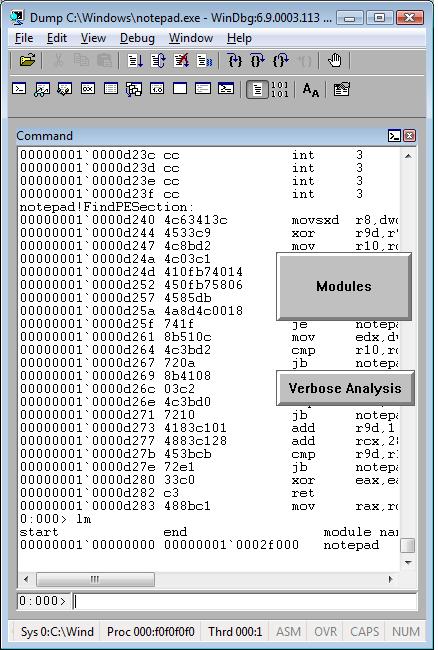
We switch back to WinDbg and they reappear. We can move them around the screen:
We can edit them by right click:

and change their shape:
The set of buttons can be saved as an executable file. When we run it on another PC it recreates all buttons when WinDbg window appears.
Written in C and using only Win32 API EasyDbg process consumes minimum resources. It sits on task bar for easy access:

- Dmitry Vostokov @ DumpAnalysis.org -
August 12th, 2008 at 5:31 pm
Can we have WinDbg scripts attached to these buttons? and when clicked it should executes the script commands. If this is the case, it’ll be great to automate few analyzing tasks with button click instead of typing the script ($$a) command in the command line field. User community can grow by sharing these buttons.
August 12th, 2008 at 6:19 pm
Yes, you can attach scripts as well! They will be like ordinary keystroke input.
September 18th, 2008 at 1:31 pm
[…] This seems to be similar to EasyDbg. […]