Archive for the ‘WinDbg Tips and Tricks’ Category
Thursday, July 23rd, 2009
Finally the issue is available on Amazon and through other sellers:
Debugged! MZ/PE: Modeling Software Defects
I’m now planning the September issue and post details later.
- Dmitry Vostokov @ DumpAnalysis.org -
Posted in Announcements, Books, Certification, Citrix, Crash Dump Analysis, Debugged! MZ/PE, Debugging, Education and Research, Publishing, Software Defect Construction, Software Engineering, Software Technical Support, Testing, Tools, Training and Seminars, Troubleshooting Methodology, WinDbg Tips and Tricks | No Comments »
Sunday, July 12th, 2009
The second issue of the magazine was put into production today and should be available after one or two weeks on Amazon, B&N and other booksellers worldwide.

Title: Debugged! MZ/PE: Modeling Software Defects
Authors: Konstantin Chebotarev, Kapildev Ramlal, Dmitry Vostokov
ISBN: 1906717680
ISBN-13: 978-1906717681
Annotation: Welcome to the second issue of Debugged! MZ/PE magazine! It brings fault injection into new light and features articles discussing software defect construction via DLL injection, modeling CPU spikes and runaway exception processing. This issue also includes a memory dump analysis certification voucher. Back cover features WinDbg breakpoint and tracing command summary for easy desk reference. - Dmitry Vostokov - Editor-in-Chief
- Dmitry Vostokov @ DumpAnalysis.org -
Posted in Announcements, Books, Certification, Citrix, Crash Dump Analysis, Debugged! MZ/PE, Debugging, Education and Research, Publishing, Software Defect Construction, Software Engineering, Software Technical Support, Testing, Tools, Training and Seminars, Troubleshooting Methodology, WinDbg Tips and Tricks | No Comments »
Tuesday, July 7th, 2009
Sometimes we need to dump raw stack data of the given thread to get correct function arguments or to see execution residue. If the process is WOW64 (32-bit running on x64 Windows) and its memory dump was saved using a 64-bit debugger or a process dumper like userdump.exe we have 2 stacks in it:
64-bit stack:
0:007> k

Child-SP          RetAddr           Call Site

00000000`030fee38 00000000`75fcab46 wow64cpu!WaitForMultipleObjects32+0x3a

00000000`030feee0 00000000`75fca14c wow64!RunCpuSimulation+0xa

00000000`030fef10 00000000`77d373db wow64!Wow64LdrpInitialize+0x4b4

00000000`030ff470 00000000`77cf85ce ntdll! ?? ::FNODOBFM::`string'+0x20061

00000000`030ff520 00000000`00000000 ntdll!LdrInitializeThunk+0xe
0:007> r

rax=0000000000000000 rbx=0000000000000002 rcx=0000000000000400

rdx=0000000000000000 rsi=0000000000000000 rdi=0000000000000000

rip=0000000075ec374f rsp=00000000030fee38 rbp=0000000005baef38

 r8=000000000000002b  r9=0000000077e9057a r10=0000000000000000

r11=00000000030fee30 r12=000000007efad000 r13=00000000030ffd20

r14=00000000030fee70 r15=0000000075ec3380

iopl=0 nv up ei pl nz ac pe nc

cs=0033 ss=002b ds=002b es=002b fs=0053 gs=002b efl=00000212

wow64cpu!WaitForMultipleObjects32+0×3a:

00000000`75ec374f 418bbda0000000  mov     edi,dword ptr [r13+0A0h] ds:00000000`030ffdc0=00000000
0:007> !teb

Wow64 TEB32 at 000000007efaf000
error InitTypeRead( wow64!_TEB32 )...
Wow64 TEB at 000000007efad000

    ExceptionList:        000000007efaf000

    StackBase:            00000000030ffd20

    StackLimit:           00000000030f8000

    SubSystemTib:         0000000000000000

    FiberData:            0000000000001e00

    ArbitraryUserPointer: 0000000000000000

    Self:                 000000007efad000

    EnvironmentPointer:   0000000000000000

    ClientId:             0000000000000b44 . 0000000000000b1c

    RpcHandle:            0000000000000000

    Tls Storage:          0000000000000000

    PEB Address:          000000007efdf000

    LastErrorValue:       0

    LastStatusValue:      c0000034

    Count Owned Locks:    0

    HardErrorMode:        0
32-bit stack:
0:007> .effmach x86

Effective machine: x86 compatible (x86)
0:007:x86> k

ChildEBP RetAddr

05baee9c 7756e91a ntdll_77e70000!NtWaitForMultipleObjects+0x15

05baef38 775649d9 kernel32!WaitForMultipleObjectsEx+0x11d

05baef54 7761573d kernel32!WaitForMultipleObjects+0x18

05baefc0 77615969 kernel32!WerpReportFaultInternal+0x16d

05baefd4 775ec66f kernel32!WerpReportFault+0x70

05baf060 77eed03e kernel32!UnhandledExceptionFilter+0x1b5

05baf068 77ebf2d0 ntdll_77e70000!__RtlUserThreadStart+0x6f

05baf07c 77f229b3 ntdll_77e70000!_EH4_CallFilterFunc+0x12

05baf0a4 77e93099 ntdll_77e70000!_except_handler4+0x8e

05baf0c8 77e9306b ntdll_77e70000!ExecuteHandler2+0x26

05baf178 77e92eff ntdll_77e70000!ExecuteHandler+0x24

05baf198 7757f328 ntdll_77e70000!KiUserExceptionDispatcher+0xf

05baf4fc 7155dead kernel32!RaiseException+0x58

WARNING: Stack unwind information not available. Following frames may be wrong.

05baf534 7155a59d ComponentA!DllUnregisterServer+0x1adbe0

[...]
0:007:x86> r

eax=00000000 ebx=00000002 ecx=00000003 edx=00000000 esi=00000000 edi=00000000

eip=77e90bc5 esp=05baeea0 ebp=05baef38 iopl=0 nv up ei pl nz na pe nc

cs=0023 ss=002b ds=002b es=002b fs=0053 gs=002b efl=00000206

ntdll_77e70000!NtWaitForMultipleObjects+0×15:

77e90bc5 c21400          ret     14h
Unfortunately there is an error when try to get its TEB (TEB32) using !teb command so we can either use dp command to discover stack base and limit:
0:007:x86> !teb

Wow64 TEB32 at 000000007efaf000
error InitTypeRead( wow64!_TEB32 )…
0:007:x86> dp 000000007efaf000 l3

7efaf000  05baef28 05bb0000 05b95000
or use WOW64 extension for this purpose:
0:007:x86> !wow64exts.info
PEB32: 0x7efde000

PEB64: 0x7efdf000
Wow64 information for current thread:
TEB32: 0×7efaf000

TEB64: 0×7efad000
32 bit, StackBase   : 0×5bb0000

        StackLimit  : 0×5b95000

        Deallocation: 0×5ab0000
64 bit, StackBase   : 0x30ffd20

        StackLimit  : 0x30f8000

        Deallocation: 0x30c0000

Wow64 TLS slots:
WOW64_TLS_STACKPTR64:       0x0000000000000000

WOW64_TLS_CPURESERVED:      0x00000000030ffd20

WOW64_TLS_INCPUSIMULATION:  0x0000000000000000

WOW64_TLS_LOCALTHREADHEAP:  0x0000000000000000

WOW64_TLS_EXCEPTIONADDR:    0x000000007757f328

WOW64_TLS_USERCALLBACKDATA: 0x0000000000000000

WOW64_TLS_EXTENDED_FLOAT:   0x0000000000000000

WOW64_TLS_APCLIST:          0x0000000000000000

WOW64_TLS_FILESYSREDIR:     0x0000000000000000

WOW64_TLS_LASTWOWCALL:      0x0000000000000000

WOW64_TLS_WOW64INFO:        0x000000007efde238
In case these methods don’t work and we want to quickly inspect raw memory around the current ESP value we can still use dps esp-xxx esp+xxx command, where xxx is some offset:
0:007:x86> dps esp-10 esp+10

05baee90  00000000

05baee94  00000000

05baee98  00000000

05baee9c  77e90bc5 ntdll_77e70000!NtWaitForMultipleObjects+0x15

05baeea0  7756e91a kernel32!WaitForMultipleObjectsEx+0x11d

05baeea4  00000002

05baeea8  05baeeec

05baeeac  00000001

05baeeb0  00000000
Remember that dp and dps are better to use here than dd, dds or dq, dqs: they automatically take into account the pointer size, 32-bit in x86 mode and 64-bit in native mode:
0:007:x86> .effmach amd64

Effective machine: x64 (AMD64)
0:007> dps esp-10 esp+10

00000000`030fee28  00000000`006d0008

00000000`030fee30  00000000`030ffd20

00000000`030fee38  00000000`7efad000

00000000`030fee40  00000000`00003da8

00000000`030fee48  00000000`75ec3688 wow64cpu!ServiceNoTurbo+0x28
- Dmitry Vostokov @ DumpAnalysis.org -
Posted in Crash Dump Analysis, Debugging, WinDbg Tips and Tricks | 2 Comments »
Thursday, May 28th, 2009
One of the questions that is often asked is about exception addresses in application and system event logs. For example, we have this typical log entry:
"The instruction at "0x77ca8fa7" referenced memory address "0x00000000". The memory could not be read."
Suppose the dump is not available. Can we find the function address to look in our problem database?
My answer here is usually the following:
Even if the application is no longer running we can either noninvasively attach a debugger to it or get a user dump of it and later find the nearest address using ln WinDbg command (remember to apply correct symbols first, see windbg.org):
0:000> ln 77ca8fa7

(77ca8f91)   msvcrt!wcscpy+0×16   |  (77ca8fd6)   msvcrt!wcspbrk
Usually applications crash inside functions and not at their entry addresses, so we pay attention to wcscpy function because it has the offset +0×16.
Note: on Vista and W2K8 due to ASLR, system DLLs could be at different addresses if we take the dump of or attach to a different running process instance.
- Dmitry Vostokov @ DumpAnalysis.org -
Posted in Debugging, WinDbg Tips and Tricks | No Comments »
Tuesday, May 12th, 2009
Previously announced memory dump analysis certification will have x86/x64-based tracks for Windows and Unix (including Linux / FreeBSD / Mac OS X). Each track consists of 3 exams, each having its own set of requirements and scope:
- Fundamentals of Memory Dump Analysis
- Intermediate Memory Dump Analysis
- Advanced Memory Dump Analysis
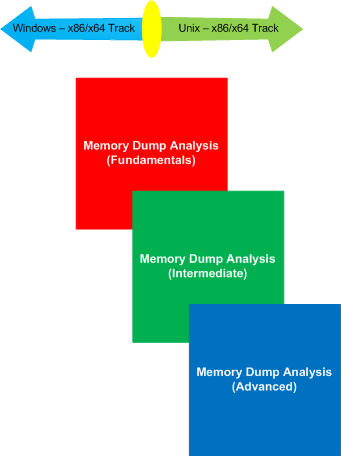
More information will be available later. The initiative is supported by OpenTask.
- Dmitry Vostokov @ DumpAnalysis.org -
Posted in Announcements, Certification, Crash Dump Analysis, Crash Dump Patterns, Debugging, Education and Research, Memory Dump Analysis Jobs, Minidump Analysis, Software Technical Support, Training and Seminars, WinDbg Tips and Tricks, WinDbg for GDB Users, Windows System Administration | No Comments »
Monday, May 11th, 2009
Sometimes the script featured in part 1 doesn’t work because of the lack of symbols or something else:
***

***

*** Your debugger is not using the correct symbols

***

*** In order for this command to work properly, your symbol path

*** must point to .pdb files that have full type information.

***

*** Certain .pdb files (such as the public OS symbols) do not

*** contain the required information.  Contact the group that

*** provided you with these symbols if you need this command to

*** work.

***

*** Type referenced: ntdll!_NT_TIB

***

Couldn’t resolve error at ‘ntdll!_NT_TIB *)@$teb)->StackLimit; r? $t2 = ((ntdll!_NT_TIB *)@$teb)->StackBase; !teb; dps @$t1 @$t2′

                    ^ Extra character error in ‘~*e r? $t1 = ((ntdll!_NT_TIB *)@$teb)->StackLimit; r? $t2 = ((ntdll!_NT_TIB *)@$teb)->StackBase; !teb; dps @$t1 @$t2′
This is the case where !teb WinDbg command doesn’t work and we can cope with this as shown in the following post:
Coping with missing symbolic information
Therefore we can adjust our user-mode script to use hard-coded offsets and delineate raw stack outputs by the output of kv WinDbg command:
~*e r? $t0 = @$teb; r? $t1 = @$t0+8; r? $t2 = @$t0+4; kv 100; dps poi(@$t1) poi(@$t2)
- Dmitry Vostokov @ DumpAnalysis.org -
Posted in Crash Dump Analysis, Debugging, WinDbg Scripts, WinDbg Tips and Tricks | 3 Comments »
Friday, April 3rd, 2009
Sometimes the timestamp of a module is not available when we want to see how old it is:
0:000> lmv m moduleA

start    end        module name

25000000 2507a000   moduleA  T (export symbols)       moduleA.dll

Loaded symbol image file: moduleA.dll

Image path: \moduleA.dll

Image name: moduleA.dll

Timestamp:        unavailable (00000000)

CheckSum:         00000000

ImageSize:        0007A000

File version:     0.3.0.0

Product version:  3.43.0.0

File flags:       0 (Mask 0)

File OS:          40004 NT Win32

File type:        0.0 Unknown

File date:        00000000.00000000

Translations:     0409.04e4

CompanyName:      A Software Company

ProductName:      A Software Product

ProductVersion:   3.43

FileVersion:      3.43

FileDescription:  A Software Product

LegalCopyright:   Copyright (c) 2001-2009 A Software Company
Fortunately, the legal copyright says that the module is the new as this year, 2009. This is useful in analyzing print driver problems where the numerous observations suggest that the older the driver the more suspect it should be especially in multi-threaded environments.
- Dmitry Vostokov @ DumpAnalysis.org -
Posted in Crash Dump Analysis, WinDbg Tips and Tricks | No Comments »
Tuesday, March 31st, 2009
The latest WinDbg 6.11.0001.404 has broken !ntsdexts.locks command (simply !locks in user dumps). I noticed that some time ago and switched to !cs command which works in user and complete memory dumps. I now like it more than !locks because the following command parameters give stack traces for critical section owners:
!cs -l -o -s
The following recent cases studies use !cs command:
Blocked threads, message box and self-diagnosis
Manual dump, wait chain, blocked thread, dynamic memory corruption and historical information: pattern cooperation
Coupled processes, wait chains, message box, waiting thread time, paged out data, incorrect stack trace, hidden exception, unknown component and execution residue: pattern cooperation
Easy to remember mnemonic is cslos: critical sections locked with stacks
This command is also featured on the back cover of March Debugged! magazine issue.
- Dmitry Vostokov @ DumpAnalysis.org -
Posted in Crash Dump Analysis, Debugging, WinDbg Tips and Tricks | 1 Comment »
Sunday, March 29th, 2009
Finally it has been published and available for orders from Amazon and other bookstores:
http://www.dumpanalysis.org/Debugged+Magazine
I had to increase the number of pages for the first issue from 16, planned originally, to 28 and this is reflected in the retail price of $10 (originally planned $8) but bookstores should sell it with a discount between 0% and 55%.
More information about the next issue should be ready by the end of the next week.
- Dmitry Vostokov @ DumpAnalysis.org -
Posted in Announcements, Crash Dump Analysis, Crash Dump Patterns, Debugged! MZ/PE, Debugging, History, Memory Analysis Forensics and Intelligence, Publishing, Security, Software Technical Support, Testing, Tools, Training and Seminars, Troubleshooting Methodology, WinDbg Scripts, WinDbg Tips and Tricks | No Comments »
Friday, March 20th, 2009
In Windows Vista and Server 2008 LPC is implemented using undocumented Advanced Local Procedure Calls (ALPC) and the new formatting of the !process 0 ff output shows the owner of the port:
THREAD fffffa801afae6f0  Cid 033c.3c40  Teb: 000007fffffa0000 Win32Thread: 0000000000000000 WAIT: (WrLpcReply) UserMode Non-Alertable

    fffffa801afaea80  Semaphore Limit 0x1

Waiting for reply to ALPC Message fffff8800f4cc950 : queued at port fffffa8017dbb060 : owned by process fffffa801807b8f0
Instead of !lpc we should use !alpc extension command:
0: kd> !lpc message fffff8800f4cc950

LPC is now emulated over ALPC. Use !alpc

Arguments:
   /?                   - Print help

   /P [/V] PortAddress  - Dump the ALPC port information

   /M [/V] MsgAddress   - Searches the message and dumps the message information

   /R [/V] ResAddress   - Dumps the information regarding resources

   /G [/V]              - Dumps the global information
0: kd> !alpc /M fffff8800f4cc950
Message @ fffff8800f4cc950

  MessageID             : 0x0BFC (3068)

  CallbackID            : 0x1FEF27 (2092839)

  SequenceNumber        : 0x0004D4D4 (316628)

  Type                  : LPC_REQUEST

  DataLength            : 0x0068 (104)

  TotalLength           : 0x0090 (144)

  Canceled              : No

  Release               : No

  ReplyWaitReply        : No

  Continuation          : Yes

  OwnerPort             : fffffa8018a95e60 [ALPC_CLIENT_COMMUNICATION_PORT]

  WaitingThread         : fffffa801afae6f0

  QueueType             : ALPC_MSGQUEUE_PENDING

  QueuePort             : fffffa8017dbb060 [ALPC_CONNECTION_PORT]

  QueuePortOwnerProcess : fffffa801807b8f0 (svchost.exe)

  ServerThread          : fffffa801aeec060

  QuotaCharged          : No

  CancelQueuePort       : 0000000000000000

  CancelSequencePort    : 0000000000000000

  CancelSequenceNumber  : 0×00000000 (0)

  ClientContext         : 00000000025599e0

  ServerContext         : 0000000000000000

  PortContext           : 000000000030d640

  CancelPortContext     : 0000000000000000

  SecurityData          : 0000000000000000

  View                  : 0000000000000000
- Dmitry Vostokov @ DumpAnalysis.org -
Posted in Crash Dump Analysis, Crash Dump Patterns, Debugging, Vista, WinDbg Tips and Tricks, Windows Server 2008 | 1 Comment »
Wednesday, March 18th, 2009
Yesterday I submitted the magazine to print and distribution world-wide. If everything is right it should be available by the end of this month. This first issue features 12 page WinDbg command supplement to pattern-driven memory dump analysis methodology, an overview of Win32dd complete memory dumper and PowerDbg enhancements to debug ASP.NET code. The magazine will only be available in print.
- Dmitry Vostokov @ DumpAnalysis.org -
Posted in Announcements, Books, Crash Dump Analysis, Crash Dump Patterns, Debugged! MZ/PE, Debugging, Memory Analysis Forensics and Intelligence, Minidump Analysis, Publishing, Security, Software Technical Support, Testing, Tools, Training and Seminars, WinDbg Scripts, WinDbg Tips and Tricks | No Comments »
Monday, February 16th, 2009
I’ve always wondered why LockCount is sometimes negative in the latest OS versions since SPs for Windows Server 2003:
0:000> !locks
CritSec +319ee0 at 00319EE0

LockCount -90

RecursionCount 1

OwningThread 1198

EntryCount 0

ContentionCount 734a6

*** Locked
CritSec +202e3d0 at 0202E3D0

LockCount -2

RecursionCount 1

OwningThread 1198

EntryCount 0

ContentionCount 0

*** Locked
CritSec +1b69ad4 at 01B69AD4

LockCount -2

RecursionCount 1

OwningThread 1198

EntryCount 0

ContentionCount 0

*** Locked
Finally the post on NT Debugging Blog pointed to WinDbg Help article (the section Interpreting Critical Section Fields in Windows Server 2003 SP1 and Later):
http://msdn.microsoft.com/en-us/library/cc267476.aspx
Be aware though that negative values could also mean Critical Section Corruption pattern:
CritSec printerA!DlgProc+53b38 at 107cddd8

WaiterWoken Yes

LockCount -69154612

RecursionCount 276618309

OwningThread 107cdd36

EntryCount 0

ContentionCount 0

*** Locked
- Dmitry Vostokov @ DumpAnalysis.org -
Posted in Crash Dump Analysis, Debugging, WinDbg Tips and Tricks | No Comments »
Friday, February 6th, 2009
In the past I was not able or didn’t know how to view 32-bit process thread stacks when looking at a complete memory dump from x64 Windows. So I had to request user dumps. Now I want to share a technique a reader of my blog (Yuhong Bao) suggested: to use .thread WinDbg command with /w option. Here are additional steps that I found necessary when playing with my test complete memory dump from x64 Windows Server 2003 SP2 (I used the latest version of WinDbg from 64-bit Debugging Tools for Windows):
0. Find a 32-bit process of interest:
kd> !process 0 0

**** NT ACTIVE PROCESS DUMP ****

PROCESS fffffadfe7afd8e0

    SessionId: none  Cid: 0004    Peb: 00000000  ParentCid: 0000

    DirBase: 0014a000  ObjectTable: fffffa8000000c10  HandleCount: 736.

    Image: System
PROCESS fffffadfe6b14040

    SessionId: none  Cid: 0130    Peb: 7fffffd8000  ParentCid: 0004

    DirBase: 353c0000  ObjectTable: fffffa80009104a0  HandleCount:  19.

    Image: smss.exe
PROCESS fffffadfe65cec20

    SessionId: 0  Cid: 0160    Peb: 7fffffde000  ParentCid: 0130

    DirBase: 30210000  ObjectTable: fffffa80006a4d80  HandleCount: 732.

    Image: csrss.exe
PROCESS fffffadfe73b7040

    SessionId: 0  Cid: 0270    Peb: 7fffffdc000  ParentCid: 0130

    DirBase: 302b6000  ObjectTable: fffffa8000520710  HandleCount: 751.

    Image: winlogon.exe
PROCESS fffffadfe737d040

    SessionId: 0  Cid: 02a0    Peb: 7fffffd7000  ParentCid: 0270

    DirBase: 0060d000  ObjectTable: fffffa80008df6a0  HandleCount: 339.

    Image: services.exe
PROCESS fffffadfe6574040

    SessionId: 0  Cid: 02ac    Peb: 7fffffd5000  ParentCid: 0270

    DirBase: 0070d000  ObjectTable: fffffa80008e16a0  HandleCount: 510.

    Image: lsass.exe
PROCESS fffffadfe7860040

    SessionId: 0  Cid: 0364    Peb: 7fffffd7000  ParentCid: 02a0

    DirBase: 0935e000  ObjectTable: fffffa8000969710  HandleCount:  87.

    Image: svchost.exe
[...]
PROCESS fffffadfe751d040

    SessionId: 0  Cid: 0bcc    Peb: 7efdf000  ParentCid: 0abc

    DirBase: 18861000  ObjectTable: fffffa8001ecbc30  HandleCount: 326.

    Image: Application32.exe
[...]
1. Switch to the process context:
kd> .process /r /p fffffadfe751d040

Implicit process is now fffffadf`e751d040

Loading User Symbols
Stacks traces are 64-bit:
kd> !process fffffadfe751d040

PROCESS fffffadfe751d040

    SessionId: 0  Cid: 0bcc    Peb: 7efdf000  ParentCid: 0abc

    DirBase: 18861000  ObjectTable: fffffa8001ecbc30  HandleCount: 326.

    Image: Application32.exe

    VadRoot fffffadfe7550ae0 Vads 160 Clone 0 Private 1616. Modified 1675. Locked 0.

    DeviceMap fffffa800210e600

    Token                             fffffa80028ef060

    ElapsedTime                       21:57:59.125

    UserTime                          00:00:00.718

    KernelTime                        00:00:00.953

    QuotaPoolUsage[PagedPool]         185704

    QuotaPoolUsage[NonPagedPool]      20080

    Working Set Sizes (now,min,max)  (3021, 50, 345) (12084KB, 200KB, 1380KB)

    PeakWorkingSetSize                3696

    VirtualSize                       93 Mb

    PeakVirtualSize                   104 Mb

    PageFaultCount                    12097

    MemoryPriority                    BACKGROUND

    BasePriority                      8

    CommitCharge                      2051
THREAD fffffadfe664e040  Cid 0bcc.0bdc  Teb: 000000007efdb000 Win32Thread: fffff97ff4898bd0 WAIT: (Unknown) UserMode Non-Alertable

    fffffadfe73bac40  SynchronizationEvent

    fffffadfe6b69790  SynchronizationEvent

Not impersonating

DeviceMap                 fffffa800210e600

Owning Process            fffffadfe751d040       Image:         Application32.exe

Attached Process          N/A            Image:         N/A

Wait Start TickCount      4153935        Ticks: 912354 (0:03:57:35.531)

Context Switch Count      8088                 LargeStack

UserTime                  00:00:00.343

KernelTime                00:00:00.593

Win32 Start Address Application32 (0x00000000004077ec)

Start Address 0x0000000077d59620

Stack Init fffffadfdede7e00 Current fffffadfdede7250

Base fffffadfdede8000 Limit fffffadfdede2000 Call 0

Priority 8 BasePriority 8 PriorityDecrement 0

Kernel stack not resident.

Child-SP          RetAddr           Call Site

fffffadf`dede7290 fffff800`0103b0a3 nt!KiSwapContext+0x85

fffffadf`dede7410 fffff800`0103af8a nt!KiSwapThread+0xc3

fffffadf`dede7450 fffff800`012b9958 nt!KeWaitForMultipleObjects+0x5ec

fffffadf`dede74f0 fffff800`012e63ec nt!ObpWaitForMultipleObjects+0x325

fffffadf`dede79b0 fffff800`0104113d nt!NtWaitForMultipleObjects32+0xcc

fffffadf`dede7c00 00000000`78b83d44 nt!KiSystemServiceCopyEnd+0x3 (TrapFrame @ fffffadf`dede7c70)

00000000`0012edc8 00000000`6b006a5a wow64cpu!WaitForMultipleObjects32+0x3a

00000000`0012ee70 00000000`6b005e0d wow64!RunCpuSimulation+0xa

00000000`0012eea0 00000000`77ed8030 wow64!Wow64LdrpInitialize+0x2ed

00000000`0012f6d0 00000000`77ed582f ntdll!LdrpInitializeProcess+0x1538

00000000`0012f9d0 00000000`77ef30a5 ntdll!LdrpInitialize+0x18f

00000000`0012fab0 00000000`77d59620 ntdll!KiUserApcDispatcher+0x15 (TrapFrame @ 00000000`0012fe18)

[...]
2. Load WOW64 extension
kd> .load wow64exts
3. Set the current thread and switch to x86 context:
kd> .thread /w fffffadfe664e040

Implicit thread is now fffffadf`e664e040

x86 context set
4. Sometimes reloading symbols is necessary:
kd:x86> .reload

Loading Kernel Symbols

Loading User Symbols

Loading unloaded module list

Loading Wow64 Symbols
5. Now we can get our stack trace (it is a bit rough because Application32.exe symbols were not available)
kd:x86> kv 100

ChildEBP          RetAddr           Args to Child

002cfd94 7d4e286c 00000002 002cfde0 00000001 ntdll_7d600000!NtWaitForMultipleObjects+0x15 (FPO: [5,0,0])

002cfe3c 7d94d299 00000002 002cfe64 00000000 kernel32!WaitForMultipleObjectsEx+0x11a (FPO: [SEH])

002cfe98 7d94d327 00000001 002d8148 ffffffff USER32!RealMsgWaitForMultipleObjectsEx+0x152 (FPO: [5,13,0])

*** ERROR: Module load completed but symbols could not be loaded for Application32.exe

002cfeb4 00408081 00000001 002d8148 00000000 USER32!MsgWaitForMultipleObjects+0x1f (FPO: [5,0,0])

WARNING: Stack unwind information not available. Following frames may be wrong.

002cff00 00407d4b ffffffff 00408b78 004010ee Application32+0x8081

002cff08 00408b78 004010ee 004352e0 004352e0 Application32+0x7d4b

002cff0c 004010ee 004352e0 004352e0 0042f004 Application32+0x8b78

00408b78 90909090 90c3c033 90909090 90909090 Application32+0x10ee

00408b7c 90c3c033 90909090 90909090 90909090 0x90909090

00408b80 90909090 90909090 90909090 433aa0a1 0x90c3c033

[...]
6. We can also access raw stack trace if we need to see 32-bit execution residue and reconstruct partial stack traces:
kd:x86> !teb

Wow64 TEB32 at 000000007efdd000

[...]

Wow64 TEB at 000000007efdb000

    ExceptionList:        000000007efdd000

    StackBase:            0000000000130000

    StackLimit:           000000000012a000

    SubSystemTib:         0000000000000000

    FiberData:            0000000000001e00

    ArbitraryUserPointer: 0000000000000000

    Self:                 000000007efdb000

    EnvironmentPointer:   0000000000000000

    ClientId:             0000000000000bcc . 0000000000000bdc

    RpcHandle:            0000000000000000

    Tls Storage:          0000000000000000

    PEB Address:          000000007efdf000

    LastErrorValue:       6

    LastStatusValue:      c0000034

    Count Owned Locks:    0

    HardErrorMode:        0
kd:x86> dds 000000000012a000 0000000000130000

[...]
- Dmitry Vostokov @ DumpAnalysis.org -
Posted in Crash Dump Analysis, Debugging, WinDbg Tips and Tricks | 1 Comment »
Monday, February 2nd, 2009
I very proud to announce that after 3 weeks of final work the book has been released in both paperback and PDF format. In a week or so it should also appear on Amazon and other booksellers around the world. The book information and how to buy it can be found on the portal:
Windows Debugging: Practical Foundations
- Dmitry Vostokov @ DumpAnalysis.org -
Posted in Announcements, Assembly Language, Books, Crash Dump Analysis, Crash Dumps for Dummies, Debugging, Education and Research, Memory Dump Analysis Jobs, Publishing, Software Technical Support, Testing, Tools, Training and Seminars, WinDbg Tips and Tricks, WinDbg for GDB Users | No Comments »
Monday, January 26th, 2009
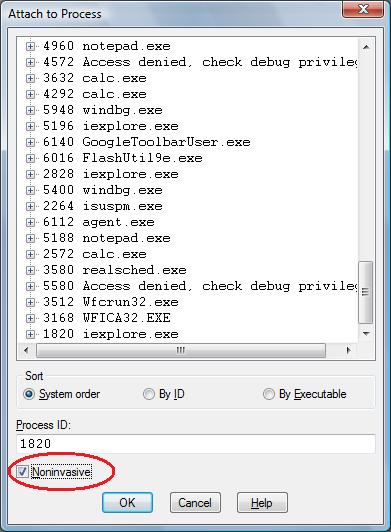
One question that people often ask is to how to simulate a process hang. One method that I found is to attach WinDbg noninvasively, freeze all threads by executing the following command:
~*n
and then quit by using q command. This leaves an application or a service process in a total hang state.
- Dmitry Vostokov @ DumpAnalysis.org -
Posted in Crash Dump Analysis, Debugging, Software Technical Support, Testing, Tools, WinDbg Tips and Tricks | 2 Comments »
Wednesday, December 24th, 2008
The analogy between learning a complex tool with its own language and a foreign natural language has been developed further after the release of WinDbg Learning Cards and finally culminated in “WinDbg In Use” book series with the first book to be published during the 1st quarter of 2009:
- Title: WinDbg In Use: Debugging Exercises (Elementary and Intermediate Level)
- Author: Dmitry Vostokov
- Publisher: Opentask (15 March 2009)
- Language: English
- Product Dimensions: 23.5 x 19.1
- ISBN-13: 978-1-906717-50-6
- Paperback: 200 pages
- Book Annotation: Includes 60 programmed exercises from real life debugging and crash dump analysis scenarios and multiple-choice questions with full answers, comments and suggestions for further reading.
Some example exercises will be published on this blog from time to time. I also plan a corresponding column in the forthcoming Debugged! magazine.
- Dmitry Vostokov @ DumpAnalysis.org -
Posted in Announcements, Assembly Language, Books, Common Mistakes, Crash Dump Analysis, Crash Dump Patterns, Debugging, Education and Research, English Language, Memory Dump Analysis Jobs, Minidump Analysis, Publishing, Security, Software Technical Support, Testing, Tools, Training and Seminars, WinDbg Scripts, WinDbg Tips and Tricks, WinDbg for GDB Users | No Comments »
Wednesday, December 3rd, 2008
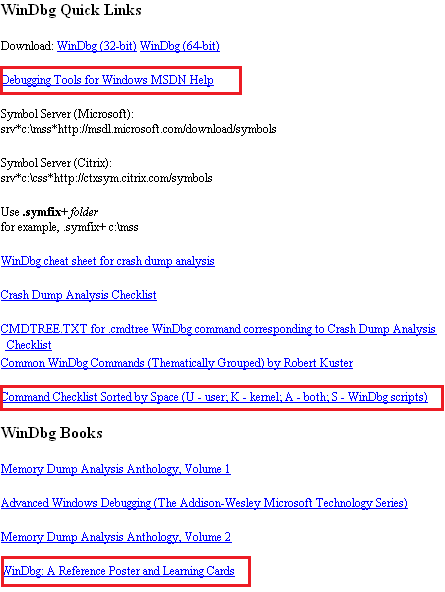
WinDbg.org has been updated to include a sorted command check list, a link to MSDN help and a link to yet another book related to WinDbg. All changes are highlighted in red on the following page screenshot:
- Dmitry Vostokov @ DumpAnalysis.org -
Posted in Announcements, Crash Dump Analysis, Debugging, Software Technical Support, Tools, WinDbg Tips and Tricks | No Comments »
Friday, November 28th, 2008
Due to some technical difficulties the release of WinDbg: A Reference Poster and Learning Cards has been delayed by 2 weeks. Now I got a proof copy and approved the book distribution on Amazon, B&N and other bookshops worldwide. Hope you will enjoy it and find it useful.
The similar book for GDB will be announced soon.
- Dmitry Vostokov @ DumpAnalysis.org -
Posted in Announcements, Books, Crash Dump Analysis, Crash Dump Patterns, Debugging, Publishing, Software Technical Support, Tools, WinDbg Tips and Tricks, WinDbg for GDB Users | No Comments »
Tuesday, November 25th, 2008
As one of the new initiatives for the Year of Debugging DumpAnalysis Portal will publish bimonthly full color 16 page publication called:
Debugged! MZ/PE: MagaZine for/from Practicing Engineers
The only serial publication dedicated entirely to Windows® debugging
The first issue is planned for March, 2009 and will have ISBN-13: 978-1-906717-38-4. If it goes well I’m planning to have ISSN number assigned to it too. More details will be announced soon.
- Dmitry Vostokov @ DumpAnalysis.org -
Posted in Announcements, Assembly Language, Books, Bugchecks Depicted, CDA Pattern Classification, Citrix, Common Mistakes, Crash Dump Analysis, Crash Dump Patterns, Crash Dumps for Dummies, Data Recovery, Debugged! MZ/PE, Debugging, IDA for WinDbg Users, Kernel Development, Memory Analysis Forensics and Intelligence, Memory Visualization, Minidump Analysis, Philosophy, Publishing, Security, Software Technical Support, Testing, Tools, Training and Seminars, Troubleshooting Methodology, Vista, WinDbg Scripts, WinDbg Tips and Tricks, WinDbg for GDB Users, Windows Server 2008 | 4 Comments »