Archive for the ‘Tools’ Category
Tuesday, May 13th, 2008
There are few tools available. Please drop a comment if you know any other. As the focus here is mainly troubleshooting Citrix terminal service environments I put links to Citrix articles where possible:
- Dmitry Vostokov @ DumpAnalysis.org -
Posted in CDF Analysis Tips and Tricks, Citrix, Debugging, Software Technical Support, Tools | No Comments »
Friday, May 9th, 2008
Thanks to Volker who noticed WinDbg online help I was able to quickly update my HTML version of CDA Poster to point to online links instead of the local help CHM file:
http://www.dumpanalysis.org/CDAPoster.html
It is also featured on http://www.windbg.org
I’m also working on the better version that will be released simultaneuosly with WDN book.
- Dmitry Vostokov @ DumpAnalysis.org -
Posted in Announcements, Crash Dump Analysis, Debugging, Software Technical Support, Tools, WinDbg Tips and Tricks | No Comments »
Thursday, May 8th, 2008
As always you can quickly get it through WinDbg Quick Links page:
http://www.windbg.org
- Dmitry Vostokov @ DumpAnalysis.org -
Posted in Announcements, Crash Dump Analysis, Debugging, Tools | No Comments »
Wednesday, May 7th, 2008
I’m presenting Citrix Tools at the famous PubForum event. It is a non-commercial Microsoft Terminal Services, Citrix, Virtualization and Server-Based Computing event. This year PubForum is held in Dublin, Republic of Ireland. See the final event details and agenda:
PubForum, 2008
My presentation date, time and topic are:
Friday, May 9, 19:00 “Citrix Tools - everything you need for troubleshooting, optimization and analysis”
See you there 
- Dmitry Vostokov @ DumpAnalysis.org -
Posted in Announcements, Citrix, Software Technical Support, Tools | No Comments »
Tuesday, May 6th, 2008
This is a must have book for system administrators of complex Windows server platforms and client workstations to understand and choose the best course of action to address system and application crashes, hangs, CPU spikes and memory leaks. It is also invaluable to general Windows users and technical support engineers.
- Title: Crash Dump Analysis for System Administrators and Support Engineers
- Authors: Thomas Monahan, Dmitry Vostokov
- Publisher: Opentask (30 November 2009)
- Language: English
- Product Dimensions: 22.86 x 15.24
- ISBN-13: 978-1-906717-02-5
- Paperback: 180 pages
- Dmitry Vostokov @ DumpAnalysis.org -
Posted in Announcements, Books, Crash Dump Analysis, Crash Dumps for Dummies, Minidump Analysis, Publishing, Software Technical Support, Tools, Troubleshooting Methodology, Vista, Windows Server 2008 | 1 Comment »
Thursday, May 1st, 2008
Preliminary Table of Contents is available for previously announced Windows® Debugging Notebook:
Draft Table of Contents
This book also features:
-
- 256 pages
-
- 64 essential WinDbg commands
-
- 32 essential concepts
-
- 16 essential tools including Citrix
-
- Hexadecimal and binary page numbering
-
- Quick base, meta and extension command reminder at the bottom of each page
-
- Expanded Crash Dump Analysis checklists
- Dmitry Vostokov @ DumpAnalysis.org -
Posted in Announcements, Books, Citrix, Crash Dump Analysis, Debugging, Software Technical Support, Tools, WinDbg Tips and Tricks | 3 Comments »
Friday, April 25th, 2008
This is the next scheduled book from Crash Dump Analysis Publishing Roadmap:
- Title: Windows® Debugging Notebook: Essential Concepts, WinDbg Commands and Tools
- Authors: Roberto Alexis Farah, Dmitry Vostokov
- Language: English
- Product Dimensions: 22.86 x 15.24
- ISBN-13: 978-1-906717-00-1
- Publisher: Opentask (1 December 2009)
- Paperback: 256 pages
- ISBN-13: 978-0-9558328-5-7
- Publisher: Opentask (1 February 2010)
- Hardcover (Cloth): 256 pages
Draft Table of Contents will be published next month together with a sample chapter.
- Dmitry Vostokov @ DumpAnalysis.org -
Posted in Announcements, Assembly Language, Books, Crash Dump Analysis, Debugging, Kernel Development, Minidump Analysis, Publishing, Software Technical Support, Tools, Vista, WinDbg Scripts, WinDbg Tips and Tricks, WinDbg for GDB Users, Windows Server 2008 | 1 Comment »
Friday, April 25th, 2008
Due to demand from people that prefer ebooks I published Memory Dump Analysis Anthology, Volume 1 in a digital format that can be purchased in Crash Dump Analysis Store. This format has color pictures inside.
- Dmitry Vostokov @ DumpAnalysis.org -
Posted in Announcements, Assembly Language, Books, Bugchecks Depicted, Citrix, Crash Dump Analysis, Crash Dump Patterns, Crash Dumps for Dummies, Debugging, Fun with Crash Dumps, GDB for WinDbg Users, Hardware, Kernel Development, Memory Dump Analysis Jobs, Memory Visualization, Minidump Analysis, Publishing, Science of Memory Dump Analysis, Security, Software Architecture, Software Technical Support, Stack Trace Collection, Tools, Troubleshooting Methodology, Vista, WinDbg Scripts, WinDbg Tips and Tricks, WinDbg for GDB Users, Windows Server 2008 | No Comments »
Saturday, April 19th, 2008
Often I’m asked about what a particular function that we see on a stack trace does. Over the time I found the following function name and purpose mining techniques and resources useful:
- - We might need to strip or replace prefixes and suffixes like
NtUserGetMessage
GetMessageW
ZwReadFile <-> NtReadFile
- - Search in MSDN, Platform SDK and WDK (formerly DDK) help
- - Various blogs like this excellent summary:
A catalog of NTDLL kernel mode to user mode callbacks
- - Reverse engineering and logical deduction:
What is KiFastSystemCallRet?
- - Various books like this:
Windows NT/2000 Native API Reference

- - Win32 API emulators like WINE
- - and finally Windows source code if you are a Microsoft source code licensee or a participant in Windows Academic Program.
- - Sometimes Internet search finds the description of the whole stack trace collection from the class of common processes like this one:
Production Debugging for .NET Framework Applications
- Dmitry Vostokov @ DumpAnalysis.org -
Posted in Books, Crash Dump Analysis, Debugging, Stack Trace Collection, Tools | No Comments »
Thursday, April 17th, 2008
Just to remind about this sometimes useful resource where we can check the product and indirectly any updates for the particular module if we have its file name and version from a crash dump, for example:
http://support.microsoft.com/dllhelp/
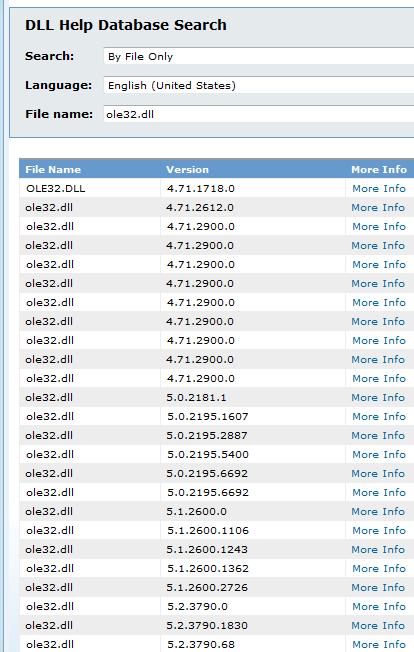
We can event see exports and component dependencies if we need to quickly check them without running depends.exe:
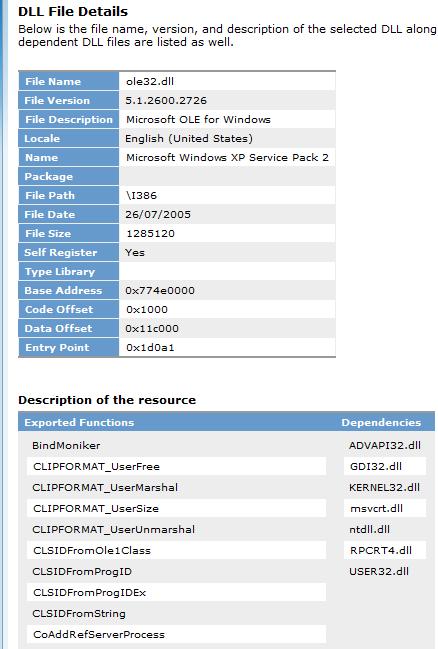
- Dmitry Vostokov @ DumpAnalysis.org -
Posted in Crash Dump Analysis, Software Technical Support, Tools | 1 Comment »
Tuesday, April 15th, 2008
I’m very proud to announce that it is finally available in both paperback and hardback. Why have I made available both editions? Because I personally prefer hardcover books. You can order the book today and it will be printed in 3-5 days (paperback) or 5-10 days (hardcover) and sent to you:
Memory Dump Analysis Anthology, Volume 1
Note: although listed on Amazon and other online bookstores it is not immediately available at these stores at the moment due to the late submission. I apologize for this. However, I expect that in a few weeks pre-orders taken there will be eventually fulfilled. In the mean time, if you want the book now, you can use the link above.
- Dmitry Vostokov @ DumpAnalysis.org -
Posted in Announcements, Assembly Language, Books, Bugchecks Depicted, CDF Analysis Tips and Tricks, Citrix, Crash Dump Analysis, Crash Dump Patterns, Crash Dumps for Dummies, Debugging, Fun with Crash Dumps, GDB for WinDbg Users, Hardware, Kernel Development, Memory Dump Analysis Jobs, Memory Visualization, Minidump Analysis, Publishing, Science of Memory Dump Analysis, Security, Software Architecture, Software Technical Support, Stack Trace Collection, Tools, Troubleshooting Methodology, Vista, WinDbg Scripts, WinDbg Tips and Tricks, WinDbg for GDB Users, Windows Server 2008 | 3 Comments »
Tuesday, April 15th, 2008
Sometimes we have a binary file or even a text file where we want to alter some bytes but we don’t have any binary editor at hand. We can use WinDbg for this purpose. To illustrate this, I created hello.bin file with “Hello World!” in its contents. Suppose we want to change it to “Hello WinDbg!”. First, we need to open any available full process user dump file and then get the list of valid address ranges by either using !address or lm command:
0:000> lm

start             end                 module name

00000000`00400000 00000000`0044d000   TestDefaultDebugger64

00000000`77850000 00000000`77981000   kernel32

00000000`77990000 00000000`77a5a000   user32

00000000`77a60000 00000000`77bda000   ntdll

000007fe`f8940000 000007fe`f8997000   winspool

000007fe`fcb00000 000007fe`fccf0000   comctl32

000007fe`fcfc0000 000007fe`fd012000   uxtheme

000007fe`fe1d0000 000007fe`fe2d4000   msctf

000007fe`fe380000 000007fe`fe3f1000   shlwapi

000007fe`fe660000 000007fe`fe799000   rpcrt4

000007fe`fe9f0000 000007fe`feac8000   oleaut32

000007fe`fead0000 000007fe`ff704000   shell32

000007fe`ff880000 000007fe`ff91a000   usp10

000007fe`ff920000 000007fe`ff9c1000   msvcrt

000007fe`ff9d0000 000007fe`ff9f8000   imm32

000007fe`ffa00000 000007fe`ffbe0000   ole32

000007fe`ffbe0000 000007fe`ffcdf000   advapi32

000007fe`ffce0000 000007fe`ffcec000   lpk

000007fe`ffcf0000 000007fe`ffd51000   gdi32
Let’s choose 00000000`00400000 address. It points to the following memory data:
0:000> dc 00000000`00400000

00000000`00400000  00905a4d 00000003 00000004 0000ffff  MZ..............

00000000`00400010  000000b8 00000000 00000040 00000000  ........@.......

00000000`00400020  00000000 00000000 00000000 00000000  ................

00000000`00400030  00000000 00000000 00000000 000000e8  ................

00000000`00400040  0eba1f0e cd09b400 4c01b821 685421cd  ........!..L.!Th

00000000`00400050  70207369 72676f72 63206d61 6f6e6e61  is program canno

00000000`00400060  65622074 6e757220 206e6920 20534f44  t be run in DOS

00000000`00400070  65646f6d 0a0d0d2e 00000024 00000000  mode....$.......
Now we load our hello.bin by specifying the this address and the number of bytes to load:
0:000> .readmem c:\dmitri\hello.bin 00000000`00400000 L0n12

Reading c bytes.
We see the new memory data immediately:
0:000> dc 00000000`00400000

00000000`00400000  6c6c6548 6f57206f 21646c72 0000ffff  Hello World!….

00000000`00400010  000000b8 00000000 00000040 00000000  ……..@…….

00000000`00400020  00000000 00000000 00000000 00000000  …………….

00000000`00400030  00000000 00000000 00000000 000000e8  …………….

00000000`00400040  0eba1f0e cd09b400 4c01b821 685421cd  ……..!..L.!Th

00000000`00400050  70207369 72676f72 63206d61 6f6e6e61  is program canno

00000000`00400060  65622074 6e757220 206e6920 20534f44  t be run in DOS

00000000`00400070  65646f6d 0a0d0d2e 00000024 00000000  mode….$…….
Then we can change it immediately using any of e* commands:
0:000> ea 00000000`00400000+6 "WinDbg!"
0:000> dc 00000000`00400000

00000000`00400000  6c6c6548 6957206f 6762446e 2100ffff  Hello WinDbg!…

00000000`00400010  000000b8 00000000 00000040 00000000  ……..@…….

00000000`00400020  00000000 00000000 00000000 00000000  …………….

00000000`00400030  00000000 00000000 00000000 000000e8  …………….

00000000`00400040  0eba1f0e cd09b400 4c01b821 685421cd  ……..!..L.!Th

00000000`00400050  70207369 72676f72 63206d61 6f6e6e61  is program canno

00000000`00400060  65622074 6e757220 206e6920 20534f44  t be run in DOS

00000000`00400070  65646f6d 0a0d0d2e 00000024 00000000  mode….$…….
Alternatively we can use GUI memory editor:
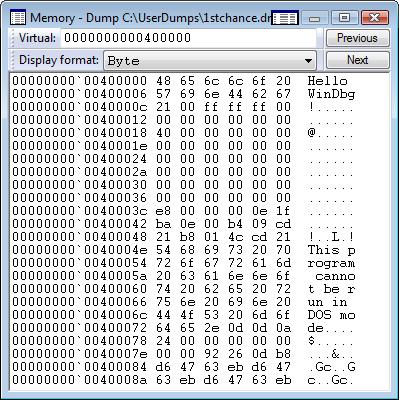
Now we can write memory contents back to our file:
0:000> .writemem c:\dmitri\hello.bin 00000000`00400000 L0n13

Writing d bytes.
- Dmitry Vostokov @ DumpAnalysis.org -
Posted in Tools, WinDbg Tips and Tricks | 4 Comments »
Saturday, April 12th, 2008
Because Citrix CDF traces are ETW based it should be possible to process and analyze them using XPrerf and XPerfView from the latest Microsoft Windows Performance Tools:
Windows Performance Tools Kit, v.4.1.1
- Dmitry Vostokov @ DumpAnalysis.org -
Posted in CDF Analysis Tips and Tricks, Citrix, Software Technical Support, Tools, Troubleshooting Methodology, Vista, Windows Server 2008 | No Comments »
Wednesday, April 2nd, 2008
Born out of 2008 April Fool’s joke (although I was thinking about it long before) the idea is to have a general framework and associated IDE for analysis activities for various tools that produce logs. Similar to planned GUI Monitor integrating WindowHistory, MesageHistory and ScreenHistory tools but also including Debugger Log Analyzer, Debugging Notebooks, various memory and trace log visualization subsystems. It also has the working title UTF (Unified Tools Framework).
Seems I’m very easy on inceptions All this will be covered in great detail in the forthcoming book which I tirelessly advertise:
DebugWare: The Art and Craft of Writing Troubleshooting Tools
- Dmitry Vostokov @ DumpAnalysis.org -
Posted in Announcements, Crash Dump Analysis, Crash Dump Patterns, Debugging, Memory Visualization, Minidump Analysis, Software Architecture, Software Technical Support, Stack Trace Collection, Tools, Troubleshooting Methodology | 2 Comments »
Monday, March 31st, 2008
Citrix CDF traces are based on ETW (Event Tracing for Windows) and therefore Citrix customers, their support personnel and developers can use MS TraceView tool for troubleshooting Citrix terminal service environments:
Viewing Common Diagnostics Facility (CDF) Traces Using TraceView
In cases with slow logon or slow process startup we can analyze process launch sequence to determine delays. In the output trace we can filter tzhook module messages which also contain session id (this is quite handy to differentiate between different sessions), for example:
PID      TID      TIME          MESSAGE

21864    21912    06:34:53.598  tzhook: Attach on process - cmd.exe session=51

21620    20372    06:34:59.754  tzhook: Attach on process - acregl.exe session=51

18668    21240    06:35:02.704  tzhook: Attach on process - cmstart.exe session=51

18560    18832    06:35:02.735  tzhook: Attach on process - wfshell.exe session=51

18204    20060    06:35:06.575  tzhook: Attach on process - icast.exe session=51

20640    21104    06:35:07.717  tzhook: Attach on process - LOGON.EXE session=51

21188    21032    06:35:07.938  tzhook: Attach on process - cscript.exe session=51

21888    19592    06:35:11.157  tzhook: Attach on process - WScript.exe session=51

20600    20732    06:35:11.780  tzhook: Attach on process - admin.exe session=51

17976    20456    06:35:18.752  tzhook: Attach on process - winlogon.exe session=53

21332    13156    06:35:51.625  tzhook: Attach on process - mpnotify.exe session=53

10988    10732    06:35:57.043  tzhook: Attach on process - rundll32.exe session=53
Here is another process launch sequence for published Notepad application:
PID     TID     TIME            MESSAGE

15828   18720   15:34:02.637    tzhook: Attach on process - winlogon.exe session=2

5300    18508   15:34:03.043    tzhook: Attach on process - mpnotify.exe session=2

17948   19300   15:34:03.356    tzhook: Attach on process - userinit.exe session=2

17956   19316   15:34:03.415    tzhook: Attach on process - cmd.exe session=2

5384    5324    15:34:03.443    tzhook: Attach on process - cmd.exe session=2

19432   19264   15:34:03.461    tzhook: Attach on process - SSONSVR.EXE session=2

12480   7472    15:34:03.466    tzhook: Attach on process - cmd.exe session=2

19448   19364   15:34:03.474    tzhook: Attach on process - net.exe session=2

19416   19656   15:34:03.489    tzhook: Attach on process - acregl.exe session=2

19480   19596   15:34:03.544    tzhook: Attach on process - cmstart.exe session=2

664     19512   15:34:03.559    tzhook: Attach on process - wfshell.exe session=2

19904   13140   15:34:03.610    tzhook: Attach on process - net.exe session=2

6864    20036   15:34:03.746    tzhook: Attach on process - icast.exe session=2

19540   20016   15:34:03.749    tzhook: Attach on process - ctfmon.exe session=2

19944   19032   15:34:03.757    tzhook: Attach on process - net.exe session=2

10232   18356   15:34:03.787    tzhook: Attach on process - notepad.exe session=2
Such sequences are also useful to determine a process upon which the session initialization or startup sequence hangs. In this case a user dump of that process might be useful.
Of course we can do all this with Process Monitor and other similar tools but here we get other Citrix related trace messages as well. All in one.
- Dmitry Vostokov @ DumpAnalysis.org -
Posted in CDF Analysis Tips and Tricks, Citrix, Software Trace Analysis, Tools | 3 Comments »
Tuesday, March 25th, 2008
Although the first volume has not been published yet (scheduled for 15th of April, 2008) the planning for the second volume has already begun. Preliminary information is:
- Title: Memory Dump Analysis Anthology, Volume 2
- Paperback: 512 pages (*)
- ISBN-13: 978-0-9558328-7-1
- Author: Dmitry Vostokov
- Publisher: Opentask (01 Oct 2008)
- Language: English
- Product Dimensions: 22.86 x 15.24
Hardcover version is also planned. PDF version will be available for download too.
(*) subject to change
- Dmitry Vostokov @ DumpAnalysis.org -
Posted in Announcements, Assembly Language, Books, Bugchecks Depicted, Crash Dump Analysis, Crash Dump Patterns, Crash Dumps for Dummies, Debugging, Fun with Crash Dumps, Hardware, Kernel Development, Memory Dump Analysis Jobs, Memory Visualization, Minidump Analysis, Science of Memory Dump Analysis, Security, Software Architecture, Software Technical Support, Stack Trace Collection, Tools, Troubleshooting Methodology, Vista, WinDbg Scripts, WinDbg Tips and Tricks, WinDbg for GDB Users, Windows Server 2008 | 1 Comment »
Thursday, March 20th, 2008
Why do we need yet another book about device drivers? There are couple of reasons here:
-
Old books are more about developing the narrow range of legacy drivers than troubleshooting and debugging them.
-
New books shift towards WDF and ignore legacy drivers.
-
Windows Internals book is too big and something lightweight is desperately needed.
-
No published driver books use UML as communication device and discuss driver developement as software factory.
-
Existing books mostly view device drivers as hardware device drivers.
I started collecting and organizing information about Windows drivers 2 years ago and published a few selected materials so you can get an approximate flavour of what is expected in the forthcoming book scheduled for the next year:
UML and Device Drivers
- Title: Windows Device Drivers: An Introduction
- Author: Dmitry Vostokov
- Paperback: 128 pages
- ISBN-13: 978-0-9558328-4-0
- Publisher: Opentask (15 Apr 2009)
- Language: English
- Product Dimensions: 22.86 x 15.24
- Dmitry Vostokov @ DumpAnalysis.org -
Posted in Announcements, Books, Debugging, Hardware, Kernel Development, Software Architecture, Software Technical Support, Tools, Vista, Windows Server 2008 | No Comments »
Thursday, March 20th, 2008
This is a forthcoming reference book for technical support and escalation engineers troubleshooting and debugging complex software issues. The book is also invaluable for software maintenance and development engineers debugging unmanaged, managed and native code.
- Title: Windows® Debugging Notebook: Essential Concepts, WinDbg Commands and Tools
- Author: Dmitry Vostokov
- Hardcover: 256 pages
- ISBN-13: 978-0-9558328-5-7
- Publisher: Opentask (1 September 2008)
- Language: English
- Product Dimensions: 22.86 x 15.24
- Dmitry Vostokov @ DumpAnalysis.org -
Posted in Announcements, Assembly Language, Books, Crash Dump Analysis, Crash Dumps for Dummies, Debugging, Kernel Development, Minidump Analysis, Software Technical Support, Tools, Vista, WinDbg Scripts, WinDbg Tips and Tricks, WinDbg for GDB Users, Windows Server 2008 | No Comments »
Tuesday, February 26th, 2008
Finally release dates are set for the following two books:
DebugWare: The Art and Craft of Writing Troubleshooting and Debugging Tools
- Author: Kapildev Ramlal, Dmitry Vostokov
- Paperback: 256 pages (*)
- ISBN-13: 978-0-9558328-3-3
- Publisher: Opentask (15 Nov 2008)
- Language: English
- Product Dimensions: 22.86 x 15.24
Windows® Crash Dump Analysis
- Author: Dmitry Vostokov
- Paperback: 512 pages (*)
- ISBN-13: 978-0-9558328-2-6
- Publisher: Opentask (01 Dec 2008)
- Language: English
- Product Dimensions: 22.86 x 15.24
The latter book will be shorter than planned initially and will contain references to Memory Dump Analysis Anthology, Volume I and Volume II.
(*) subject to change
- Dmitry Vostokov @ DumpAnalysis.org -
Posted in Announcements, Books, Crash Dump Analysis, Debugging, Software Architecture, Software Technical Support, Tools, Vista, Windows Server 2008 | No Comments »