Archive for the ‘Structural Memory Patterns’ Category
Wednesday, October 20th, 2010
As a practical example of applying behavioral and structural pattern analysis of computer memory and traces OpenTask plans to publish the following title next year:
- Title: Malware Patterns: Structure and Behavior of Computer Adware, Crimeware, Rootkits, Scareware, Spyware, Trojans, Viruses, Victimware and Worms
- Author: Dmitry Vostokov
- Paperback: 1200 pages
- Publisher: OpenTask (October 2011)
- ISBN-13: 978-1-908043-01-6
The inclusion of victimware is necessary because of the effects of defective malware.
- Dmitry Vostokov @ DumpAnalysis.org + TraceAnalysis.org -
Posted in Announcements, Books, Crash Dump Analysis, Crash Dump Patterns, Malware Analysis, Malware Patterns, Memiotics (Memory Semiotics), Memoretics, Memory Analysis Forensics and Intelligence, Publishing, Science of Memory Dump Analysis, Science of Software Tracing, Security, Software Behavior Patterns, Software Defect Construction, Software Trace Analysis, Software Victimology, Structural Memory Patterns, Trace Analysis Patterns, Victimware | No Comments »
Monday, October 18th, 2010
In order to start the analysis of a structured memory snapshot a debugger engine needs Anchor Region that describes memory layout and where to start unfolding of analysis. For example, it can be a list of modules (another forthcoming structural pattern). We can observe the importance of such regions when we try to open corrupt or severely truncated memory dumps:
[...]

KdDebuggerDataBlock is not present or unreadable.

[...]

Unable to read PsLoadedModuleList

[...]
For certain types of memory snapshots (like software traces) an anchor region coinsides with its structure description (message trace format for structured snapshots) and a trace file header (if any) for aggregate snapshots.
- Dmitry Vostokov @ DumpAnalysis.org + TraceAnalysis.org -
Posted in Crash Dump Analysis, Debugging, Memoretics, Structural Memory Patterns | 2 Comments »
Wednesday, October 13th, 2010
Another important pattern category is Memory Hierarchy. Typical examples include a complete memory dump with a physical to virtual mapping and paged out memory. Please note that page file is optional and paging can be implemented without a page file. There can be several layers of hierarchy, for example:
- physical memory
- virtualized physical memory
- virtual memory
Another example is from the protected mode x86 architecture:
- physical memory
- linear memory (paging, virtual)
- logical memory (segments)
- Dmitry Vostokov @ DumpAnalysis.org + TraceAnalysis.org -
Posted in Breakfast with Intel, Crash Dump Analysis, Debugging, Memoretics, Structural Memory Patterns | No Comments »
Thursday, October 7th, 2010
It is time now to introduce a syntactical notation for memory (dump) and software trace analysis pattern languages (in addition to graphical notation proposed earlier). It should be simple and concise: allow easy grammar with plain syntax and obvious reading semantics. We propose to use capitalized letters for major pattern categories, for example, W for wait chains and D for deadlocks. Then use subscripts (or small letters) for pattern subcategories, for example, Wcs and Dlpc. Several categories and subcategories can be combined by using slash (/), for example, Wcs/Dcs/lpc. Slash notation is better viewed using subscripts:
Wcs/Dcs/lpc
Next part will introduce more categories and propose notational adornments for pattern succession, space differentiation and the inclusion of details in notational sentences.
- Dmitry Vostokov @ DumpAnalysis.org + TraceAnalysis.org -
Posted in Analysis Notation, Crash Dump Analysis, Crash Dump Patterns, Debugging, Science of Memory Dump Analysis, Science of Software Tracing, Software Behavior Patterns, Software Trace Analysis, Structural Memory Patterns, Trace Analysis Patterns | No Comments »
Tuesday, October 5th, 2010
The choice of webinars below mostly reflects my personal preferences and long time desire to speak on topics like systems thinking, troubleshooting tool design and development. The other topic about BSOD minidump analysis was requested by participants in an ongoing survey. There will be more topics in 2011. All forthcoming webinars will be hosted by Memory Dump Analysis Services. The planning list includes:
Systems Thinking in Memory Dump and Software Trace Analysis
Software Troubleshooting and Debugging Tools: Objects, Components, Patterns and Frameworks with UML
- UML basics
- DebugWare patterns
- Unified Troubleshooting Framework
- RADII software development process
- Hands-on exercise: designing and building a tool
Blue Screen Of Death Analysis Done Right: Minidump Investigation for System Administrators
- Making sense of !analyze –v output
- Get extra troubleshooting information with additional WinDbg commands
- Guessing culprits with raw stack analysis
- Who’s responsible: hardware or software?
- Checklist and patterns
- Including hands-on exercises: send your own minidumps
More detailed information will be available soon.
- Dmitry Vostokov @ DumpAnalysis.org + TraceAnalysis.org -
Posted in Announcements, CDF Analysis Tips and Tricks, Common Mistakes, Common Questions, Crash Analysis Report Environment (CARE), Crash Dump Analysis, Crash Dump De-analysis, Crash Dump Patterns, Crash Dumps for Dummies, DebugWare Patterns, Debugging, Debugging Industry, Debugging Methodology, Escalation Engineering, General Memory Analysis, Hermeneutics of Memory Dumps and Traces, Memory Systems Language, Minidump Analysis, Software Architecture, Software Behavior Patterns, Software Engineering, Software Technical Support, Software Trace Analysis, Software Tracing for Dummies, Structural Memory Patterns, Systems Thinking, Tools, Trace Analysis Patterns, Training and Seminars, Troubleshooting Methodology, Vista, Webinars, WinDbg Tips and Tricks, Windows 7, Windows Server 2008, Windows System Administration, x64 Windows | No Comments »
Friday, October 1st, 2010
The next pattern is called Region Boundary. It is an inaccessible range of memory that surrounds Closed Memory Region. For example, the closed region of a kernel stack for the following thread has a one page boundary region next to its Base:
1: kd> !thread

THREAD fffffa8004544b60  Cid 0a6c.0acc  Teb: 000007fffffde000 Win32Thread: fffff900c1eb4010 RUNNING on processor 1

IRP List:

    fffffa8004d7e010: (0006,0118) Flags: 00060000  Mdl: 00000000

Not impersonating

DeviceMap                 fffff8a001e84c00

Owning Process            fffffa8004f68370       Image:         NotMyfault.exe

Attached Process          N/A            Image:         N/A

Wait Start TickCount      40290          Ticks: 0

Context Switch Count      408                 LargeStack

UserTime                  00:00:00.015

KernelTime                00:00:00.015

Win32 Start Address NotMyfault (0x0000000140002708)

Stack Init fffff8800587cdb0 Current fffff8800587c6f0

Base fffff8800587d000 Limit fffff88005874000 Call 0

[…]
1: kd> !pte fffff880`0587d000

                                           VA fffff8800587d000

PXE at FFFFF6FB7DBEDF88    PPE at FFFFF6FB7DBF1000    PDE at FFFFF6FB7E200160    PTE at FFFFF6FC4002C3E8

contains 0000000133D84863  contains 0000000133D83863  contains 00000000AA9AE863  contains 0000000000000000

pfn 133d84    ---DA--KWEV  pfn 133d83    ---DA--KWEV  pfn aa9ae     ---DA--KWEV  not valid
1: kd> !pte fffff880`0587d000+0n4096-1

  VA fffff8800587dfff

PXE at FFFFF6FB7DBEDF88 PPE at FFFFF6FB7DBF1000 PDE at FFFFF6FB7E200160 PTE at FFFFF6FC4002C3E8

contains 0000000133D84863 contains 0000000133D83863 contains 00000000AA9AE863 contains 0000000000000000

pfn 133d84 —DA–KWEV pfn 133d83 —DA–KWEV pfn aa9ae —DA–KWEV not valid
1: kd> !pte fffff880`0587d000+0n4096

                                           VA fffff8800587e000

PXE at FFFFF6FB7DBEDF88    PPE at FFFFF6FB7DBF1000    PDE at FFFFF6FB7E200160    PTE at FFFFF6FC4002C3F0

contains 0000000133D84863  contains 0000000133D83863  contains 00000000AA9AE863  contains 8000000028230963

pfn 133d84    —DA–KWEV  pfn 133d83    —DA–KWEV  pfn aa9ae     —DA–KWEV  pfn 28230     -G-DA–KW-V
The region after boundary belongs to another process thread kernel stack (I use CodeMachine WinDbg extension here):
1: kd> !cmkd.kvas  fffff8800587e000

kvas : Show region containing fffff8800587e000

### Start            End                                  Length Type

006 fffff88000000000 fffff89fffffffff       2000000000 ( 128 GB) SystemPTEs

Thread FFFFFA80053D0B60 [0798.0a5c] Stack fffff88005884000 - fffff8800587e000
1: kd> !thread FFFFFA80053D0B60

THREAD fffffa80053d0b60  Cid 0798.0a5c  Teb: 000007fffffdd000 Win32Thread: 0000000000000000 WAIT: (DelayExecution) UserMode Non-Alertable

    fffffa80053d0f20  Semaphore Limit 0x1

Not impersonating

DeviceMap                 fffff8a001e84c00

Owning Process            fffffa80053ce630       Image:         ApplicationB.exe

Attached Process          N/A            Image:         N/A

Wait Start TickCount      34911          Ticks: 5379 (0:00:01:23.912)

Context Switch Count      22

UserTime                  00:00:00.000

KernelTime                00:00:00.000

Win32 Start Address 0x000000013fe01538

Stack Init fffff88005883db0 Current fffff88005883970

Base fffff88005884000 Limit fffff8800587e000 Call 0

[…]
- Dmitry Vostokov @ DumpAnalysis.org + TraceAnalysis.org -
Posted in Crash Dump Analysis, Debugging, Memoretics, Memory Analysis Forensics and Intelligence, Structural Memory Patterns | No Comments »
Friday, October 1st, 2010
Now we propose the next group of general patterns related to memory regions (the terminology was partially influenced from topology). The first one we call Memory Region, for example:
1: kd> dp fffff88005875000 fffff88005875010

fffff880`05875000  039b5000`6e696268 00000000`00002000

fffff880`05875010  00000000`00000000
There are Open and Closed memory regions. We can extend the former ones in one or both directions:
1: kd> dp fffff88005875000-10 fffff88005875010+10

fffff880`05874ff0  6ab90c4f`039ba1b8 039b8050`fffffff8

fffff880`05875000  039b5000`6e696268 00000000`00002000

fffff880`05875010  00000000`00000000 00000000`00000000

fffff880`05875020  00000294`ffffffd0
The closed regions cannot be read past its boundary, like this kernel stack region [fffff880`05874000 fffff8800587d000):
1: kd> dp fffff88005874000-30

fffff880`05873fd0  ????????`???????? ????????`????????

fffff880`05873fe0  ????????`???????? ????????`????????

fffff880`05873ff0  ????????`???????? ????????`????????

fffff880`05874000  039ba000`6e696268 00000000`00001000

fffff880`05874010  00000000`00000000 00000000`00000000

fffff880`05874020  00206b6e`ffffffa8 01cae7bd`b8aca323

fffff880`05874030  039b6698`00000000 00000000`00000001

fffff880`05874040  ffffffff`039bafe8 039b6710`00000004
1: kd> dp fffff8800587d000-30

fffff880`0587cfd0  00000000`00000000 00000000`00000000

fffff880`0587cfe0  00000000`00000000 00000000`00000000

fffff880`0587cff0  00000000`00000000 00000000`00000000

fffff880`0587d000  ????????`???????? ????????`????????

fffff880`0587d010  ????????`???????? ????????`????????

fffff880`0587d020  ????????`???????? ????????`????????

fffff880`0587d030  ????????`???????? ????????`????????

fffff880`0587d040  ????????`???????? ????????`????????
- Dmitry Vostokov @ DumpAnalysis.org + TraceAnalysis.org -
Posted in Crash Dump Analysis, Debugging, Mathematics of Debugging, Memoretics, Memory Analysis Forensics and Intelligence, Structural Memory Patterns | 1 Comment »
Monday, September 27th, 2010
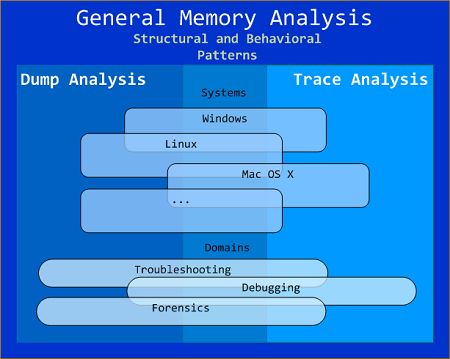
General Memory Analysis is another name for Memoretics, a discipline that studies memory snapshots including their similarities and differences on different system platforms such as Windows, Linus, Mac OS X, embedded and mobile systems, historical architectures, etc. The analysis of memory helps solve problems in various domains such as software troubleshooting and debugging, computer forensic analysis, etc.
The current focus of interdisciplinary research is to build a unified memory pattern language that covers both behavioral and structural patterns and also to study the possibility of building memory systems from below, not from requirements -> architecture -> design -> implementation -> compilation -> linking -> loading -> execution but from directly modeling and assembling memory systems using memory patterns.
- Dmitry Vostokov @ DumpAnalysis.org + TraceAnalysis.org -
Posted in Announcements, Crash Dump Analysis, Debugging, General Memory Analysis, Memiotics (Memory Semiotics), Memoretics, Memory Analysis Forensics and Intelligence, Memory Systems Language, Security, Software Behavior Patterns, Software Technical Support, Software Trace Analysis, Structural Memory Patterns, Trace Analysis Patterns | No Comments »
Sunday, September 26th, 2010
The next pattern is called Snapshot Collection. This is a collection of files combined from either linear memory snapshots or aggregate snapshots saved as separate files at different times. Typical examples include:
- Several process memory dump files saved sequentially from a growing heap leaking process
- Several software traces from working and non-working scenarios for comparative analysis
- Dmitry Vostokov @ DumpAnalysis.org + TraceAnalysis.org -
Posted in Crash Dump Analysis, Debugging, Memoretics, Memory Analysis Forensics and Intelligence, Structural Memory Patterns | No Comments »
Sunday, September 26th, 2010
The next pattern is called Aggregate Snapshot. It is any memory dump or software trace file that is combined from Memory Snapshots. Typical examples include:
- A minidump file where only specific memory ranges are included
- A software trace file combined from structured memory snapshots
Note. I’ve also created a dedicated page to list all structural patterns:
Structural Memory Analysis Patterns
- Dmitry Vostokov @ DumpAnalysis.org + TraceAnalysis.org -
Posted in Crash Dump Analysis, Debugging, Memoretics, Memory Analysis Forensics and Intelligence, Structural Memory Patterns | 1 Comment »
Friday, September 24th, 2010
Now it’s time to divide memory analysis patterns discerned so far as mostly abnormal software behavior memory dump and software trace patterns into behavioral and structural catalogues. The goal is to account for normal system-independent structural entities and relationships visible in memory like modules, threads, processes and so on.
The first pattern (and also a super-pattern) we discuss in this part is called Memory Snapshot. It is further subdivided into Structured Memory Snapshot and BLOB Memory Snapshot. Structured sub-pattern includes:
- Contiguous memory dump files with artificially generated headers (for example, physical or process virtual space memory dump)
- Software trace messages with imposed internal structure
BLOB sub-pattern variety includes address range snapshots without any externally imposed structure, for example, saved by .writemem WinDbg command or ReadProcessMemory API and contiguous buffer and raw memory dumps saved by various memory acquisition tools.
Behavioral patterns that relate to Memory Snapshot pattern are:
I strive initially to publish at least one such pattern every day to fill the gap of normal patterns in memory analysis and later add more multi-platform details and examples from other platforms like Linux, Mac OS X, embedded and selected important historical architectures.
- Dmitry Vostokov @ DumpAnalysis.org + TraceAnalysis.org -
Posted in Crash Dump Analysis, Crash Dump Patterns, Debugging, General Memory Analysis, Memiotics (Memory Semiotics), Memoretics, Memory Analysis Forensics and Intelligence, Memory Systems Language, Science of Memory Dump Analysis, Science of Software Tracing, Security, Software Behavior Patterns, Software Trace Analysis, Structural Memory Patterns | 1 Comment »