Archive for the ‘Software Trace Analysis’ Category
Thursday, April 8th, 2010
This is a new open source tool similar to PDBFinder in functionality but with much simpler interface and internal implementation (based on the file name structure of the certain classes of TMF files for ETW). To be released this month on TraceAnalysis.org.
- Dmitry Vostokov @ DumpAnalysis.org + TraceAnalysis.org -
Posted in CDF Analysis Tips and Tricks, Citrix, Debugging, Escalation Engineering, Software Technical Support, Software Trace Analysis, Tools | No Comments »
Monday, April 5th, 2010
Typical software narrative history consists of requests and responses, for example, function or object method calls and returns:
#     Module PID  TID  Time         File    Function Message

[...]

26060 dllA   1604 7108 10:06:21.746 fileA.c foo      Calling bar

[...]

26232 dllA   1604 7108 10:06:22.262 fileA.c foo      bar returns 0x5

[...]
The code that generates execution history is response-complete if it traces both requests and responses. For such code (except in cases where tracing is stopped before a response) the absence of expected responses could be a sign of blocked threads or quiet exception processing. The code that generates execution history is exception-complete if it also traces exception processing. Response-complete and exception-complete code is called call-complete. If we don’t see response messages for call-complete code we have Incomplete History.
In general, we can talk about the absence of certain messages in a trace as a deviation from the standard trace sequence template corresponding to a use case. The difference there is in a missing request too. This is a topic for next patterns.
- Dmitry Vostokov @ DumpAnalysis.org + TraceAnalysis.org -
Posted in CDF Analysis Tips and Tricks, Debugging, Software Narratology, Software Trace Analysis, Trace Analysis Patterns | No Comments »
Wednesday, March 24th, 2010
Here is one of the first case studies in pattern-driven software trace analysis. A user starts printing but nothing comes out. However, if the older printer driver is installed everything works as expected. We suspect that print spooler crashes if the newer printer driver is used. Based on known module name in ETW trace we find PID for print spooler process (19984) and immediately see discontinuity in the trace with the large time delta between the last PID message and the last trace statement (almost 4 minutes):
No   Source        PID   TID   Time         Message

712  \src\print\ui 19984 16200 12:22:31.571 PropertySheet returns 1

[… no messages for PID 19984 …]

5103 \src\mgmt   1292  7604  12:26:11.659 WaitAction
If we select the adjoint thread of source \src\print\driver (in other words, filter only its messages) we would see discontinuity with the similar time delta. We know that printer driver runs in print spooler context. However, PID had changed and that means print spooler was restarted (perhaps after a crash):
No   Source            PID   TID   Time         Message

557  \src\print\driver 19984 16200 12:22:28.069 DisableDevice returns

[… discontinuity for \print\driver …]

1462 \src\print\driver 10828 17584 12:26:03.854 DllMain
- Dmitry Vostokov @ DumpAnalysis.org + TraceAnalysis.org -
Posted in CDF Analysis Tips and Tricks, Debugging, Software Trace Analysis, Trace Analysis Patterns | No Comments »
Friday, March 19th, 2010
Recently, a reader of this blog sent me a minidump file and a debugger log of an application that had about 300 modules loaded in a process address space. What was interesting is the huge amount of ModLoad / Unload module debugger events in the log prior to an access violation exception. Some modules were loaded / unloaded many times, for example (only included lines for just one module but there were many other):
[...]

ModLoad: 16640000 16649000   X:\Client\Bin\ModuleA.dll

[...]

Unload module X:\Client\Bin\ModuleA.dll at 16640000

[...]

ModLoad: 192b0000 192b9000   X:\Client\Bin\ModuleA.dll

[...]

Unload module X:\Client\Bin\ModuleA.dll at 192b0000

[...]

ModLoad: 192b0000 192b9000   X:\Client\Bin\ModuleA.dll

[...]

Unload module X:\Client\Bin\ModuleA.dll at 192b0000

[...]

ModLoad: 161b0000 161b9000   X:\Client\Bin\ModuleA.dll

[...]

Unload module X:\Client\Bin\ModuleA.dll at 161b0000

[...]

ModLoad: 161e0000 161e9000   X:\Client\Bin\ModuleA.dll

[...]

Unload module X:\Client\Bin\ModuleA.dll at 161e0000

[...]

ModLoad: 161f0000 161f9000   X:\Client\Bin\ModuleA.dll

[...]

Unload module X:\Client\Bin\ModuleA.dll at 161f0000

[...]

ModLoad: 161f0000 161f9000   X:\Client\Bin\ModuleA.dll

[...]

Unload module X:\Client\Bin\ModuleA.dll at 161f0000

[...]

ModLoad: 161f0000 161f9000   X:\Client\Bin\ModuleA.dll

[...]

Unload module X:\Client\Bin\ModuleA.dll at 161f0000

[...]

ModLoad: 161f0000 161f9000   X:\Client\Bin\ModuleA.dll

[...]

Unload module X:\Client\Bin\ModuleA.dll at 161f0000

[...]

ModLoad: 161f0000 161f9000   X:\Client\Bin\ModuleA.dll

[...]

Unload module X:\Client\Bin\ModuleA.dll at 161f0000

[...]

ModLoad: 161f0000 161f9000   X:\Client\Bin\ModuleA.dll

[...]

Unload module X:\Client\Bin\ModuleA.dll at 161f0000

[...]

ModLoad: 161f0000 161f9000   X:\Client\Bin\ModuleA.dll

[...]

Unload module X:\Client\Bin\ModuleA.dll at 161f0000

[...]

ModLoad: 171b0000 171b9000   X:\Client\Bin\ModuleA.dll

[...]

Unload module X:\Client\Bin\ModuleA.dll at 171b0000

[...]

ModLoad: 25180000 25189000   X:\Client\Bin\ModuleA.dll

[...]

Unload module X:\Client\Bin\ModuleA.dll at 25180000

[...]

ModLoad: 171b0000 171b9000   X:\Client\Bin\ModuleA.dll

[...]

Unload module X:\Client\Bin\ModuleA.dll at 171b0000

[...]

ModLoad: 171b0000 171b9000   X:\Client\Bin\ModuleA.dll

[...]

Unload module X:\Client\Bin\ModuleA.dll at 171b0000

[...]

[...]

[...]

ModLoad: 0df60000 0df69000   X:\Client\Bin\ModuleA.dll

[...]

Unload module X:\Client\Bin\ModuleA.dll at 0df60000

[...]

(f38.560): Access violation - code c0000005 (first chance)

---

--- 1st chance AccessViolation exception ----

[...]
We see the component ModuleA was loaded at different addresses and this looks similar to a singleton object factory with Create / Destroy operations that resembles heap operations Alloc and Free where every allocation can place the same object at a different address. This is why I call all this a component or module heap. The application was COM-based and every domain-specific object was implemented in a separate in-proc COM DLL. There were thousands of such objects.
PS. This story reminds me that when I learnt about COM in 90s I wanted to redesign my word processor written in C to have every paragraph, line and even word to be implemented as a COM object.
- Dmitry Vostokov @ DumpAnalysis.org + TraceAnalysis.org -
Posted in Debugging, Software Trace Analysis, Trace Analysis Patterns | No Comments »
Monday, March 15th, 2010
On The Same Page - coming to the same conclusion as another engineer when looking at a memory dump or a software trace. Literally means the same page of memory where an exception occurred or a stack trace is reconstructed or the same “page” when browsing a software trace output using a viewer.
Examples: Aha, we are on the same page!
- Dmitry Vostokov @ DumpAnalysis.org + TraceAnalysis.org -
Posted in Crash Dump Analysis, Debugging, Debugging Slang, Escalation Engineering, Fun with Crash Dumps, Software Technical Support, Software Trace Analysis | No Comments »
Monday, March 8th, 2010
Sometimes we have a sequence of Activity Regions with increasing values of Statement Current, like depicted here:
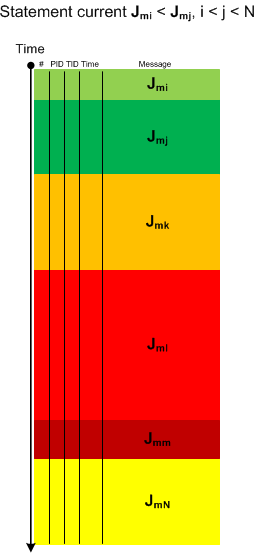
The boundaries of regions may be blurry and arbitrarily drawn. Nevertheless, the current is visibly increasing or decreasing, hence the name of this pattern: Trace Acceleration, by analogy with physical acceleration, second-order derivative. We can also metaphorically use here the notion of a partial derivative for trace statement current and acceleration for Threads of Activity and Adjoint Threads of Activity but whether it is useful remains to be seen.
- Dmitry Vostokov @ DumpAnalysis.org + TraceAnalysis.org -
Posted in CDF Analysis Tips and Tricks, Debugging, Software Trace Analysis, Software Trace Visualization, Trace Analysis Patterns | 1 Comment »
Thursday, March 4th, 2010
This is an extension of Thread of Activity pattern based on the concept of multibraiding and it is called Adjoint Thread of Activity correspondingly. I’m going to illustrate it soon when I publish a synthetic case study involving several software trace analysis patterns.
- Dmitry Vostokov @ DumpAnalysis.org + TraceAnalysis.org -
Posted in CDF Analysis Tips and Tricks, Debugging, Science of Software Tracing, Software Trace Analysis, Trace Analysis Patterns | 3 Comments »
Saturday, February 13th, 2010
Another useful pattern is called Time Delta. This is a time interval between significant events. For example,
#     Module PID  TID  Time         File    Function Message

1                      10:06:18.994                  (Start)

[...]

6060  dllA   1604 7108 10:06:21.746 fileA.c DllMain  DLL_PROCESS_ATTACH

[…]

24480 dllA   1604 7108 10:06:32.262 fileA.c Exec     Path: C:\Program Files\CompanyA\appB.exe

[…]

24550 dllB   1604 9588 10:06:32.362 fileB.c PostMsg  Event Q

[…]

28230                  10:07:05.170                  (End)
Such deltas are useful in examining delays. In the trace fragment above we are interested in dllA activity from its load until it launches appB.exe. We see that the time delta was only 10 seconds. The message #24550 was the last message from the process ID 1604 and after that we didn’t “hear” from that PID for more than 30 seconds until the tracing was stopped.
- Dmitry Vostokov @ DumpAnalysis.org + TraceAnalysis.org -
Posted in CDF Analysis Tips and Tricks, Debugging, Software Trace Analysis, Trace Analysis Patterns | 1 Comment »
Saturday, February 13th, 2010
When looking at software traces and doing either a search for or just scrolling certain messages have our attention immediately. We call them Significant Events and hence the name of this pattern, Significant Event. It could be a recorded exception or an error, a basic fact, a trace message from vocabulary index, or just any trace statement that marks the start of some activity we want to explore in depth, for example, a certain DLL is attached to the process, a coupled process is started or a function is called. The start of a trace and the end of it are trivial significant events and are used in deciding whether the trace is circular, in determining the trace recording interval or its average statement current.
- Dmitry Vostokov @ DumpAnalysis.org + TraceAnalysis.org -
Posted in CDF Analysis Tips and Tricks, Debugging, Software Trace Analysis, Trace Analysis Patterns | 1 Comment »
Friday, February 12th, 2010
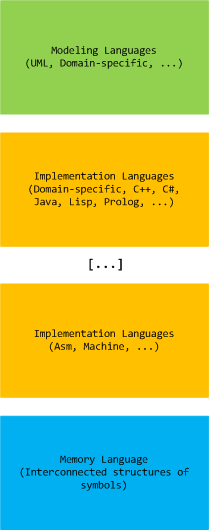
Computer memory analysis is based on interconnected structures of symbols and we state that there exists a memory language that extends a hierarchy of modeling and implementation languages (both domain-specific and general-purpose):
- Dmitry Vostokov @ DumpAnalysis.org + TraceAnalysis.org -
Posted in Crash Dump Analysis, Crash Dump Patterns, Memiotics (Memory Semiotics), Memoretics, Memory Systems Language, Software Trace Analysis, Trace Analysis Patterns | No Comments »
Thursday, February 11th, 2010
This is a revised, edited, cross-referenced and thematically organized volume of selected DumpAnalysis.org blog posts about crash dump analysis and debugging written in July 2009 - January 2010 for software engineers developing and maintaining products on Windows platforms, quality assurance engineers testing software on Windows platforms and technical support and escalation engineers dealing with complex software issues. The fourth volume features:
- 13 new crash dump analysis patterns
- 13 new pattern interaction case studies
- 10 new trace analysis patterns
- 6 new Debugware patterns and case study
- Workaround patterns
- Updated checklist
- Fully cross-referenced with Volume 1, Volume 2 and Volume 3
- New appendixes
Product information:
- Title: Memory Dump Analysis Anthology, Volume 4
- Author: Dmitry Vostokov
- Language: English
- Product Dimensions: 22.86 x 15.24
- Paperback: 410 pages
- Publisher: Opentask (30 March 2010)
- ISBN-13: 978-1-906717-86-5
- Hardcover: 410 pages
- Publisher: Opentask (30 April 2010)
- ISBN-13: 978-1-906717-87-2

Back cover features memory space art image: Internal Process Combustion.
- Dmitry Vostokov @ DumpAnalysis.org + TraceAnalysis.org -
Posted in .NET Debugging, Aesthetics of Memory Dumps, Announcements, AntiPatterns, Art, Assembly Language, Books, C and C++, CDA Pattern Classification, CDF Analysis Tips and Tricks, Categorical Debugging, Certification, Citrix, Code Reading, Common Mistakes, Computer Science, Countefactual Debugging, Crash Analysis Report Environment (CARE), Crash Dump Analysis, Crash Dump Patterns, Crash Dumps for Dummies, DebugWare Patterns, Debugging, Debugging Slang, Education and Research, Escalation Engineering, Fun with Crash Dumps, Games for Debugging, Hardware, Horrors of Computation, Hyper-V, Kernel Development, Laws of Troubleshooting and Debugging, Mathematics of Debugging, Memiotics (Memory Semiotics), Memoidealism, Memoretics, Memory Analysis Culture, Memory Analysis Forensics and Intelligence, Memory Dreams, Memory Dump Analysis Jobs, Memory Dumps in Movies, Memory Space Art, Memory Visualization, Memuonics, Minidump Analysis, Multithreading, Music for Debugging, New Acronyms, New Words, Opcodism, Philosophy, Physicalist Art, Publishing, Science Fiction, Science of Memory Dump Analysis, Science of Software Tracing, Security, Software Architecture, Software Defect Construction, Software Engineering, Software Generalist, Software Maintenance Institute, Software Narratology, Software Technical Support, Software Trace Analysis, Software Trace Visualization, Software Tracing for Dummies, Software Victimology, Stack Trace Collection, Testing, Tools, Trace Analysis Patterns, Training and Seminars, Troubleshooting Methodology, Victimware, Virtualization, Vista, Visual Dump Analysis, WinDbg Scripts, WinDbg Tips and Tricks, WinDbg for GDB Users, Windows 7, Windows Server 2008, Windows System Administration, Workaround Patterns | No Comments »
Friday, February 5th, 2010
STUPID - Software Tracing Under Pressure Is Dumb
Examples: STUPID! STUPID! I told you to enable all modules! You included all but the one I need…
- Dmitry Vostokov @ DumpAnalysis.org + TraceAnalysis.org -
Posted in Debugging, Debugging Slang, New Acronyms, Software Technical Support, Software Trace Analysis | No Comments »
Monday, January 18th, 2010
After exciting results of the previous year of debugging it is time to announce modest plans for this year, 0×7DA:
Release the first beta version of EasyDbg
Release the first beta version of CARE (Crash Analysis Report Environment) for a pattern-driven debugger log analyzer with standards for structured audience-driven reports
Release the first beta version of STARE (Software Trace Analysis Report Environment) for a pattern-driven software trace analyzer with corresponding standards for structured audience-driven reports
Publish the following books on dump analysis that address different audiences (general users, system administrators, support and escalation engineers, testers, software engineers, security and software defect researchers):
- Windows Debugging Notebook
- Crash Dump Analysis for System Administrators and Support Engineers
- Memory Dump Analysis Anthology, Volume 4
- Memory Dump Analysis Anthology, Volume 5
- Memory Dump Analysis Anthology Color Supplement
- Principles of Memory Dump Analysis
- My Computer Crashes and Freezes: A Non-technical Guide to Software and Hardware Errors
- Linux, FreeBSD and Mac OS X Debugging: Practical Foundations
- Encyclopedia of Crash Dump Analysis Patterns
- WinDbg In Use: Debugging Exercises
Publish articles related to memory dump analysis in Debugged! magazine
Update WinDbg Poster and Cards
- Dmitry Vostokov @ DumpAnalysis.org + TraceAnalysis.org -
Posted in Announcements, Books, Certification, Crash Dump Analysis, Debugging, Education and Research, Escalation Engineering, FreeBSD Crash Corner, Linux Crash Corner, Mac Crash Corner, New Acronyms, Publishing, Software Engineering, Software Technical Support, Software Trace Analysis | 1 Comment »
Sunday, January 17th, 2010
Having considered computational threads as braided strings and after discerning several software trace analysis patterns (just the beginning) we can see formatted and tabulated software trace output in a new light and employ the “fabric of traces” and braid metaphors for an Adjoint Thread concept. This new concept was motivated by reading about Extended Phenotype (*) and extensive analysis of Citrix ETW-based CDF traces using CDFAnalyzer. The term Adjoint was borrowed from mathematics because the concept we discuss below resembles this metaphorical formula: (Thread A, B) = [A, Thread B]. Let me first illustrate adjoint threading using simplified trace tables. Consider this generalized software trace example (date and time column is omitted for visual clarity):
|
#
|
Source Dir
|
PID
|
TID
|
File Name
|
Function
|
Message
|
|
1
|
\src\subsystemA
|
2792
|
5676
|
file1.cpp
|
fooA
|
Message text…
|
|
2
|
\src\subsystemA
|
2792
|
5676
|
file1.cpp
|
fooA
|
Message text…
|
|
3
|
\src\subsystemA
|
2792
|
5676
|
file1.cpp
|
fooA
|
Message text…
|
|
4
|
\src\lib
|
2792
|
5680
|
file2.cpp
|
barA
|
Message text…
|
|
5
|
\src\subsystemA
|
2792
|
5680
|
file1.cpp
|
fooA
|
Message text…
|
|
6
|
\src\subsystemA
|
2792
|
5676
|
file1.cpp
|
fooA
|
Message text…
|
|
7
|
\src\lib
|
2792
|
5680
|
file2.cpp
|
fooA
|
Message text…
|
|
8
|
\src\lib
|
2792
|
5680
|
file2.cpp
|
fooA
|
Message text…
|
|
9
|
\src\subsystemB
|
2792
|
3912
|
file3.cpp
|
barB
|
Message text…
|
|
10
|
\src\subsystemB
|
2792
|
3912
|
file3.cpp
|
barB
|
Message text…
|
|
11
|
\src\subsystemB
|
2792
|
3912
|
file3.cpp
|
barB
|
Message text…
|
|
12
|
\src\subsystemB
|
2792
|
3912
|
file3.cpp
|
barB
|
Message text…
|
|
13
|
\src\subsystemB
|
2792
|
3912
|
file3.cpp
|
barB
|
Message text…
|
|
14
|
\src\subsystemB
|
2792
|
3912
|
file3.cpp
|
barB
|
Message text…
|
|
15
|
\src\subsystemB
|
2792
|
2992
|
file4.cpp
|
fooB
|
Message text…
|
|
16
|
\src\subsystemB
|
2792
|
3008
|
file4.cpp
|
fooB
|
Message text…
|
|
…
|
…
|
…
|
…
|
…
|
…
|
…
|
We see several threads in a process PID 2792. In CDFAnalyzer we can filter trace messages that belong to any column and if we filter by TID we get a view of any Thread of Activity. However, each thread can “run” through any source directory, file name or function. If a function belongs to a library multiple threads would access it. This source location (can be considered as a subsystem), file or function view of activity is called an Adjoint Thread. For example, if we filter only subsystemA column in the trace above we get this table:
|
#
|
Source Dir
|
PID
|
TID
|
File Name
|
Function
|
Message
|
|
1
|
\src\subsystemA
|
2792
|
5676
|
file1.cpp
|
fooA
|
Message …
|
|
2
|
\src\subsystemA
|
2792
|
5676
|
file1.cpp
|
fooA
|
Message …
|
|
3
|
\src\subsystemA
|
2792
|
5676
|
file1.cpp
|
fooA
|
Message …
|
|
5
|
\src\subsystemA
|
2792
|
5680
|
file1.cpp
|
fooA
|
Message …
|
|
6
|
\src\subsystemA
|
2792
|
5676
|
file1.cpp
|
fooA
|
Message …
|
|
7005
|
\src\subsystemA
|
2792
|
5664
|
file1.cpp
|
fooA
|
Message …
|
|
10198
|
\src\subsystemA
|
2792
|
5664
|
file1.cpp
|
fooA
|
Message …
|
|
10364
|
\src\subsystemA
|
2792
|
5664
|
file1.cpp
|
fooA
|
Message …
|
|
10417
|
\src\subsystemA
|
2792
|
5664
|
file1.cpp
|
fooA
|
Message …
|
|
10420
|
\src\subsystemA
|
2792
|
5676
|
file1.cpp
|
fooA
|
Message …
|
|
10422
|
\src\subsystemA
|
2792
|
5680
|
file1.cpp
|
fooA
|
Message …
|
|
10587
|
\src\subsystemA
|
2792
|
5664
|
file1.cpp
|
fooA
|
Message …
|
|
10767
|
\src\subsystemA
|
2792
|
5680
|
file1.cpp
|
fooA
|
Message …
|
|
11126
|
\src\subsystemA
|
2792
|
5668
|
file1.cpp
|
fooA
|
Message …
|
|
11131
|
\src\subsystemA
|
2792
|
5680
|
file1.cpp
|
fooA
|
Message …
|
|
11398
|
\src\subsystemA
|
2792
|
5676
|
file1.cpp
|
fooA
|
Message …
|
|
11501
|
\src\subsystemA
|
2792
|
5668
|
file1.cpp
|
fooA
|
Message …
|
|
11507
|
\src\subsystemA
|
2792
|
5668
|
file1.cpp
|
fooA
|
Message …
|
|
11509
|
\src\subsystemA
|
2792
|
5664
|
file1.cpp
|
fooA
|
Message …
|
|
11513
|
\src\subsystemA
|
2792
|
5680
|
file1.cpp
|
fooA
|
Message …
|
|
11524
|
\src\subsystemA
|
2792
|
5668
|
file1.cpp
|
fooA
|
Message …
|
|
…
|
…
|
…
|
…
|
…
|
…
|
…
|
We can graphically view subsystemA as a braid string that “permeates the fabric of threads”:
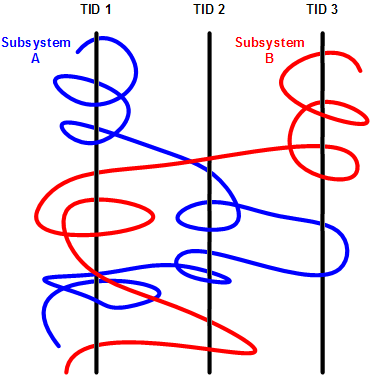
We can get many different braids by changing filters, hence multibraiding. Here is another example of a driver source file view initially permeating 2 process contexts and 4 threads:
|
#
|
Source Dir
|
PID
|
TID
|
File Name
|
Function
|
Message
|
|
41
|
\src\sys\driver
|
3636
|
3848
|
entry.c
|
DriverEntry
|
IOCTL …
|
|
80
|
\src\sys\driver
|
3636
|
3896
|
entry.c
|
DriverEntry
|
IOCTL …
|
|
99
|
\src\sys\driver
|
3636
|
3896
|
entry.c
|
DriverEntry
|
IOCTL …
|
|
102
|
\src\sys\driver
|
3636
|
3896
|
entry.c
|
DriverEntry
|
IOCTL …
|
|
179
|
\src\sys\driver
|
3636
|
3896
|
entry.c
|
DriverEntry
|
IOCTL …
|
|
180
|
\src\sys\driver
|
3636
|
3896
|
entry.c
|
DriverEntry
|
IOCTL …
|
|
311
|
\src\sys\driver
|
3636
|
3896
|
entry.c
|
DriverEntry
|
IOCTL …
|
|
447
|
\src\sys\driver
|
3636
|
3896
|
entry.c
|
DriverEntry
|
IOCTL …
|
|
448
|
\src\sys\driver
|
3636
|
3896
|
entry.c
|
DriverEntry
|
IOCTL …
|
|
457
|
\src\sys\driver
|
2792
|
5108
|
entry.c
|
DriverEntry
|
IOCTL …
|
|
608
|
\src\sys\driver
|
3636
|
3896
|
entry.c
|
DriverEntry
|
IOCTL …
|
|
614
|
\src\sys\driver
|
3636
|
3896
|
entry.c
|
DriverEntry
|
IOCTL …
|
|
655
|
\src\sys\driver
|
3636
|
3896
|
entry.c
|
DriverEntry
|
IOCTL …
|
|
675
|
\src\sys\driver
|
3636
|
3896
|
entry.c
|
DriverEntry
|
IOCTL …
|
|
678
|
\src\sys\driver
|
3636
|
3896
|
entry.c
|
DriverEntry
|
IOCTL …
|
|
680
|
\src\sys\driver
|
3636
|
3896
|
entry.c
|
DriverEntry
|
IOCTL …
|
|
681
|
\src\sys\driver
|
3636
|
3896
|
entry.c
|
DriverEntry
|
IOCTL …
|
|
1145
|
\src\sys\driver
|
3636
|
4960
|
entry.c
|
DriverEntry
|
IOCTL …
|
|
1153
|
\src\sys\driver
|
3636
|
4960
|
entry.c
|
DriverEntry
|
IOCTL …
|
|
1154
|
\src\sys\driver
|
3636
|
4960
|
entry.c
|
DriverEntry
|
IOCTL …
|
|
…
|
…
|
…
|
…
|
…
|
…
|
…
|
(*) A bit of digression. Looks like biology keeps giving insights into software, there is even a software phenotype metaphor albeit a bit restricted to code, I just thought that we need also an Extended Software Phenotype.
- Dmitry Vostokov @ DumpAnalysis.org + TraceAnalysis.org -
Posted in Citrix, Computer Science, Debugging, Mathematics of Debugging, Multithreading, New Words, Science of Software Tracing, Software Trace Analysis, Software Trace Visualization, Trace Analysis Patterns | 2 Comments »
Thursday, January 14th, 2010
The Year of Debugging, 0×7D9, was a remarkable year for DumpAnalysis.org. Here is the list of achievements to report:
- Software Trace Analysis as a new discipline with its own set of patterns
- Unification of Memory Dump Analysis with Software Trace Analysis (DA+TA)
- New computer memory dump-based art movements: Opcodism and Physicalist Art
- Discovery of 3D computer memory visualization techniques
- Establishing Software Maintenance Institute
- Broadening software fault injection as Software Defect Construction discipline
- Establishing a new profession of a Software Defect Researcher
- Starting ambitious Dictionary of Debugging
- Publishing Windows Debugging: Practical Foundations book
- Publishing the first x86-free Windows debugging book: x64 Windows Debugging: Practical Foundations
- Establishing the new debugging magazine: Debugged! MZ/PE
- Publishing Memory Dump Analysis Anthology, Volume 3
- Cooperation with OpenTask to promote First Fault Software Problem Solving book
- Establishing Debugging Expert(s) Magazine Online
- Creating the first development process for debugging and software troubleshooting tools: RADII
- Publishing the first pattern-driven memory dump analysis troubleshooting methodology as a foundation for software debugging
- Proposal for an International Memory Analysts and Debuggers Day
- Almost completed Windows Debugging Notebook to be published soon
Now DumpAnalysis.org focuses on The Year of Dump Analysis, 0×7DA, as a foundation for the forthcoming debugging decade and reveals future plans this weekend.
I’m sure that many other organizations and individuals have no less remarkable accomplishments to report for 2009. I promise to track down and write about some of them in the forthcoming book:
The Science of Dr. Watson: An Illustrated History of Debugging (ISBN: 978-1906717070)
- Dmitry Vostokov @ DumpAnalysis.org + TraceAnalysis.org -
Posted in Announcements, Art, Books, Citrix, Crash Dump Analysis, Debugged! MZ/PE, Debugging, Dictionary of Debugging, History, Memory Visualization, Publishing, Software Defect Construction, Software Engineering, Software Maintenance Institute, Software Technical Support, Software Trace Analysis, Trace Analysis Patterns | 1 Comment »
Tuesday, January 12th, 2010
Inter-Correlation pattern is analogous to the previously described Intra-Correlation pattern but involves several traces from possibly different trace agents recorded (most commonly) at the same time or during an overlapping time interval:
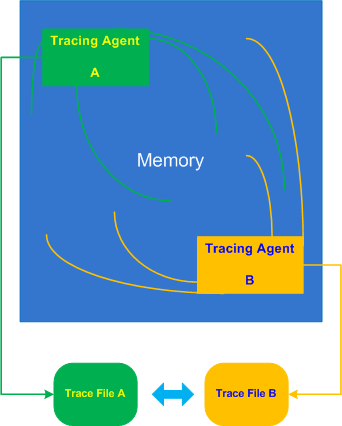
Let’s look at a typical example of an application subclassing windows to add additional look and feel element to its GUI or thjat hooks into window messaging. Suppose this application also records important trace points like window parameters before and after subclassing using ETW technology (Event Tracing for Windows). When we run the application in terminal services environment all windows (including other processes) are shown with an incorrect dimension. We therefore request the application trace and in addition WindowHistory trace to see how coordinates of all windows are changed over time. We easily find some Basic Facts in both traces such as window class name or time but it looks like window handle is different. In another set of traces recorded for comparison we have same window handle values, class name is absent from the ETW trace but a process and thread ID for the same window handle are different. We, therefore, don’t see a correlation between these traces and suspect that both traces in 2 sets were recorded in different terminal sessions, for example:
ETW trace:
#      PID   TID   Time          Message

[…]

46750  5890  6960  10:17:18.825  Subclassing, handle=0×100B8, class=MyWindowClass, […]

[…]
WindowHistory trace:
Handle: 0001006E Class: “MyWindowClass” Title: “”

Captured at: 10:17:19:637

   Process ID: 19e0

Thread ID: 16e4

Parent: 0

Screen position (l,t,r,b): (-2,896,1282,1026)

Client rectangle (l,t,r,b): (0,0,1276,122)

Visible: true

Window placement command: SW_SHOWNORMAL

Foreground: false

HungApp: false

Minimized: false

Maximized: false

[…]
- Dmitry Vostokov @ TraceAnalysis.org -
Posted in CDF Analysis Tips and Tricks, Debugging, Software Trace Analysis, Trace Analysis Patterns | No Comments »
Thursday, January 7th, 2010
Some practical engineers asked me how do Debugged! MZ/PE magazine back covers look like from a birds eye view:
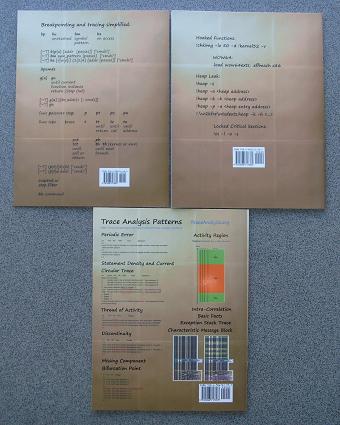
One engineer even commented that they look better and better (counterclockwise) :-)
- Dmitry Vostokov @ DumpAnalysis.org -
Posted in Announcements, Art, Books, CDF Analysis Tips and Tricks, Crash Dump Analysis, Crash Dump Patterns, Debugged! MZ/PE, Debugging, Publishing, Software Trace Analysis, Trace Analysis Patterns, WinDbg Tips and Tricks | No Comments »
Thursday, December 31st, 2009
What will you do confronted with a one million trace messages recorded between 10:44:15 and 10:46:55 with an average trace statement current of 7,000 msg/s from dozens of modules and having a one sentence problem description? One solution is to try to search for a specific vocabulary relevant to the problem description, for example, if a problem is an intermittent re-authentication then we might try to search for a word “password” or a similar one drawn from a troubleshooting domain vocabulary. So it is useful to have a Vocabulary Index to search for. Hence, the same name of this pattern. In our trace example, the search for “password” jumps straight to a small activity region of authorization modules starting from the message number #180,010 and the last “password” occurrence is in the message #180,490 that narrows initial analysis region to just 500 messages. Note the similarity here between a book and its index and a trace as a software narrative and its vocabulary index.
- Dmitry Vostokov @ TraceAnalysis.org -
Posted in CDF Analysis Tips and Tricks, Debugging, Software Narratology, Software Trace Analysis, Trace Analysis Patterns | 1 Comment »
Sunday, December 27th, 2009
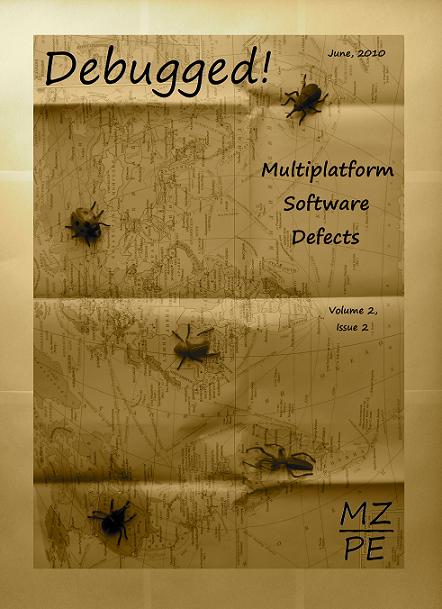
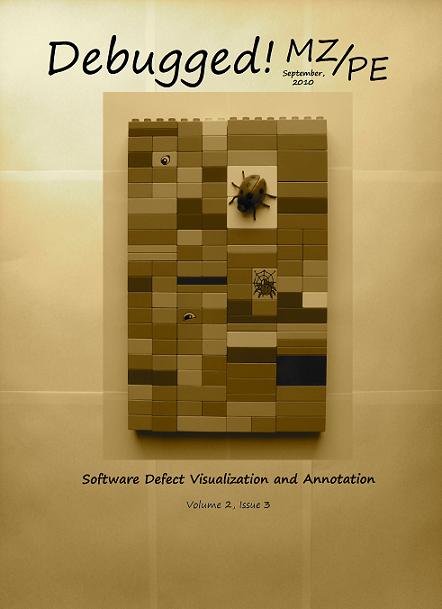
Main topics of Debugged! MZ/PE magazine issues for June and September 2010:
Debugged! MZ/PE: Multiplatform Software Defects, June, 2010 (Paperback, ISBN: 978-1906717902)
Debugged! MZ/PE: Software Defect Visualization and Annotation, September, 2010 (Paperback, ISBN: 978-1906717919)
Here are draft front covers designed today:
- Dmitry Vostokov @ DumpAnalysis.org -
Posted in Announcements, Books, Computer Science, Crash Dump Analysis, Debugged! MZ/PE, Debugging, Memory Visualization, Publishing, Software Engineering, Software Technical Support, Software Trace Analysis, Software Trace Visualization | No Comments »
Sunday, December 20th, 2009
“Memory dumps are facts.”
I’m very excited to announce that Volume 3 is available in paperback, hardcover and digital editions:
Memory Dump Analysis Anthology, Volume 3
Table of Contents
In two weeks paperback edition should also appear on Amazon and other bookstores. Amazon hardcover edition is planned to be available in January 2010.
The amount of information was so voluminous that I had to split the originally planned volume into two. Volume 4 should appear by the middle of February together with Color Supplement for Volumes 1-4.
- Dmitry Vostokov @ DumpAnalysis.org -
Posted in .NET Debugging, Aesthetics of Memory Dumps, Announcements, AntiPatterns, Art, Assembly Language, Books, Bugtations, C and C++, CDA Pattern Classification, CDF Analysis Tips and Tricks, Certification, Citrix, Code Reading, Common Mistakes, Computer Science, Crash Dump Analysis, Crash Dump Patterns, Crash Dumps for Dummies, DebugWare Patterns, Debugging, Debugging Slang, Deep Down C++, Education and Research, Escalation Engineering, Fun with Crash Dumps, Hardware, Horrors of Computation, Kernel Development, Mathematics of Debugging, Memiotics (Memory Semiotics), Memoidealism, Memoretics, Memory Analysis Culture, Memory Analysis Forensics and Intelligence, Memory Space Art, Memory Visualization, Minidump Analysis, Multithreading, Philosophy, Poetry, Publishing, Science of Memory Dump Analysis, Science of Software Tracing, Security, Software Architecture, Software Defect Construction, Software Engineering, Software Narratology, Software Technical Support, Software Trace Analysis, Software Trace Visualization, Software Tracing for Dummies, Software Victimology, Stack Trace Collection, Testing, Tools, Trace Analysis Patterns, Training and Seminars, Troubleshooting Methodology, Victimware, Virtualization, Vista, Visual Dump Analysis, WinDbg Scripts, WinDbg Tips and Tricks, WinDbg for GDB Users, Windows 7, Windows Server 2008, Windows System Administration | 1 Comment »