Archive for the ‘Software Trace Analysis’ Category
Thursday, December 17th, 2009
Previously announced Software Maintenance Institute was finally registered in Ireland (Reg. No. 400906) and its certificate was received yesterday.
Here is the current component structure of various institutions (depicted in UML):
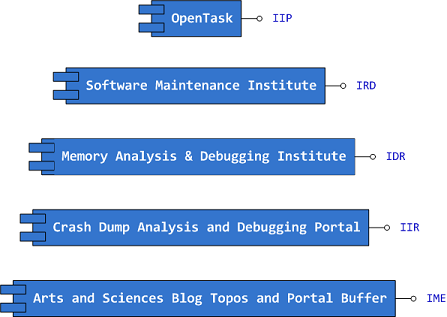
Interface Tags:
IIP Interface of Iterative Publishing

IRD Interface of Research and Development

IDR Interface of Defect Research

IIR Interface of Information Repository

IME Interface of Memetic Engineering
- Dmitry Vostokov @ DumpAnalysis.org -
Posted in Announcements, Art, Certification, Computer Science, Crash Dump Analysis, Debugging, Education and Research, Escalation Engineering, History, Memiotics (Memory Semiotics), Memoidealism, Memoretics, Memory Analysis Culture, Memory Analysis Forensics and Intelligence, Memory Auralization, Memory Visualization, Philosophy, Publishing, Science of Memory Dump Analysis, Science of Software Tracing, Security, Software Architecture, Software Engineering, Software Maintenance Institute, Software Technical Support, Software Trace Analysis, Software Victimology, Testing, Training and Seminars | No Comments »
Wednesday, December 16th, 2009
Finally, after the long delay, the issue is available in print on Amazon and through other sellers:
Debugged! MZ/PE: Software Tracing

- Dmitry Vostokov @ DumpAnalysis.org -
Posted in Announcements, Books, CDF Analysis Tips and Tricks, Computer Science, Crash Dump Analysis, Crash Dump Patterns, Debugged! MZ/PE, Debugging, Education and Research, Fun with Crash Dumps, Memoretics, Memory Visualization, Publishing, Science of Memory Dump Analysis, Science of Software Tracing, Software Technical Support, Software Trace Analysis, Software Trace Visualization, Testing, Tools, Trace Analysis Patterns, Training and Seminars, Troubleshooting Methodology, Visual Dump Analysis | 1 Comment »
Saturday, December 5th, 2009
The art of DA+TA analysis now acquires a Latin name: Ars Recordatio (from Latin recordatio: recollection, memory, recall and ars (artis): art, skill, method, technique, knowledge, method, science, way, conduct, character). Other variations I rejected, Ars Memoria, Ars Indicium and Ars Animus, are either widely used in a different sense or presuppose some kind of intelligence inside memory dumps and traces (animus).
- Dmitry Vostokov @ DumpAnalysis.org -
Posted in Announcements, Crash Dump Analysis, Fun with Crash Dumps, Software Trace Analysis | No Comments »
Tuesday, November 17th, 2009
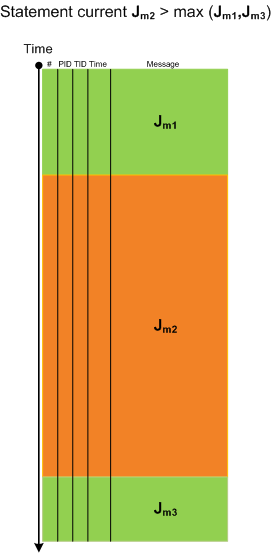
When looking at lengthy traces with thousands and millions of messages (trace statements) we can see regions of activity where statement current (Jm, msg/s) is much higher than in surrounding temporal regions. Hence the name of this pattern, Activity Region. Here is an illustration for a typical ETW/CDF trace where a middle region of activity (Jm2) signifies a system performing some response function like a user session initialization and application launch:
- Dmitry Vostokov @ TraceAnalysis.org -
Posted in CDF Analysis Tips and Tricks, Debugging, Software Trace Analysis, Software Trace Visualization, Trace Analysis Patterns | 8 Comments »
Saturday, November 7th, 2009
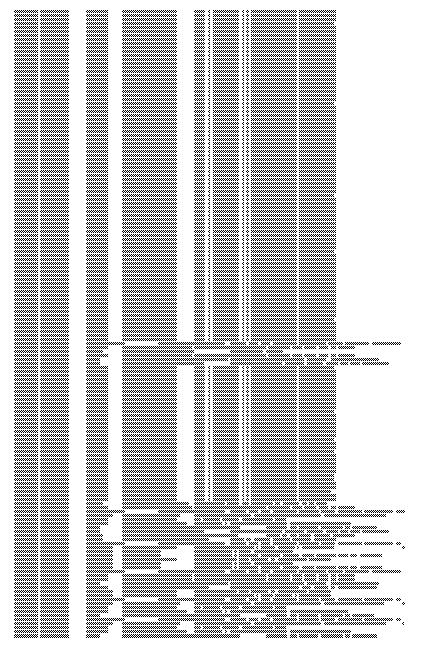
Birds eye view of software traces makes it easier to see their coarse blocked structure:
where further finer structure is discernible and even nested blocks:
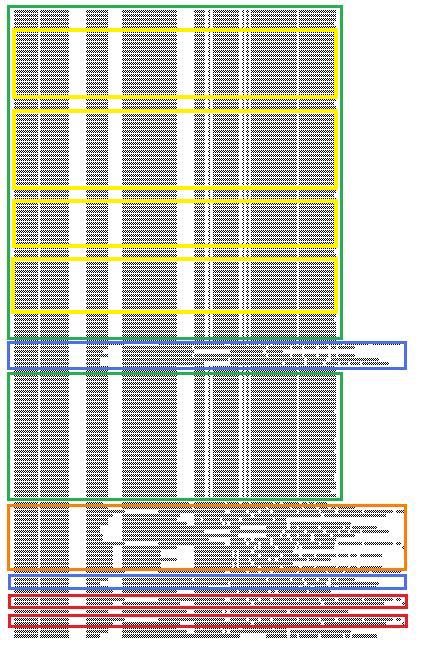
Some blocks of output can be seen when scrolling trace viewer output but if a viewer support zooming it is possible to get an overview and jump directly into a Characteristic Message Block, for example, debug messages of repeated attempts to query a database. If a viewer supports message coloring it also helps. Sometimes this technique is useful to ignore bulk messages and start the analysis around block boundaries.
- Dmitry Vostokov @ TraceAnalysis.org -
Posted in Citrix, Debugging, Memory Visualization, Software Trace Analysis, Software Trace Visualization, Trace Analysis Patterns | 2 Comments »
Friday, November 6th, 2009
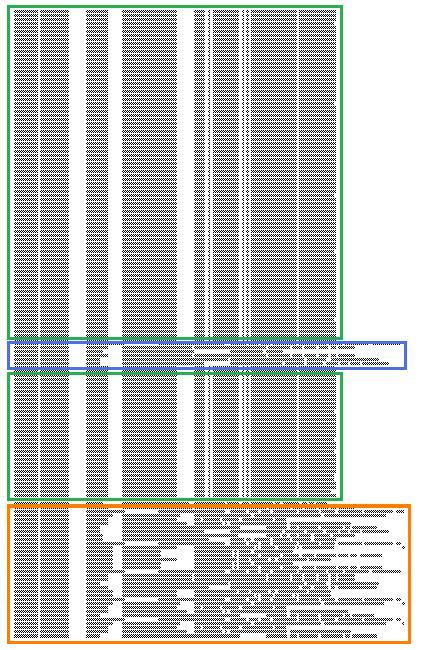
Here is a fragment of a condensed view of a CDF (ETW-based) trace imported into MS Word:
- Dmitry Vostokov @ TraceAnalysis.org -
Posted in CDF Analysis Tips and Tricks, Debugging, Memory Visualization, Software Trace Analysis, Software Trace Visualization, Trace Analysis Patterns | 1 Comment »
Friday, October 23rd, 2009
What prompted me to found this discipline (that is supposed to be a sister discipline of software criminology, software security, secure code construction and software defect construction) is understanding that some software components are innocent victims of other component coding mistakes or deliberate subversion and some start as a part of crimeware but eventually become victims themselves (they crash, hang, spike, leak, are dumped, subverted, etc.). I would also like to borrow and reuse the neglected term victimware here in a broad sense. More on this later as I have to switch to software trace analysis patterns.
- Dmitry Vostokov @ DumpAnalysis.org -
Posted in Code Reading, Crash Dump Analysis, Debugging, Memory Analysis Forensics and Intelligence, Security, Software Defect Construction, Software Engineering, Software Trace Analysis, Software Victimology, Victimware | 1 Comment »
Thursday, October 22nd, 2009
One ETW trace pointed to a set of intermittent symptoms (messages were simplified for this post):
#        PID        TID        Message

[...]

31278    2300       7060       RequestXMLData entry

31281    2300       7060       RequestXMLData: XML error

[...]
Searching for issues having this error only pointed to a case with a mixed software product environment where some servers had the product version X and other servers the product version X+1. However, in the new case the customer claimed that he had only the product version X+1 on all production servers. We insisted and, after the closer inspection, servers with the product X were found…
- Dmitry Vostokov @ TraceAnalysis.org -
Posted in Debugging, Science of Software Tracing, Software Technical Support, Software Trace Analysis, Troubleshooting Methodology | No Comments »
Friday, October 16th, 2009
Memory Analysis and Debugging Institute (MA&DI), DA+TA Portal (DumpAnalysis.org + TraceAnalysis.org) and OpenTask establish
Software Maintenance Institute (SMI)
More details about R&D Institute of Software Maintenance will be announced soon.
- Dmitry Vostokov @ DumpAnalysis.org -
Posted in Announcements, Crash Dump Analysis, Debugging, Education and Research, Science of Memory Dump Analysis, Science of Software Tracing, Software Engineering, Software Maintenance Institute, Software Technical Support, Software Trace Analysis | 1 Comment »
Thursday, October 15th, 2009

Materials: A3 paper, a bug, hot chilli sauce
- Dmitry Vostokov @ DumpAnalysis.org -
Posted in Art, Crash Dump Analysis, Debugging, Fun with Crash Dumps, Physicalist Art, Software Technical Support, Software Trace Analysis | No Comments »
Tuesday, October 13th, 2009
Threads in my process run very fast. Not long ago the watch variable had the value 5 and now it is 6:
switch (years_at_citrix)

{

  case 5:

    write_blog_post(”I’ve just passed 5 year mark … “);

    wait_for_certificate();

    write_blog_post(”Shortly after celebrating 5 years … “);

    break;

  case 6:

    write_blog_post(”Threads in my process run very fast. Not long ago … “);

    break;

  case 7:

    // … TBD
}
- Dmitry Vostokov @ DumpAnalysis.org -
Posted in Announcements, Citrix, Crash Dump Analysis, Debugging, History, Software Engineering, Software Technical Support, Software Trace Analysis | 1 Comment »
Monday, October 12th, 2009
It was reported that one important system functionality is not available from time to time but is usually restored to normal operation when one service (ServiceA) is restarted. That service was coupled with ServiceB and their memory dumps were saved and delivered for analysis. Unfortunately, nothing raising a suspicion was found inside. To tackle the problem it was advised to get an ETW trace from the system including modules from ServiceA together with process memory dumps when the problem happens again. The trace revealed the following message with exceptionally high statement current of 72,118 msg/s (and also superdense - no other types of trace statements were found inside):
#      PID    TID    Message

[...]

823296 11300  2484   ServiceB notification failed, error code = 6

[…]
Where the error 6 is invalid handle error:
0:000> !error 6

Error code: (Win32) 0x6 (6) - The handle is invalid.
The thread 2484 (9B4) corresponds to thread #22 in ServiceA and it is blocked waiting for an LPC reply:
  22  Id: 2c24.9b4 Suspend: 1 Teb: 7ffa4000 Unfrozen

ChildEBP RetAddr

020cfa18 7c827899 ntdll!KiFastSystemCallRet

020cfa1c 77c80a6e ntdll!ZwRequestWaitReplyPort+0xc

020cfa68 77c7fcf0 rpcrt4!LRPC_CCALL::SendReceive+0×230

020cfa74 77c80673 rpcrt4!I_RpcSendReceive+0×24

020cfa88 77ce315a rpcrt4!NdrSendReceive+0×2b

020cfe70 73077ca5 rpcrt4!NdrClientCall2+0×22e

020cfe88 73077c2a ServiceA!RpcNextNotification+0×1c

020cffb8 77e6482f ServiceA!EventWatcherThread+0×107

020cffec 00000000 kernel32!BaseThreadStart+0×34
Suspicious of a loop we confirm that the thread was spiking:
0:000> !runaway f

 User Mode Time

  Thread       Time

  22:9b4       0 days 0:41:27.453

  19:4768      0 days 0:00:00.109

[…]

Kernel Mode Time

  Thread       Time

  22:9b4       0 days 0:24:27.984

  23:407c      0 days 0:00:00.437

[…]

 Elapsed Time

  Thread       Time

[…]

  22:9b4       0 days 5:26:21.499

[…]
Looking at the raw stack data (using !teb and dds WinDbg commands) we see a hidden processed exception:
020cf6c4  020cf4c0

020cf6c8  020cf6d8

020cf6cc  020cf718

020cf6d0  7c828290 ntdll!_except_handler3

020cf6d4  7c82a120 ntdll!CheckHeapFillPattern+0x54

020cf6d8  020cf6e8

020cf6dc  00140000

020cf6e0  7c82a144 ntdll!RtlpAllocateFromHeapLookaside+0x13

020cf6e4  00140868

020cf6e8  020cf910

020cf6ec  7c82a0d8 ntdll!RtlAllocateHeap+0x1dd

020cf6f0  7c82a11c ntdll!RtlAllocateHeap+0xee7

020cf6f4  73074548

020cf6f8  00000000

020cf6fc  00000000

020cf700  00000000

020cf704  00000000

020cf708  00218ef0

020cf70c  020cf728

020cf710  7c82a791 ntdll!RtlpCoalesceFreeBlocks+0x383

020cf714  020d0000

020cf718  00218ef0

020cf71c  020cf9fc

020cf720  7c82865c ntdll!RtlRaiseException+0×3d

020cf724  020ce000

020cf728  020cf72c

020cf72c  00010007

020cf730  020cf810

020cf734  7c829f5d ntdll!RtlFreeHeap+0×20e

020cf738  001407d8

020cf73c  7c829f79 ntdll!RtlFreeHeap+0×70f

020cf740  00000000
After some time another pair of coupled processes was collected where ServiceA(2) was hanging on an LPC request again but this time ServiceB(2) had one thread blocked by a GUI property sheet processing code (a variant of Message Box pattern):
0:015> kL 100

ChildEBP RetAddr

017fb9f0 7c827d29 ntdll!KiFastSystemCallRet

017fb9f4 77e61d1e ntdll!ZwWaitForSingleObject+0xc

017fba64 77e61c8d kernel32!WaitForSingleObjectEx+0xac

017fba78 6dfcdac3 kernel32!WaitForSingleObject+0x12

[...]

017fbdac 730801c5 compstui!CommonPropertySheetUIW+0×17

017fbdf4 73080f5d ServiceB!CommonPropertySheetUI+0×43

WARNING: Stack unwind information not available. Following frames may be wrong.

017fc27c 5c3ae4e6 ComponentA!DllGetClassObject+0xbf4e

[…]

017ff8f8 77ce33e1 rpcrt4!Invoke+0×30

017ffcf8 77ce35c4 rpcrt4!NdrStubCall2+0×299

017ffd14 77c7ff7a rpcrt4!NdrServerCall2+0×19

017ffd48 77c8042d rpcrt4!DispatchToStubInCNoAvrf+0×38

017ffd9c 77c80353 rpcrt4!RPC_INTERFACE::DispatchToStubWorker+0×11f

017ffdc0 77c811dc rpcrt4!RPC_INTERFACE::DispatchToStub+0xa3

017ffdfc 77c812f0 rpcrt4!LRPC_SCALL::DealWithRequestMessage+0×42c

017ffe20 77c88678 rpcrt4!LRPC_ADDRESS::DealWithLRPCRequest+0×127

017fff84 77c88792 rpcrt4!LRPC_ADDRESS::ReceiveLotsaCalls+0×430

017fff8c 77c8872d rpcrt4!RecvLotsaCallsWrapper+0xd

017fffac 77c7b110 rpcrt4!BaseCachedThreadRoutine+0×9d

017fffb8 77e6482f rpcrt4!ThreadStartRoutine+0×1b

017fffec 00000000 kernel32!BaseThreadStart+0×34
ComponentA was also found loaded in ServiceB(1) user dump and in the ServiceB memory dump from the initial coupled pair where nothing was found before. The timestamp of that component was old enough (lmv command) to warrant more attention to it and contact its ISV.
- Dmitry Vostokov @ DumpAnalysis.org -
Posted in Crash Dump Analysis, Crash Dump Patterns, Debugging, Software Trace Analysis, Trace Analysis Patterns | No Comments »
Friday, October 9th, 2009
This is the first case study here that shows an interplay of memory dump analysis (DA) and software trace analysis (TA) patterns, what I call DATA analysis patterns (or DA+TA).
It was reported that one process was blocking vital server functionality. After the process restart the problem was gone away. A complete memory dump was saved on the next occurrence and it revealed critical section wait chains in that process but no critical section deadlocks:
0: kd> .process /r /p 87f76020

Implicit process is now 87f76020

Loading User Symbols

[...]
0: kd> !cs -l -o -s

-----------------------------------------

DebugInfo          = 0x0016c6d8

Critical section   = 0×0032be30 (+0×32BE30)

LOCKED

LockCount          = 0×34

WaiterWoken        = No

OwningThread       = 0×00001c64

RecursionCount     = 0×1

LockSemaphore      = 0×624

SpinCount          = 0×00000000

OwningThread       = .thread 86396db0

ntdll!RtlpStackTraceDataBase is NULL. Probably the stack traces are not enabled.

[…]
The thread 86396db0 (TID 1c64) that blocked more than 50 threads (0×34) was blocked itself sleeping for more than 6 seconds:
0: kd> .thread 86396db0

Implicit thread is now 86396db0
0: kd> kL 100

  *** Stack trace for last set context - .thread/.cxr resets it

ChildEBP RetAddr

ae7f8c98 8083d5b1 nt!KiSwapContext+0x26

ae7f8cc4 8083cf69 nt!KiSwapThread+0x2e5

ae7f8d0c 8092b03f nt!KeDelayExecutionThread+0x2ab

ae7f8d54 80833bef nt!NtDelayExecution+0x84

ae7f8d54 7c82860c nt!KiFastCallEntry+0xfc

1020e8ac 7c826f69 ntdll!KiFastSystemCallRet

1020e8b0 77e41ed5 ntdll!NtDelayExecution+0xc

1020e918 77e424fd kernel32!SleepEx+0x68

1020e928 67739357 kernel32!Sleep+0xf

1020e944 6773c3a2 ComponentA!DB_Driver_Command+0xa7

[…]

1020ec64 67485393 ComponentB!DatabaseSearch+0×34

[…]

1020ffb8 77e6482f msvcrt!_endthreadex+0xa3

1020ffec 00000000 kernel32!BaseThreadStart+0×34
0: kd> kv

  *** Stack trace for last set context - .thread/.cxr resets it

ChildEBP RetAddr  Args to Child

[...]

1020e918 77e424fd 00001b00 00000000 1020e944 kernel32!SleepEx+0x68 (FPO: [SEH])

1020e928 67739357 00001b00 00000000 0032ac6c kernel32!Sleep+0xf (FPO: [1,0,0])

[…]
0: kd> ? 1b00 / 0n1000

Evaluate expression: 6 = 00000006
Critical section it owns shows high contention count too:
0: kd> dt -r1 _RTL_CRITICAL_SECTION   0x0032be30

ProcessA!_RTL_CRITICAL_SECTION

   +0x000 DebugInfo        : 0x0016c6d8 _RTL_CRITICAL_SECTION_DEBUG

      +0x000 Type             : 0

      +0x002 CreatorBackTraceIndex : 0

      +0x004 CriticalSection  : 0x0032be30 _RTL_CRITICAL_SECTION

      +0x008 ProcessLocksList : _LIST_ENTRY [ 0x16c708 - 0x16c6b8 ]

      +0x010 EntryCount       : 0

      +0×014 ContentionCount  : 0xac352

      +0×018 Spare            : [2] 0×43005c

   +0×004 LockCount        : -210

   +0×008 RecursionCount   : 1

   +0×00c OwningThread     : 0×00001c64

   +0×010 LockSemaphore    : 0×00000624

   +0×014 SpinCount        : 0
Fortunately, that process had ETW tracing capability and its software trace recorded before the complete memory dump was saved the following recurrent periodic errorfrom different threads that confirms our observation about the possible problem with a database and explains thread delays we see (> 6 seconds for Sleep):
#    PID  TID  Time         Message

[...]

1972 2780 5992 10:05:11.005 Error: [DB Driver] Not enough space on temp disk

1973 2780 5992 10:05:11.005 Execute DB command sleeps on error (retry 26)

[...]

4513 2780 3292 10:06:02.942 Error: [DB Driver] Not enough space on temp disk

4514 2780 3292 10:06:02.942 Execute DB command sleeps on error (retry 11)

4515 2780 3292 10:06:09.598 Error: [DB Driver] Not enough space on temp disk

4516 2780 3292 10:06:09.598 Execute DB command sleeps on error (retry 12)

[…]
- Dmitry Vostokov @ DumpAnalysis.org -
Posted in Announcements, Complete Memory Dump Analysis, Crash Dump Analysis, Crash Dump Patterns, Software Trace Analysis, Trace Analysis Patterns | No Comments »
Wednesday, October 7th, 2009
Software installation may fail: this is a fact (like Evolution). Therefore this is the domain of troubleshooting and debugging proper. Usually such problems are typically analyzed by reading Windows Installer MSI logs that are examples of software traces. The following book is on my desk now:
The Definitive Guide to Windows Installer

- Dmitry Vostokov @ DumpAnalysis.org -
Posted in Books, Debugging, Software Technical Support, Software Trace Analysis | No Comments »
Monday, September 28th, 2009
Every PID has its twitter account. Processes emit short trace messages (STM) and others subscribe to them. This is the technical support of the future, the concept of SoftWeet (*):
www.SoftWeet.com
(*) to weet
to know; to wit (archaic)
- Dmitry Vostokov @ DumpAnalysis.org -
Posted in Announcements, Debugged! MZ/PE, Debugging, Software Architecture, Software Engineering, Software Technical Support, Software Trace Analysis, Tools, Troubleshooting Methodology | 1 Comment »
Saturday, September 26th, 2009
This is a revised, edited, cross-referenced and thematically organized volume of selected DumpAnalysis.org blog posts about crash dump analysis and debugging written in October 2008 - June 2009 for software engineers developing and maintaining products on Windows platforms, quality assurance engineers testing software on Windows platforms and technical support and escalation engineers dealing with complex software issues. The third volume features:
- 15 new crash dump analysis patterns
- 29 new pattern interaction case studies
- Trace analysis patterns
- Updated checklist
- Fully cross-referenced with Volume 1 and Volume 2
- New appendixes
Product information:
- Title: Memory Dump Analysis Anthology, Volume 3
- Author: Dmitry Vostokov
- Language: English
- Product Dimensions: 22.86 x 15.24
- Paperback: 404 pages
- Publisher: Opentask (20 December 2009)
- ISBN-13: 978-1-906717-43-8
- Hardcover: 404 pages
- Publisher: Opentask (30 January 2010)
- ISBN-13: 978-1-906717-44-5

Back cover features 3D computer memory visualization image.
- Dmitry Vostokov @ DumpAnalysis.org -
Posted in Announcements, AntiPatterns, Art, Assembly Language, Books, C and C++, CDF Analysis Tips and Tricks, Certification, Citrix, Code Reading, Common Mistakes, Computational Ghosts and Bug Hauntings, Computer Science, Countefactual Debugging, Crash Dump Analysis, Crash Dump Patterns, Crash Dumps for Dummies, DebugWare Patterns, Debugging, Debugging Slang, Deep Down C++, Education and Research, Escalation Engineering, Fun with Crash Dumps, Futuristic Memory Dump Analysis, Games for Debugging, Hardware, Horrors of Computation, Hyper-V, Intelligent Memory Movement, Kernel Development, Mathematics of Debugging, Memiotics (Memory Semiotics), Memoidealism, Memoretics, Memory Analysis Culture, Memory Analysis Forensics and Intelligence, Memory Dreams, Memory Dump Analysis Jobs, Memory Space Music, Memory Visualization, Memuonics, Minidump Analysis, Multithreading, Music for Debugging, New Acronyms, New Words, Occult Debugging, Philosophy, Poetry, Psi-computation, Publishing, Science of Memory Dump Analysis, Science of Software Tracing, Security, Software Architecture, Software Defect Construction, Software Engineering, Software Generalist, Software Narratology, Software Technical Support, Software Trace Analysis, Software Tracing for Dummies, Testing, Tools, Trace Analysis Patterns, Training and Seminars, Troubleshooting Methodology, Virtualization, Vista, Visual Dump Analysis, WinDbg Scripts, WinDbg Tips and Tricks, WinDbg for GDB Users, Windows 7, Windows Server 2008, Windows System Administration | No Comments »
Saturday, September 26th, 2009
DumpAnalysis.org accepts hardware such as laptops for reviewing in relation to their suitability for extreme debugging, virtualization, trace analysis, computer forensics, memory dump analysis, visualization and auralization. If you work for a H/W company like HP, Apple, Dell, Acer, Sony or any other respectable manufacturer please don’t hesitate to forward this post to your management: it could be your company brand or laptop model that debugging and software technical support community chooses next time of upgrade or for T&D / R&D! H/W reviews will be posted on the main portal page which currently has an audience of more than 200,000 unique visitors per year from more than 30,000 network locations (*).
If your company is interested please don’t hesitate to use this contact form:
http://www.dumpanalysis.org/contact
(*) From Google Analytics report.
- Dmitry Vostokov @ DumpAnalysis.org -
Posted in Announcements, Crash Dump Analysis, Debugging, Hardware, Memory Analysis Forensics and Intelligence, Memory Auralization, Memory Visualization, Security, Software Engineering, Software Technical Support, Software Trace Analysis, Testing, Tools, Virtualization, Vista, Visual Dump Analysis, Windows 7, Windows Server 2008, Windows System Administration | No Comments »
Tuesday, September 22nd, 2009
Citrix released the powerful GUI CDF trace analyzer tool that can work with hundred Mb trace files with millions of trace messages:
http://support.citrix.com/article/CTX122741
I use it on day-to-day basis while analyzing CDF traces from terminal services environments and highly recommend. Its ability to quick filter out modules is indispensable when dealing with messages from hundreds of processes and thousands of threads. I haven’t tried it yet with MS TMF files though.
- Dmitry Vostokov @ DumpAnalysis.org -
Posted in Announcements, CDF Analysis Tips and Tricks, Citrix, Debugging, Software Technical Support, Software Trace Analysis, Tools, Trace Analysis Patterns | 1 Comment »
Thursday, September 10th, 2009
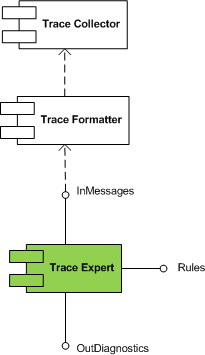
Trace Expert pattern came to my mind when I was writing about software trace patterns. It is a very lightweight expert system relying on trace collector and trace formatter (patterns to be written about soon). It is a module that takes a preformatted software trace message file or a buffer and a set of built in rules and uses simple search (peharps involving regular expressions) to dig out diagnostic information and provide troubleshooting and debugging directions.
This module is schematically depicted on the following UML component diagram:
- Dmitry Vostokov @ DumpAnalysis.org -
Posted in DebugWare Patterns, Debugging, Software Architecture, Software Technical Support, Software Trace Analysis, Tools, Trace Analysis Patterns, Troubleshooting Methodology | No Comments »
Tuesday, September 8th, 2009
Responding to numerous requests and suggestions I plan to make magazine interior excluding promotional vouchers available for free download. If someone needs covers including back covers where I put tips and tables to be used as posters or certification vouchers printed inside then they should buy the magazine from Amazon or other bookshops.
This initiative will be accompanied by a smart marketing trick that I plan to unveil in a few days together with the magazine website.
- Dmitry Vostokov @ DumpAnalysis.org -
Posted in Announcements, Books, Crash Dump Analysis, Debugged! MZ/PE, Debugging, Education and Research, Publishing, Security, Software Engineering, Software Technical Support, Software Trace Analysis, Testing, Tools, Training and Seminars | 1 Comment »