Archive for the ‘Software Technical Support’ Category
Thursday, June 16th, 2011
To generate crash dumps for my recent presentation The Old New Crash: Cloud Memory Dump Analysis I created the tool similar to TestWER. It is a .NET worker service role for Windows Azure that does a NULL pointer assignment. Here is a source code from WorkerRole.cs (I left EnableCollection twice just in case :-)):
using System;

using System.Collections.Generic;

using System.Diagnostics;

using System.Linq;

using System.Net;

using System.Threading;

using Microsoft.WindowsAzure;

using Microsoft.WindowsAzure.Diagnostics;

using Microsoft.WindowsAzure.ServiceRuntime;

using Microsoft.WindowsAzure.StorageClient;

using Microsoft.WindowsAzure.Diagnostics.Management;
namespace TestWAERWorker

{

public class WorkerRole : RoleEntryPoint

{

public override void Run()

{

Trace.WriteLine("TestWAERWorker entry point called", "Information");
Thread.Sleep(60000);
            unsafe

{

int* p = null;

*p = 1;

};
            while (true)

{

Thread.Sleep(10000);

Trace.WriteLine("Working", "Information");

}

}
        public override bool OnStart()

{

// Set the maximum number of concurrent connections

ServicePointManager.DefaultConnectionLimit = 12;
CrashDumps.EnableCollection(true);
            DiagnosticMonitorConfiguration config = DiagnosticMonitor.GetDefaultInitialConfiguration();

string conn_str = RoleEnvironment.GetConfigurationSettingValue("Microsoft.WindowsAzure.Plugins. Diagnostics.ConnectionString");

CloudStorageAccount account = CloudStorageAccount.Parse(conn_str);

config.Directories.ScheduledTransferPeriod = TimeSpan.FromMinutes(1);

DiagnosticMonitor diagnosticMonitor = DiagnosticMonitor.Start(account, config);
CrashDumps.EnableCollection(true);
            return base.OnStart();

}

}

}
The following forum discussion really helped me to get things right: http://stackoverflow.com/questions/5727692/azure-crash-dumps-not-appearing. So I’d like to thank Oliver Bock here.
If you want to deploy it to Windows Azure then don’t forget to add your storage account name and its key in the service configuration file. For your development environment you will need to replace the whole value with “UseDevelopmentStorage=true”. The full case study with detailed steps is forthcoming.
You can download the package from here: TestWAER.zip
- Dmitry Vostokov @ DumpAnalysis.org + TraceAnalysis.org -
Posted in .NET Debugging, Announcements, Cloud Memory Dump Analysis, Crash Dump Analysis, Debugging, Memory Dump Analysis Services, Presentations, Software Technical Support, Tools, Webinars, Windows Azure | No Comments »
Sunday, May 15th, 2011
Presentation Software Trace and Memory Dump Analysis: Patterns, Tools, Processes and Best Practices from E2E Virtualization Conference (13th of May, 2011) is available for download:
http://www.dumpanalysis.com/STMDA-materials
- Dmitry Vostokov @ DumpAnalysis.org + TraceAnalysis.org -
Posted in Announcements, Debugging, Debugging Methodology, Escalation Engineering, Presentations, Root Cause Analysis, Software Behavior Patterns, Software Technical Support, Software Trace Analysis, Software Trace Reading, Tools, Trace Analysis Patterns, Training and Seminars, Troubleshooting Methodology | No Comments »
Sunday, May 8th, 2011
Learn how to analyze application, service and system crashes and freezes, navigate through memory dump space and diagnose heap corruption, memory leaks, CPU spikes, blocked threads, deadlocks, wait chains, and much more. We use a unique and innovative pattern-driven analysis approach to speed up the learning curve.

Memory Dump Analysis Services organizes a training course.
If you are registered you are allowed to optionally submit your memory dumps before the training. This will allow us in addition to the carefully constructed problems tailor extra examples to the needs of the attendees. All registrants will receive an optional pre-test before the first session and an optional test after each session.
The training consists of 2 four-hour sessions (4 hours on the first day and 4 hours on the next day). When you finish the training you additionally get:
- A full transcript in PDF format (retail price $200)
- 5 volumes of Memory Dump Analysis Anthology in PDF format (retail price $100)
- An attendance certificate (PDF format)
Prerequisites: Basic Windows troubleshooting
Session 1: August 1, 2011 2:00 PM - 6:00 PM BST
Session 2: August 2, 2011 2:00 PM - 6:00 PM BST
Price: 210 USD
Space is limited.
Reserve your remote training seat now.
- Dmitry Vostokov @ DumpAnalysis.org + TraceAnalysis.org -
Posted in Announcements, Crash Dump Analysis, Crash Dump Patterns, Memory Dump Analysis Services, Software Technical Support, Testing, Tools, Training and Seminars, Vista, WinDbg Tips and Tricks, Windows 7, Windows Server 2008, Windows System Administration, x64 Windows | No Comments »
Friday, April 22nd, 2011
Very simple methodology summarized in just 3 words applicable to any problem solving domain and its activities including software troubleshooting and debugging:
Artifacts. Checklists. Patterns.
As an example of checklists and patterns please see these 3 presentations related to memory dump and software trace artifacts:
Introduction to Pattern-Driven Software Problem Solving
Fundamentals of Complete Crash and Hang Memory Dump Analysis
Pattern-Driven Memory Dump Analysis
I’m now working on a detailed presentation of this methodology.
- Dmitry Vostokov @ DumpAnalysis.org + TraceAnalysis.org -
Posted in Announcements, Debugging, Debugging Methodology, Escalation Engineering, New Acronyms, Root Cause Analysis, Software Technical Support, Troubleshooting Methodology | No Comments »
Thursday, April 21st, 2011
Imagine a pattern-driven crash analysis report (car) when you need it: at the very moment of a crash, just in time! And the car drives you to a problem resolution. Imagine also a periodic pattern-driven just-in-time memory space analysis (JIT MSA) that provides you instant intelligent reports on what’s going on inside memory while your application, service or system is running! This is a forthcoming optional client side part of CARE (Crash Analysis Report Environment) which is being developed by Memory Dump Analysis Services engineering team under the leadership of Alexey Golikov. Combined with generative debugging techniques both client and server parts form a complete unique enterprise crash and hang analysis solution suitable for development and production environments. Stay tuned for further exciting updates.
PS. The car drives on a road to the first fault software problem solving.
- Dmitry Vostokov @ DumpAnalysis.org + TraceAnalysis.org -
Posted in Crash Analysis Report Environment (CARE), Crash Dump Analysis, Debugging, Debugging Methodology, Escalation Engineering, First Fault Problem Solving, Generative Debugging, JIT Crash Analysis, JIT Memory Space Analysis, Memory Analysis Forensics and Intelligence, Memory Dump Analysis Services, Pattern Prediction, Software Behavior Patterns, Software Engineering, Software Technical Support, Testing, Tools, Windows System Administration | No Comments »
Sunday, April 17th, 2011
I’m pleased to announce that MDAA, Volume 5 is available in PDF format:
www.dumpanalysis.org/Memory+Dump+Analysis+Anthology+Volume+5
It features:
- 25 new crash dump analysis patterns
- 11 new pattern interaction case studies (including software tracing)
- 16 new trace analysis patterns
- 7 structural memory patterns
- 4 modeling case studies for memory dump analysis patterns
- Discussion of 3 common analysis mistakes
- Malware analysis case study
- Computer independent architecture of crash analysis report service
- Expanded coverage of software narratology
- Metaphysical and theological implications of memory dump worldview
- More pictures of memory space and physicalist art
- Classification of memory visualization tools
- Memory visualization case studies
- Close reading of the stories of Sherlock Holmes: Dr. Watson’s observational patterns
- Fully cross-referenced with Volume 1, Volume 2, Volume 3, and Volume 4
Its table of contents is available here:
www.dumpanalysis.org/MDAA/MDA-Anthology-V5-TOC.pdf
Paperback and hardcover versions should be available in a week or two. I also started working on Volume 6 that should be available in November-December.
- Dmitry Vostokov @ DumpAnalysis.org + TraceAnalysis.org -
Posted in Aesthetics of Memory Dumps, Analysis Notation, Announcements, AntiPatterns, Archaeology of Computer Memory, Art, Assembly Language, Best Practices, Books, C and C++, CDF Analysis Tips and Tricks, Categorical Debugging, Citrix, Common Mistakes, Common Questions, Complete Memory Dump Analysis, Computer Forensics, Computer Science, Crash Analysis Report Environment (CARE), Crash Dump Analysis, Crash Dump De-analysis, Crash Dump Patterns, Crash Dumps for Dummies, Cyber Warfare, Debugging, Debugging Bureau, Debugging Industry, Debugging Methodology, Debugging Slang, Debugging Trends, Deep Down C++, Dr. Watson, Dublin School of Security, Education and Research, Escalation Engineering, Fun with Crash Dumps, Fun with Debugging, Fun with Software Traces, General Memory Analysis, Hermeneutics of Memory Dumps and Traces, Images of Computer Memory, Kernel Development, Malware Analysis, Mathematics of Debugging, Memiotics (Memory Semiotics), Memory Analysis Forensics and Intelligence, Memory Diagrams, Memory Dump Analysis Services, Memory Dumps in Myths, Memory Space Art, Memory Systems Language, Memory Visualization, Memory and Glitches, Metaphysics of Memory Worldview, Multithreading, Music for Debugging, New Acronyms, New Debugging School, New Words, Pattern Models, Philosophy, Physicalist Art, Publishing, Reverse Engineering, Science of Memory Dump Analysis, Science of Software Tracing, Security, Software Architecture, Software Behavior Patterns, Software Chorography, Software Chorology, Software Defect Construction, Software Engineering, Software Generalist, Software Maintenance Institute, Software Narratology, Software Technical Support, Software Trace Analysis, Software Trace Reading, Software Trace Visualization, Software Tracing for Dummies, Software Troubleshooting Patterns, Software Victimology, Structural Memory Patterns, Structural Trace Patterns, Systems Thinking, Testing, The Way of Philip Marlowe, Tools, Trace Analysis Patterns, Training and Seminars, Troubleshooting Methodology, Victimware, Vista, Webinars, WinDbg Scripting Extensions, WinDbg Scripts, WinDbg Tips and Tricks, WinDbg for GDB Users, Windows 7, Windows Server 2008, Windows System Administration, Workaround Patterns, x64 Windows | No Comments »
Tuesday, April 12th, 2011
I’m to present pattern-driven software trace analysis with examples from application and desktop delivery environments featuring Memory Dump Analysis Services at the forthcoming E2E Virtualization Conference (PubForum) in Dublin on 13th of May, 2011. Topics include a case study covering simultaneous analysis of software traces and memory dumps.

- Dmitry Vostokov @ DumpAnalysis.org + TraceAnalysis.org -
Posted in Announcements, CDF Analysis Tips and Tricks, Crash Dump Analysis, Crash Dump Patterns, Debugging, Presentations, Software Technical Support, Software Trace Analysis, Software Trace Reading, Tools, Trace Analysis Patterns | 1 Comment »
Tuesday, April 5th, 2011
Finally, after the numerous delays, the first Windows Debugging Notebook is almost ready for publication by the end of this month with a new cover and a foreword written by Mario Hewardt, the author of Advanced Windows Debugging and Advanced .NET Debugging books:
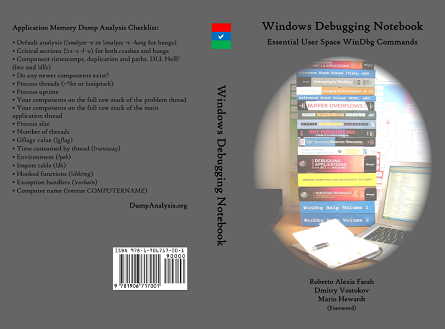
It is the first notebook because we have decided to split it into 3 different memory space volumes and one additional overview volume for concepts and tools:
- Windows Debugging Notebook: Essential User Space WinDbg Commands (ISBN: 978-1906717001 and 978-0955832857)
- Windows Debugging Notebook: Essential Kernel Space WinDbg Commands (ISBN: 978-1908043146)
- Windows Debugging Notebook: Essential Managed Space WinDbg .NET Commands (ISBN: 978-1908043153)
- Windows Debugging Notebook: Essential Concepts and Tools (ISBN: 978-1908043160)
On a bookshelf you would be able to distinguish between the first 3 volumes by a 3 color spine stripe with an appropriate check on it: red for kernel, blue for user, and green for managed space.
The Table of Contents has been changed too.
- Dmitry Vostokov @ DumpAnalysis.org + TraceAnalysis.org -
Posted in Announcements, Assembly Language, Books, Crash Dump Analysis, Debugging, Escalation Engineering, Publishing, Reverse Engineering, Security, Software Engineering, Software Technical Support, WinDbg Scripts, WinDbg Tips and Tricks | 2 Comments »
Saturday, March 26th, 2011
The presentation materials from the webinar (25th of March, 2011) are available for download:
http://www.dumpanalysis.com/PDSPSI-materials
Thanks to everyone who registered and attended!
- Dmitry Vostokov @ DumpAnalysis.org + TraceAnalysis.org -
Posted in Announcements, Crash Dump Analysis, Crash Dump Patterns, DebugWare Patterns, Debugging, Debugging Methodology, Escalation Engineering, Mac Crash Corner, Malware Analysis, Malware Patterns, Memory Analysis Forensics and Intelligence, Software Architecture, Software Behavior Patterns, Software Engineering, Software Technical Support, Software Trace Analysis, Software Tracing Implementation Patterns, Software Troubleshooting Patterns, Structural Memory Patterns, Structural Trace Patterns, Tools, Trace Analysis Patterns, Training and Seminars, Troubleshooting Methodology, Unified Debugging Patterns, Webinars, Workaround Patterns | No Comments »
Monday, March 14th, 2011
“… he who has not been in” support “does not know what” debugging “is.”
Attributed to Leo Tolstoy, by Adam Ulam, The Bolsheviks
- Dmitry Vostokov @ DumpAnalysis.org + TraceAnalysis.org -
Posted in Bugtations, Crash Dump Analysis, Debugging, Escalation Engineering, Fun with Crash Dumps, Fun with Debugging, Fun with Software Traces, Software Engineering, Software Technical Support, Software Trace Analysis | No Comments »
Thursday, March 10th, 2011
Because the number of software trace patterns is growing I’m starting another checklist in addition to memory dump analysis checklist. The goal is to help experienced engineers not to miss any important information. The checklist doesn’t prescribe any specific steps, just lists all possible points to double check when looking at a software trace. Of course, it is not complete at the moment and any suggestions are welcome. This post will be modified on the ongoing basis.
General:
• Check overall trace time delta
• Check no trace metafile message density
• Check whether a trace is a multi-part or a circular
• Check for basic facts and the story (software narrative)
• Check for any exceptions, non-false positive errors and periodic errors
• Check for significant events
• Check for discontinuities in the time domain
• Check for message current and acceleration in the frequency domain
- Dmitry Vostokov @ DumpAnalysis.org + TraceAnalysis.org -
Posted in CDF Analysis Tips and Tricks, Debugging, Debugging Methodology, Escalation Engineering, Software Technical Support, Software Trace Analysis, Software Trace Reading, Trace Analysis Patterns, Troubleshooting Methodology | No Comments »
Monday, March 7th, 2011

The first Webinar to start an in-depth discussion of pattern-driven software troubleshooting, debugging and maintenance:
Date: 25th of March 2011
Time: 18:30 (GMT) 14:30 (EST) 11:30 (PST)
Duration: 60 minutes
Space is limited.
Reserve your Webinar seat now at:
https://www3.gotomeeting.com/register/448268158
Topics include:
- A Short History of DumpAnalysis.org
- Memory Dump Analysis Patterns
- Troubleshooting and Debugging Tools (Debugware) Patterns
- Software Trace Analysis Patterns
- From Software Defects to Software Behavior
- Workaround Patterns
- Structural Memory Patterns
- Memory Analysis Domain Pattern Hierarchy
- New Directions
Prerequisites: experience in software troubleshooting and/or debugging.
- Dmitry Vostokov @ DumpAnalysis.org + TraceAnalysis.org -
Posted in .NET Debugging, Analysis Notation, Announcements, AntiPatterns, Best Practices, CDA Pattern Classification, Crash Dump Analysis, Crash Dump Patterns, DebugWare Patterns, Debugging, Debugging Methodology, Debugging Trends, Escalation Engineering, Java Debugging, Linux Crash Corner, Mac Crash Corner, Malware Analysis, Malware Patterns, Memory Analysis Forensics and Intelligence, Memory Dump Analysis Services, Pattern Models, Pattern Prediction, Presentations, Software Behavior Patterns, Software Chorology, Software Engineering, Software Narratology, Software Technical Support, Software Trace Analysis, Software Trace Reading, Software Tracing Implementation Patterns, Software Troubleshooting Patterns, Structural Memory Patterns, Structural Trace Patterns, Systems Thinking, Testing, Trace Analysis Patterns, Training and Seminars, Troubleshooting Methodology, Unified Debugging Patterns, Webinars, Workaround Patterns | No Comments »
Thursday, February 24th, 2011
Learning from Philip Marlowe, a detective:
“I like you,” she said suddenly. “You believe in miracles.”
Raymond Chandler, The Big Sleep
Do you believe in miracles from a driver modifying an arbitrary user space? Or in a miracle of suddenly disappearing software incidents?
- Dmitry Vostokov @ DumpAnalysis.org + TraceAnalysis.org -
Posted in Bugtations, Debugging, Escalation Engineering, Fun with Debugging, Kernel Development, Software Technical Support, The Way of Philip Marlowe | 1 Comment »
Thursday, February 3rd, 2011
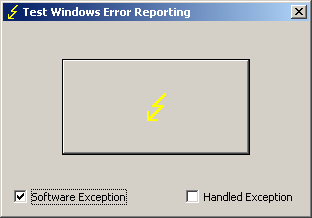
TestDefaultDebugger has been updated to version 2.0 with the following new features:
- Renamed to TestWER to reflect the shift from default debuggers to WER and LocalDumps (W2K8, Vista and Windows 7)
- The ability to generate software exceptions (by default TestWER generates hardware NULL pointer access violation exception)
- An option to handle generated exceptions (hardware and software) to test such scenarios
- Symbol PDB files are included in the package
Here’s an example stack trace when we select a software exception option and push the big button:
0:000> !analyze -v
[...]
EXCEPTION_RECORD:  0012f4a4 -- (.exr 0x12f4a4)

ExceptionAddress: 7742fbae (kernel32!RaiseException+0x00000058)

   ExceptionCode: e06d7363 (C++ EH exception)

  ExceptionFlags: 00000001

NumberParameters: 3

   Parameter[0]: 19930520

   Parameter[1]: 0012f83c

   Parameter[2]: 00428ef8

  pExceptionObject: 0012f83c

  _s_ThrowInfo    : 00428ef8

  Type            : int
[...]
0:000> k

ChildEBP RetAddr

0012edb4 775c5610 ntdll!KiFastSystemCallRet

0012edb8 7743a5d7 ntdll!NtWaitForMultipleObjects+0xc

0012ee54 7743a6f0 kernel32!WaitForMultipleObjectsEx+0x11d

0012ee70 774ae2a5 kernel32!WaitForMultipleObjects+0x18

0012eedc 774ae4d1 kernel32!WerpReportFaultInternal+0x16d

0012eef0 7748ff4d kernel32!WerpReportFault+0x70

0012ef7c 004187ee kernel32!UnhandledExceptionFilter+0x1b5

0012f2b4 004161e8 TestWER!abort+0x10f

0012f2e4 004130cb TestWER!terminate+0x33

0012f2ec 7748febe TestWER!__CxxUnhandledExceptionFilter+0x3c

0012f374 775d7fc1 kernel32!UnhandledExceptionFilter+0x127

0012f37c 77569bdc ntdll!__RtlUserThreadStart+0x6f

0012f390 77564067 ntdll!_EH4_CallFilterFunc+0x12

0012f3b8 775c5f79 ntdll!_except_handler4+0x8e

0012f3dc 775c5f4b ntdll!ExecuteHandler2+0x26

0012f48c 775c5dd7 ntdll!ExecuteHandler+0x24

0012f48c 7742fbae ntdll!KiUserExceptionDispatcher+0xf

0012f7e0 00412ac2 kernel32!RaiseException+0×58

0012f818 0041ff1f TestWER!_CxxThrowException+0×48

0012f85c 00403620 TestWER!CTestDefaultDebuggerDlg::OnBnClickedButton1+0xaf

0012f86c 0040382f TestWER!_AfxDispatchCmdMsg+0×45

0012f89c 00402df6 TestWER!CCmdTarget::OnCmdMsg+0×11c

0012f8c0 00409ef8 TestWER!CDialog::OnCmdMsg+0×1d

0012f910 0040a792 TestWER!CWnd::OnCommand+0×92

0012f9ac 00406dea TestWER!CWnd::OnWndMsg+0×36

0012f9cc 00409713 TestWER!CWnd::WindowProc+0×24

0012fa34 004097a2 TestWER!AfxCallWndProc+0×9a

0012fa54 7716fd72 TestWER!AfxWndProc+0×36

0012fa80 7716fe4a user32!InternalCallWinProc+0×23

0012faf8 77170943 user32!UserCallWinProcCheckWow+0×14b

0012fb38 77170b36 user32!SendMessageWorker+0×4b7

0012fb58 747eb4ba user32!SendMessageW+0×7c

0012fb78 747eb51c comctl32!Button_NotifyParent+0×3d

0012fb94 747eb627 comctl32!Button_ReleaseCapture+0×112

0012fbf4 7716fd72 comctl32!Button_WndProc+0xa98

0012fc20 7716fe4a user32!InternalCallWinProc+0×23

0012fc98 7717018d user32!UserCallWinProcCheckWow+0×14b

0012fcfc 7717022b user32!DispatchMessageWorker+0×322

0012fd0c 771651f5 user32!DispatchMessageW+0xf

0012fd30 0040618c user32!IsDialogMessageW+0×586

0012fd44 004071e2 TestWER!CWnd::IsDialogMessageW+0×32

0012fd50 00402dd3 TestWER!CWnd::PreTranslateInput+0×2d

0012fd64 00408dc1 TestWER!CDialog::PreTranslateMessage+0×9a

0012fd78 00403f35 TestWER!CWnd::WalkPreTranslateTree+0×23

0012fd90 00404090 TestWER!AfxInternalPreTranslateMessage+0×41

0012fd9c 00403f80 TestWER!CWinThread::PreTranslateMessage+0xd

0012fda8 004040dd TestWER!AfxPreTranslateMessage+0×19

0012fdb8 00408598 TestWER!AfxInternalPumpMessage+0×2d

0012fde0 00403440 TestWER!CWnd::RunModalLoop+0xc5

0012fe2c 004204ee TestWER!CDialog::DoModal+0×12d

0012fee4 0041fdf5 TestWER!CTestDefaultDebuggerApp::InitInstance+0xce

0012fef8 0040fc3e TestWER!AfxWinMain+0×48

0012ff88 7743d0e9 TestWER!__tmainCRTStartup+0×112

0012ff94 775a19bb kernel32!BaseThreadInitThunk+0xe

0012ffd4 775a198e ntdll!__RtlUserThreadStart+0×23

0012ffec 00000000 ntdll!_RtlUserThreadStart+0×1b
Here’s WinDbg output when we choose to handle exceptions:
0:001> g

(628.a90): Access violation - code c0000005 (first chance)

First chance exceptions are reported before any exception handling.

This exception may be expected and handled.

TestWER64!CTestDefaultDebuggerDlg::OnBnClickedButton1+0×44:

00000001`40024774 c704250000000000000000 mov dword ptr [0],0 ds:00000000`00000000=????????
0:000> g

(628.a90): C++ EH exception - code e06d7363 (first chance)
You can download TestWER package from Citrix support web site:
Download TestWER 2.0
- Dmitry Vostokov @ DumpAnalysis.org + TraceAnalysis.org -
Posted in Announcements, Citrix, Crash Dump Analysis, Debugging, Software Technical Support, Tools, Vista, Windows 7, Windows Server 2008 | No Comments »
Saturday, January 29th, 2011
Our sponsor, Memory Dump Analysis Services has published common questions and answers regarding their operation and competitive advantage over traditional software support organizations:
http://www.dumpanalysis.com/common-qa
I like their bold statement that they don’t have any competitors because they are one step further by providing an audit. This reminds me the statement I learnt from school: Marxism is all powerful because it is true.
- Dmitry Vostokov @ DumpAnalysis.org + TraceAnalysis.org -
Posted in Announcements, Crash Dump Analysis, Debugging, Memory Dump Analysis Services, Software Technical Support | No Comments »
Monday, January 3rd, 2011
Resolution rush - The rush of software technical support and maintenance engineers to provide the resolution to a suddenly escalated incident.
Examples: After it crashed 3 times in a row at the customer site our VP was called and we all got the resolution rush.
- Dmitry Vostokov @ DumpAnalysis.org + TraceAnalysis.org -
Posted in Crash Dump Analysis, Debugging, Debugging Slang, Escalation Engineering, Fun with Crash Dumps, Fun with Debugging, Fun with Software Traces, Software Engineering, Software Technical Support, Software Trace Analysis | No Comments »
Sunday, January 2nd, 2011
Working for more than 7 years in technical support environment I found that many support incidents were resolved more easily by abductive reasoning than by induction and deduction practiced by Sherlock Holmes and observed by Dr. Watson. Abduction as a way to build an incident theory to advance in problem resolution was practiced by a USA colleague of Holmes: Philip Marlowe. Because technical support is less detached from customers (”the world”) when compared to software engineering departments I see the way of Marlowe as more natural. Of course, from time to time the way of Holmes is also appropriate. All depends on a support case. I found that abductive reasoning is also appropriate for memory dump and software trace analysis where “leaps of faith” are necessary because of insufficient information. Such leaps of abduction actually happen all the time when analysts give troubleshooting advice based on patterns.
I plan to write more about the 3rd way of reasoning after I finish reading two Raymond Chandler’s novels and a few other inference, causality and explanation books I mention later: The Big Sleep & Farewell, My Lovely (Modern Library) .
.

I’m grateful for Clive Gamble for pointing this way out in his book Archaeology: The Basics

- Dmitry Vostokov @ DumpAnalysis.org + TraceAnalysis.org -
Posted in Archaeology of Computer Memory, Books, Crash Dump Analysis, Debugging, Debugging Methodology, Dr. Watson, Escalation Engineering, Logic, New Debugging School, Software Technical Support, Software Trace Analysis, The Way of Philip Marlowe, Troubleshooting Methodology | No Comments »
Sunday, January 2nd, 2011
Similar to Blocking Module pattern we also have Top Module pattern where the difference is in stack trace syntax only. A top module is any module we choose that is simply on top of a stack trace. Most of the time it is likely to be a non-OS vendor module. Whether the stack trace is well-formed and semantically sound or incorrect is irrelevant:
0:005> kL

ChildEBP RetAddr

01abc4d8 6efba23d ntdll!KiFastSystemCallRet

WARNING: Stack unwind information not available. Following frames may be wrong.

01abc988 7c820833 ModuleB+0×2a23d

01abcbe4 7c8207f6 kernel32!GetVolumeNameForRoot+0×26

01abcc0c 7c82e6de kernel32!BasepGetVolumeNameForVolumeMountPoint+0×75

01abcc54 6efaf70b kernel32!GetVolumePathNameW+0×18a

01abccdc 6efbd1a6 ModuleB+0×1f70b

01abcce0 00000000 ModuleB+0×2d1a6
Here we can also check the validity of ModuleB code by backwards disassembly of 6efba23d return address (ub command) unless we have an abridged dump file (minidump) and we need to specify the image file path in WinDbg,
Why a top module is important? In various troubleshooting scenarious we can check the module timestamp (Not My Version pattern) and other useful information (lmv and !lmi WinDbg commands). If we suspect the module belonging to hooksware we can also recommend removing it or its software vendor package for testing purposes.
- Dmitry Vostokov @ DumpAnalysis.org + TraceAnalysis.org -
Posted in Crash Dump Analysis, Crash Dump Patterns, Debugging, Minidump Analysis, Software Technical Support, Testing, Troubleshooting Methodology | No Comments »
Wednesday, December 29th, 2010
In these post series we are going to discuss the best practices for software tracing implementation including appropriate patterns and their links to software trace analysis patterns. The first one is called Period Timestamp where the start and the end time (and the date if necessary) are recorded in the trace file. This helps in Inter-Correlation and News Value analysis between several different trace types. For example, in one scenario, we had WindowHistory and MessageHistory logs. We identified a problem in the former log as happening at this time:
Handle: 00010196 Class: "ClassA" Title: "TitleA"

   Captured at: 13:36:30:533

[…]
However, when we looked at the latter trace to search for specific window messages posted or sent before that time we saw that the recording started later than the former event:
Start time: 13:36:35:830
Period timestamps are necessary to distinguish Incomplete History from Truncated Trace where in the former case the absence of expected trace message is due to some problem.
From a unified debugging patterns perspective we have this sequence fragment:
Implementation Patterns: Period Timestamp
Usage Patterns: Trace Simultaneously
- Dmitry Vostokov @ DumpAnalysis.org + TraceAnalysis.org -
Posted in Best Practices, Debugging, Debugging Methodology, Software Architecture, Software Engineering, Software Narratology, Software Technical Support, Software Trace Analysis, Software Trace Reading, Software Tracing Implementation Patterns, Trace Analysis Patterns, Troubleshooting Methodology, Unified Debugging Patterns | No Comments »
 Group")