Archive for the ‘Memory Analysis Forensics and Intelligence’ Category
Sunday, September 26th, 2010
The next pattern is called Aggregate Snapshot. It is any memory dump or software trace file that is combined from Memory Snapshots. Typical examples include:
- A minidump file where only specific memory ranges are included
- A software trace file combined from structured memory snapshots
Note. I’ve also created a dedicated page to list all structural patterns:
Structural Memory Analysis Patterns
- Dmitry Vostokov @ DumpAnalysis.org + TraceAnalysis.org -
Posted in Crash Dump Analysis, Debugging, Memoretics, Memory Analysis Forensics and Intelligence, Structural Memory Patterns | 1 Comment »
Friday, September 24th, 2010
Now it’s time to divide memory analysis patterns discerned so far as mostly abnormal software behavior memory dump and software trace patterns into behavioral and structural catalogues. The goal is to account for normal system-independent structural entities and relationships visible in memory like modules, threads, processes and so on.
The first pattern (and also a super-pattern) we discuss in this part is called Memory Snapshot. It is further subdivided into Structured Memory Snapshot and BLOB Memory Snapshot. Structured sub-pattern includes:
- Contiguous memory dump files with artificially generated headers (for example, physical or process virtual space memory dump)
- Software trace messages with imposed internal structure
BLOB sub-pattern variety includes address range snapshots without any externally imposed structure, for example, saved by .writemem WinDbg command or ReadProcessMemory API and contiguous buffer and raw memory dumps saved by various memory acquisition tools.
Behavioral patterns that relate to Memory Snapshot pattern are:
I strive initially to publish at least one such pattern every day to fill the gap of normal patterns in memory analysis and later add more multi-platform details and examples from other platforms like Linux, Mac OS X, embedded and selected important historical architectures.
- Dmitry Vostokov @ DumpAnalysis.org + TraceAnalysis.org -
Posted in Crash Dump Analysis, Crash Dump Patterns, Debugging, General Memory Analysis, Memiotics (Memory Semiotics), Memoretics, Memory Analysis Forensics and Intelligence, Memory Systems Language, Science of Memory Dump Analysis, Science of Software Tracing, Security, Software Behavior Patterns, Software Trace Analysis, Structural Memory Patterns | 1 Comment »
Sunday, July 11th, 2010
Our future sponsor has been registered in Ireland and has its own independent website and logo: DumpAnalysis.com

More information will be available later this month.
- Dmitry Vostokov @ DumpAnalysis.org + TraceAnalysis.org -
Posted in Announcements, Crash Analysis Report Environment (CARE), Crash Dump Analysis, Crash Dump De-analysis, Debugging, Education and Research, Escalation Engineering, Hardware, Kernel Development, Linux Crash Corner, Mac Crash Corner, Memory Analysis Forensics and Intelligence, Memory Dump Analysis Services, Minidump Analysis, Security, Software Engineering, Software Technical Support, Software Trace Analysis, Testing, Tools, Training and Seminars, Vista, Windows 7, Windows Server 2008, Windows System Administration, x64 Windows | No Comments »
Friday, May 7th, 2010
This is a variation of Hooked Functions pattern for kernel space. In addition to trampoline patching we also see a modified service table:
0: kd> !chkimg -lo 50 -d !nt -v

Searching for module with expression: !nt

Will apply relocation fixups to file used for comparison

Will ignore NOP/LOCK errors

Will ignore patched instructions

Image specific ignores will be applied

Comparison image path: c:\mss\ntkrnlmp.exe\4B7A8E62280000\ntkrnlmp.exe

No range specified
Scanning section:    .text

Size: 625257

Range to scan: 80801000-80899a69

    808373e3-808373e9  7 bytes - nt!KeAcquireQueuedSpinLockAtDpcLevel+1b

 [ f7 41 04 01 00 00 00:e9 00 0d b2 76 cc cc ]

    8083e6c8-8083e6cb  4 bytes - nt!KiServiceTable+440 (+0×72e5)

 [ 98 4e 98 80:d0 66 e9 f4 ]

    80840605-8084060a  6 bytes - nt!KxFlushEntireTb+9 (+0×1f3d)

 [ ff 15 1c 10 80 80:e9 a5 7a b1 76 cc ]

Total bytes compared: 625257(100%)

Number of errors: 17
Scanning section: MISYSPTE

Size: 1906

Range to scan: 8089a000-8089a772

Total bytes compared: 1906(100%)

Number of errors: 0
Scanning section:   POOLMI

Size: 7868

Range to scan: 8089b000-8089cebc

Total bytes compared: 7868(100%)

Number of errors: 0
Scanning section: POOLCODE

Size: 7754

Range to scan: 8089d000-8089ee4a

Total bytes compared: 7754(100%)

Number of errors: 0
Scanning section:     PAGE

Size: 1097281

Range to scan: 808bc000-809c7e41

Total bytes compared: 1097281(100%)

Number of errors: 0
Scanning section:   PAGELK

Size: 63633

Range to scan: 809c8000-809d7891

Total bytes compared: 63633(100%)

Number of errors: 0
Scanning section:  PAGEWMI

Size: 7095

Range to scan: 809ef000-809f0bb7

Total bytes compared: 7095(100%)

Number of errors: 0
Scanning section:   PAGEKD

Size: 16760

Range to scan: 809f1000-809f5178

Total bytes compared: 16760(100%)

Number of errors: 0
Scanning section: PAGEHDLS

Size: 7508

Range to scan: 809f7000-809f8d54

Total bytes compared: 7508(100%)

Number of errors: 0

17 errors : !nt (808373e3-8084060a)
0: kd> dds 8083e6c8

8083e6c8  f4e966d0 DriverA+0×20d8

8083e6cc  80983436 nt!NtUnloadKey2

8083e6d0  809837b5 nt!NtUnloadKeyEx

8083e6d4  8091cec8 nt!NtUnlockFile

8083e6d8  80805d80 nt!NtUnlockVirtualMemory

8083e6dc  80937630 nt!NtUnmapViewOfSection

8083e6e0  808e7154 nt!NtVdmControl

8083e6e4  809c6ba3 nt!NtWaitForDebugEvent

8083e6e8  8092dc24 nt!NtWaitForMultipleObjects

8083e6ec  8092ccf4 nt!NtWaitForSingleObject

8083e6f0  809c132f nt!NtWaitHighEventPair

8083e6f4  809c12c3 nt!NtWaitLowEventPair

8083e6f8  80925c8d nt!NtWriteFile

8083e6fc  80901790 nt!NtWriteFileGather

8083e700  8091214c nt!NtWriteRequestData

8083e704  8093e63b nt!NtWriteVirtualMemory

8083e708  80822751 nt!NtYieldExecution

8083e70c  808c7c46 nt!NtCreateKeyedEvent

8083e710  8093eee3 nt!NtOpenKeyedEvent

8083e714  809c1ee8 nt!NtReleaseKeyedEvent

8083e718  809c2183 nt!NtWaitForKeyedEvent

8083e71c  809a610b nt!NtQueryPortInformationProcess

8083e720  809a6123 nt!NtGetCurrentProcessorNumber

8083e724  809a1849 nt!NtWaitForMultipleObjects32

8083e728  90909090

8083e72c  1c0d3b90

8083e730  0f8089f1

8083e734  037aaa85

8083e738  00c1f700

8083e73c  0fffff00

8083e740  037a9e85

8083e744  9090c300
0: kd> u 808373e3

nt!KeAcquireQueuedSpinLockAtDpcLevel+0×1b:

808373e3 jmp     DriverB+0×10e8 (f73580e8)

808373e8 int     3

808373e9 int     3

808373ea je      nt!KeAcquireQueuedSpinLockAtDpcLevel+0×12 (808373da)

808373ec pause

808373ee jmp     nt!KeAcquireQueuedSpinLockAtDpcLevel+0×1b (808373e3)

nt!KeReleaseInStackQueuedSpinLockFromDpcLevel:

808373f0 lea     ecx,[ecx]

nt!KeReleaseQueuedSpinLockFromDpcLevel:

808373f2 mov     eax,ecx
0: kd> u 80840605

nt!KxFlushEntireTb+0×9:

80840605 jmp     DriverB+0×10af (f73580af)

8084060a int     3

8084060b mov     byte ptr [ebp-1],al

8084060e mov     ebx,offset nt!KiTbFlushTimeStamp (808a7100)

80840613 mov     ecx,dword ptr [nt!KiTbFlushTimeStamp (808a7100)]

80840619 test    cl,1

8084061c jne     nt!KxFlushEntireTb+0×19 (8082cd8d)

80840622 mov     eax,ecx
- Dmitry Vostokov @ DumpAnalysis.org + TraceAnalysis.org -
Posted in Crash Dump Analysis, Crash Dump Patterns, Debugging, Memory Analysis Forensics and Intelligence, Security | 3 Comments »
Thursday, April 22nd, 2010
I’ve decided to adapt archaeological classificatory framework (using my favourite method of inquiry: metaphorical bijectionism) to lay out foundations for yet another attempt to classify DA+TA patterns):
Attribute  ↔ Pattern

Artefact   ↔ Component Artefact1

Assemblage ↔ Component Assemblage

Culture    ↔ Memory System Culture
2

1 Can be either a component-generated artefact or a component like a module or symbol file
2 Typical examples of memory system cultures are Windows, UNIX or even “Multiplatform”
I propose a word Memoarchaeological for such a framework and Memoarchaeology for a branch of Memoretics that studies saved computer memory artifacts from past computations (as opposed to live memory).
Note: In one of the forthcoming issues of Debugged! MZ/PE magazine there will be presented yet another classificatory scheme.
- Dmitry Vostokov @ DumpAnalysis.org + TraceAnalysis.org -
Posted in Announcements, Archaeology of Computer Memory, CDA Pattern Classification, Crash Dump Analysis, Crash Dump Patterns, Debugging, Memoretics, Memory Analysis Forensics and Intelligence, New Words, Science of Memory Dump Analysis, Science of Software Tracing, Software Behavior Patterns, Software Trace Analysis, Trace Analysis Patterns | No Comments »
Sunday, April 18th, 2010
OpenTask to offer first 3 volumes of Memory Dump Analysis Anthology in one set:


The set is available exclusively from OpenTask e-Commerce web site starting from June. Individual volumes are also available from Amazon, Barnes & Noble and other bookstores worldwide.
Product information:
- Title: Modern Memory Dump and Software Trace Analysis: Volumes 1-3
- Author: Dmitry Vostokov
- Language: English
- Product Dimensions: 22.86 x 15.24
- Paperback: 1600 pages
- Publisher: Opentask (31 May 2010)
- ISBN-13: 978-1-906717-99-5
Information about individual volumes:
- Dmitry Vostokov @ DumpAnalysis.org + TraceAnalysis.org -
Posted in .NET Debugging, Aesthetics of Memory Dumps, Announcements, AntiPatterns, Art, Assembly Language, Books, Bugchecks Depicted, C and C++, CDA Pattern Classification, CDF Analysis Tips and Tricks, Categorical Debugging, Certification, Citrix, Code Reading, Common Mistakes, Computational Ghosts and Bug Hauntings, Computer Science, Countefactual Debugging, Crash Analysis Report Environment (CARE), Crash Dump Analysis, Crash Dump Patterns, Crash Dumps for Dummies, Data Recovery, DebugWare Patterns, Debugging, Debugging Methodology, Debugging Slang, Deep Down C++, Dictionary of Debugging, Dr. Watson, Education and Research, Escalation Engineering, Fun with Crash Dumps, Futuristic Memory Dump Analysis, GDB for WinDbg Users, Hardware, History, Horrors of Computation, Hyper-V, Intelligent Memory Movement, Kernel Development, Laws of Troubleshooting and Debugging, Mathematics of Debugging, Memiotics (Memory Semiotics), Memoidealism, Memoretics, Memory Analysis Culture, Memory Analysis Forensics and Intelligence, Memory Auralization, Memory Dump Analysis Jobs, Memory Religion (Memorianity), Memory Space Art, Memory Space Music, Memory Systems Language, Memory Visualization, Memuonics, Minidump Analysis, Multithreading, Music for Debugging, Music of Computation, New Acronyms, New Words, Occult Debugging, Philosophy, Psi-computation, Publishing, Science of Memory Dump Analysis, Science of Software Tracing, Security, Software Architecture, Software Defect Construction, Software Engineering, Software Generalist, Software Maintenance Institute, Software Narratology, Software Technical Support, Software Trace Analysis, Software Trace Visualization, Software Tracing for Dummies, Software Victimology, Stack Trace Collection, Testing, Tools, Trace Analysis Patterns, Training and Seminars, Troubleshooting Methodology, Victimware, Virtualization, Vista, Visual Dump Analysis, WinDbg Scripts, WinDbg Tips and Tricks, WinDbg for GDB Users, Windows 7, Windows Server 2008, Windows System Administration | No Comments »
Friday, April 9th, 2010
Plan to start providing training and seminars in my free time. If you are interested please answer these questions (you can either respond here in comments or use this form for private communication http://www.dumpanalysis.org/contact):
- Are you interested in on-site training, prefer traveling or attending webinars?
- Are you interested in software trace analysis as well?
- What specific topics are you interested in?
- What training level (beginner, intermediate, advanced) are you interested in? (please provide an example, if possible)
Additional topics of expertise that can be integrated into training include Source Code Reading and Analysis, Debugging, Windows Architecture, Device Drivers, Troubleshooting Tools Design and Implementation, Multithreading, Deep Down C and C++, x86 and x64 Assembly Language Reading.
Looking forward to your responses. Any suggestions are welcome.
- Dmitry Vostokov @ DumpAnalysis.org + TraceAnalysis.org -
Posted in .NET Debugging, Announcements, AntiPatterns, Assembly Language, Bugchecks Depicted, C and C++, CDA Pattern Classification, CDF Analysis Tips and Tricks, Certification, Code Reading, Common Mistakes, Crash Analysis Report Environment (CARE), Crash Dump Analysis, Crash Dump Patterns, Crash Dumps for Dummies, Data Recovery, DebugWare Patterns, Debugging, Debugging Methodology, Deep Down C++, Education and Research, Escalation Engineering, FreeBSD Crash Corner, GDB for WinDbg Users, Hardware, Hyper-V, Java Debugging, Kernel Development, Laws of Troubleshooting and Debugging, Linux Crash Corner, Mac Crash Corner, Memory Analysis Forensics and Intelligence, Memory Visualization, Minidump Analysis, Multithreading, Security, Software Architecture, Software Defect Construction, Software Engineering, Software Generalist, Software Maintenance Institute, Software Narratology, Software Technical Support, Software Trace Analysis, Software Trace Visualization, Software Tracing for Dummies, Software Victimology, Stack Trace Collection, Testing, Tools, Trace Analysis Patterns, Training and Seminars, Troubleshooting Methodology, Victimware, Virtualization, Vista, Visual Dump Analysis, WinDbg Scripts, WinDbg Tips and Tricks, WinDbg for GDB Users, Windows 7, Windows Server 2008, Windows System Administration, Workaround Patterns | No Comments »
Thursday, February 11th, 2010
This is a revised, edited, cross-referenced and thematically organized volume of selected DumpAnalysis.org blog posts about crash dump analysis and debugging written in July 2009 - January 2010 for software engineers developing and maintaining products on Windows platforms, quality assurance engineers testing software on Windows platforms and technical support and escalation engineers dealing with complex software issues. The fourth volume features:
- 13 new crash dump analysis patterns
- 13 new pattern interaction case studies
- 10 new trace analysis patterns
- 6 new Debugware patterns and case study
- Workaround patterns
- Updated checklist
- Fully cross-referenced with Volume 1, Volume 2 and Volume 3
- New appendixes
Product information:
- Title: Memory Dump Analysis Anthology, Volume 4
- Author: Dmitry Vostokov
- Language: English
- Product Dimensions: 22.86 x 15.24
- Paperback: 410 pages
- Publisher: Opentask (30 March 2010)
- ISBN-13: 978-1-906717-86-5
- Hardcover: 410 pages
- Publisher: Opentask (30 April 2010)
- ISBN-13: 978-1-906717-87-2

Back cover features memory space art image: Internal Process Combustion.
- Dmitry Vostokov @ DumpAnalysis.org + TraceAnalysis.org -
Posted in .NET Debugging, Aesthetics of Memory Dumps, Announcements, AntiPatterns, Art, Assembly Language, Books, C and C++, CDA Pattern Classification, CDF Analysis Tips and Tricks, Categorical Debugging, Certification, Citrix, Code Reading, Common Mistakes, Computer Science, Countefactual Debugging, Crash Analysis Report Environment (CARE), Crash Dump Analysis, Crash Dump Patterns, Crash Dumps for Dummies, DebugWare Patterns, Debugging, Debugging Slang, Education and Research, Escalation Engineering, Fun with Crash Dumps, Games for Debugging, Hardware, Horrors of Computation, Hyper-V, Kernel Development, Laws of Troubleshooting and Debugging, Mathematics of Debugging, Memiotics (Memory Semiotics), Memoidealism, Memoretics, Memory Analysis Culture, Memory Analysis Forensics and Intelligence, Memory Dreams, Memory Dump Analysis Jobs, Memory Dumps in Movies, Memory Space Art, Memory Visualization, Memuonics, Minidump Analysis, Multithreading, Music for Debugging, New Acronyms, New Words, Opcodism, Philosophy, Physicalist Art, Publishing, Science Fiction, Science of Memory Dump Analysis, Science of Software Tracing, Security, Software Architecture, Software Defect Construction, Software Engineering, Software Generalist, Software Maintenance Institute, Software Narratology, Software Technical Support, Software Trace Analysis, Software Trace Visualization, Software Tracing for Dummies, Software Victimology, Stack Trace Collection, Testing, Tools, Trace Analysis Patterns, Training and Seminars, Troubleshooting Methodology, Victimware, Virtualization, Vista, Visual Dump Analysis, WinDbg Scripts, WinDbg Tips and Tricks, WinDbg for GDB Users, Windows 7, Windows Server 2008, Windows System Administration, Workaround Patterns | No Comments »
Sunday, December 20th, 2009
“Memory dumps are facts.”
I’m very excited to announce that Volume 3 is available in paperback, hardcover and digital editions:
Memory Dump Analysis Anthology, Volume 3
Table of Contents
In two weeks paperback edition should also appear on Amazon and other bookstores. Amazon hardcover edition is planned to be available in January 2010.
The amount of information was so voluminous that I had to split the originally planned volume into two. Volume 4 should appear by the middle of February together with Color Supplement for Volumes 1-4.
- Dmitry Vostokov @ DumpAnalysis.org -
Posted in .NET Debugging, Aesthetics of Memory Dumps, Announcements, AntiPatterns, Art, Assembly Language, Books, Bugtations, C and C++, CDA Pattern Classification, CDF Analysis Tips and Tricks, Certification, Citrix, Code Reading, Common Mistakes, Computer Science, Crash Dump Analysis, Crash Dump Patterns, Crash Dumps for Dummies, DebugWare Patterns, Debugging, Debugging Slang, Deep Down C++, Education and Research, Escalation Engineering, Fun with Crash Dumps, Hardware, Horrors of Computation, Kernel Development, Mathematics of Debugging, Memiotics (Memory Semiotics), Memoidealism, Memoretics, Memory Analysis Culture, Memory Analysis Forensics and Intelligence, Memory Space Art, Memory Visualization, Minidump Analysis, Multithreading, Philosophy, Poetry, Publishing, Science of Memory Dump Analysis, Science of Software Tracing, Security, Software Architecture, Software Defect Construction, Software Engineering, Software Narratology, Software Technical Support, Software Trace Analysis, Software Trace Visualization, Software Tracing for Dummies, Software Victimology, Stack Trace Collection, Testing, Tools, Trace Analysis Patterns, Training and Seminars, Troubleshooting Methodology, Victimware, Virtualization, Vista, Visual Dump Analysis, WinDbg Scripts, WinDbg Tips and Tricks, WinDbg for GDB Users, Windows 7, Windows Server 2008, Windows System Administration | 1 Comment »
Thursday, December 17th, 2009
Previously announced Software Maintenance Institute was finally registered in Ireland (Reg. No. 400906) and its certificate was received yesterday.
Here is the current component structure of various institutions (depicted in UML):
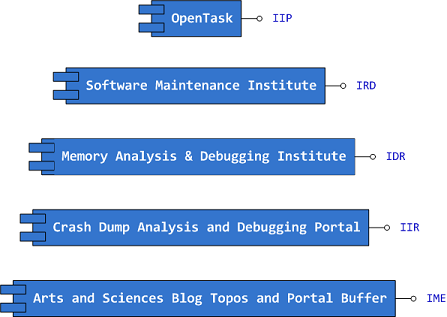
Interface Tags:
IIP Interface of Iterative Publishing

IRD Interface of Research and Development

IDR Interface of Defect Research

IIR Interface of Information Repository

IME Interface of Memetic Engineering
- Dmitry Vostokov @ DumpAnalysis.org -
Posted in Announcements, Art, Certification, Computer Science, Crash Dump Analysis, Debugging, Education and Research, Escalation Engineering, History, Memiotics (Memory Semiotics), Memoidealism, Memoretics, Memory Analysis Culture, Memory Analysis Forensics and Intelligence, Memory Auralization, Memory Visualization, Philosophy, Publishing, Science of Memory Dump Analysis, Science of Software Tracing, Security, Software Architecture, Software Engineering, Software Maintenance Institute, Software Technical Support, Software Trace Analysis, Software Victimology, Testing, Training and Seminars | No Comments »
Friday, October 23rd, 2009
What prompted me to found this discipline (that is supposed to be a sister discipline of software criminology, software security, secure code construction and software defect construction) is understanding that some software components are innocent victims of other component coding mistakes or deliberate subversion and some start as a part of crimeware but eventually become victims themselves (they crash, hang, spike, leak, are dumped, subverted, etc.). I would also like to borrow and reuse the neglected term victimware here in a broad sense. More on this later as I have to switch to software trace analysis patterns.
- Dmitry Vostokov @ DumpAnalysis.org -
Posted in Code Reading, Crash Dump Analysis, Debugging, Memory Analysis Forensics and Intelligence, Security, Software Defect Construction, Software Engineering, Software Trace Analysis, Software Victimology, Victimware | 1 Comment »
Saturday, September 26th, 2009
This is a revised, edited, cross-referenced and thematically organized volume of selected DumpAnalysis.org blog posts about crash dump analysis and debugging written in October 2008 - June 2009 for software engineers developing and maintaining products on Windows platforms, quality assurance engineers testing software on Windows platforms and technical support and escalation engineers dealing with complex software issues. The third volume features:
- 15 new crash dump analysis patterns
- 29 new pattern interaction case studies
- Trace analysis patterns
- Updated checklist
- Fully cross-referenced with Volume 1 and Volume 2
- New appendixes
Product information:
- Title: Memory Dump Analysis Anthology, Volume 3
- Author: Dmitry Vostokov
- Language: English
- Product Dimensions: 22.86 x 15.24
- Paperback: 404 pages
- Publisher: Opentask (20 December 2009)
- ISBN-13: 978-1-906717-43-8
- Hardcover: 404 pages
- Publisher: Opentask (30 January 2010)
- ISBN-13: 978-1-906717-44-5

Back cover features 3D computer memory visualization image.
- Dmitry Vostokov @ DumpAnalysis.org -
Posted in Announcements, AntiPatterns, Art, Assembly Language, Books, C and C++, CDF Analysis Tips and Tricks, Certification, Citrix, Code Reading, Common Mistakes, Computational Ghosts and Bug Hauntings, Computer Science, Countefactual Debugging, Crash Dump Analysis, Crash Dump Patterns, Crash Dumps for Dummies, DebugWare Patterns, Debugging, Debugging Slang, Deep Down C++, Education and Research, Escalation Engineering, Fun with Crash Dumps, Futuristic Memory Dump Analysis, Games for Debugging, Hardware, Horrors of Computation, Hyper-V, Intelligent Memory Movement, Kernel Development, Mathematics of Debugging, Memiotics (Memory Semiotics), Memoidealism, Memoretics, Memory Analysis Culture, Memory Analysis Forensics and Intelligence, Memory Dreams, Memory Dump Analysis Jobs, Memory Space Music, Memory Visualization, Memuonics, Minidump Analysis, Multithreading, Music for Debugging, New Acronyms, New Words, Occult Debugging, Philosophy, Poetry, Psi-computation, Publishing, Science of Memory Dump Analysis, Science of Software Tracing, Security, Software Architecture, Software Defect Construction, Software Engineering, Software Generalist, Software Narratology, Software Technical Support, Software Trace Analysis, Software Tracing for Dummies, Testing, Tools, Trace Analysis Patterns, Training and Seminars, Troubleshooting Methodology, Virtualization, Vista, Visual Dump Analysis, WinDbg Scripts, WinDbg Tips and Tricks, WinDbg for GDB Users, Windows 7, Windows Server 2008, Windows System Administration | No Comments »
Saturday, September 26th, 2009
DumpAnalysis.org accepts hardware such as laptops for reviewing in relation to their suitability for extreme debugging, virtualization, trace analysis, computer forensics, memory dump analysis, visualization and auralization. If you work for a H/W company like HP, Apple, Dell, Acer, Sony or any other respectable manufacturer please don’t hesitate to forward this post to your management: it could be your company brand or laptop model that debugging and software technical support community chooses next time of upgrade or for T&D / R&D! H/W reviews will be posted on the main portal page which currently has an audience of more than 200,000 unique visitors per year from more than 30,000 network locations (*).
If your company is interested please don’t hesitate to use this contact form:
http://www.dumpanalysis.org/contact
(*) From Google Analytics report.
- Dmitry Vostokov @ DumpAnalysis.org -
Posted in Announcements, Crash Dump Analysis, Debugging, Hardware, Memory Analysis Forensics and Intelligence, Memory Auralization, Memory Visualization, Security, Software Engineering, Software Technical Support, Software Trace Analysis, Testing, Tools, Virtualization, Vista, Visual Dump Analysis, Windows 7, Windows Server 2008, Windows System Administration | No Comments »
Tuesday, September 15th, 2009
SecretSES (Secret Software Engineering Society) announces Debugging Spy Network of Memory Analysis Forensics and Intelligence Agents (MAFIA).
Motivation: seeing various nomadic and settled debugging teams I finally decided to unfold my own net.
- Dmitry Vostokov @ DumpAnalysis.org -
Posted in Announcements, Crash Dump Analysis, Debugging, Fun with Crash Dumps, Memory Analysis Forensics and Intelligence, New Acronyms | No Comments »
Monday, June 22nd, 2009
Looking at pattern cooperation studies it is easy to see that some patterns precede others, for example, heap corruption might be blocked by a hard error or a message box and therefore block other threads, creating conditions for another pattern to appear, wait chains. Blocked threads may block other coupled processes creating inter-process wait chains. Successive patterns reach the climax at the end and the system is no longer able to generate any other patterns.
The goal here is to find patterns that most likely happen in succession and another pattern series that are less likely to effect other abnormal conditions. Such pattern sequences can help in troubleshooting and finding root causes.
- Dmitry Vostokov @ DumpAnalysis.org -
Posted in Crash Dump Analysis, Crash Dump Patterns, Debugging, Memory Analysis Forensics and Intelligence | 3 Comments »
Monday, May 25th, 2009
Found today this book while browsing Amazon:
The Rootkit Arsenal: Escape and Evasion in the Dark Corners of the System

Intrigued, I searched for its table of contents and found the author’s site:
Book TOC
Looks enough comprehensive so I pre-ordered the book and plan to write a review later from windows internals and memory dump analysis perspective.
- Dmitry Vostokov @ DumpAnalysis.org -
Posted in Assembly Language, Books, Crash Dump Analysis, Memory Analysis Forensics and Intelligence, Security, Software Architecture | No Comments »
Thursday, May 14th, 2009
Part 2 briefly discussed debuggers and their commands. Debugger commands can be grouped together into scripts that can be run against memory dump files and their resulted textual output can be redirected to log files.
Therefore we start with the first step in our analysis process diagram introduced in Part 1:
Information Collection: Scripts
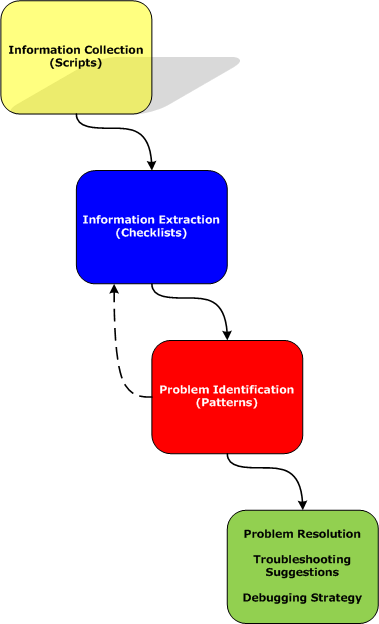
Here a script is a sequence of instructions to extract formatted textual information from a memory dump file (or a live system). There are many advantages of scripts and logs. Many companies, for example, banks, avoid sending plain memory dump files because of security considerations in order to prevent exposure of company or private information. After the advent of 64-bit personal computing complete memory dump files became larger and larger and it is now common to get 32Gb memory dumps. Processing multiple long-running commands can easily be done from textual log files. Additionally, scripts can be used to process hundreds of memory dumps in one go to look for similarities and differences. Many tools can be used for such purpose including built-in debugger scripting capabilities, shell scripting and regular expressions for intelligent search.
- Dmitry Vostokov @ DumpAnalysis.org -
Posted in Citrix, Crash Dump Analysis, Crash Dump Patterns, Debugging, Debugging Methodology, Memory Analysis Forensics and Intelligence, Security, Software Technical Support, Troubleshooting Methodology, WinDbg Scripts | No Comments »
Tuesday, April 21st, 2009
Before we explain stages of the analysis process shown in Part 1, let’s start with a brief overview of memory dumps, debuggers and logs. Recall that a memory dump is a snapshot of a process, system or physical memory state. This unifies post-mortem analysis and live debugging. Debuggers are tools that allow us to get and modify these memory snapshots. Other tools that allow us to get memory dump files are process dumpers like userdump.exe, Task Manager since Vista, WER, and system dumpers like LiveKd and Win32dd. We should not forget tools and methods that allow us to trigger Windows kernel ability to save consistent memory dump files: NMI button, keyboard method and various software bugcheck-triggers like Citrix SystemDump. Now coming back to debuggers. One of their essential features is to save a debugging session log, formatted textual output saved in a text file for further processing. One good example is !process 0 ff WinDbg command to output all processes and their thread stack traces (see Stack Trace Collection pattern for other variations).
I’ve created a page to add all P-DMA parts as soon as I write them:
Pattern-Driven Memory Analysis
- Dmitry Vostokov @ DumpAnalysis.org -
Posted in Citrix, Crash Dump Analysis, Crash Dump Patterns, Debugging, Debugging Methodology, Memory Analysis Forensics and Intelligence, Security, Software Technical Support, Troubleshooting Methodology, WinDbg Scripts | 1 Comment »
Sunday, March 29th, 2009
Finally it has been published and available for orders from Amazon and other bookstores:
http://www.dumpanalysis.org/Debugged+Magazine
I had to increase the number of pages for the first issue from 16, planned originally, to 28 and this is reflected in the retail price of $10 (originally planned $8) but bookstores should sell it with a discount between 0% and 55%.
More information about the next issue should be ready by the end of the next week.
- Dmitry Vostokov @ DumpAnalysis.org -
Posted in Announcements, Crash Dump Analysis, Crash Dump Patterns, Debugged! MZ/PE, Debugging, History, Memory Analysis Forensics and Intelligence, Publishing, Security, Software Technical Support, Testing, Tools, Training and Seminars, Troubleshooting Methodology, WinDbg Scripts, WinDbg Tips and Tricks | No Comments »
Sunday, March 29th, 2009
Previously announced Memory Analysis and Debugging Institute was registered in the Republic of Ireland (No. 382026) last week.
- Dmitry Vostokov @ DumpAnalysis.org -
Posted in Announcements, Crash Dump Analysis, Debugging, Education and Research, History, Memory Analysis Forensics and Intelligence, Memory Visualization, Philosophy, Riemann Programming Language, Science of Memory Dump Analysis, Security, Software Technical Support, Testing, Training and Seminars | No Comments »