Archive for the ‘Memory Analysis Forensics and Intelligence’ Category
Saturday, January 1st, 2011
With the new year starts the new initiative to integrate traditional multidisciplinary debugging approaches and methodologies with multiplatform pattern-driven software problem solving, unified debugging patterns, best practices in memory dump analysis and software tracing, computer security, economics, and the new emerging trends I’m going to write about during this year.
- Dmitry Vostokov @ DumpAnalysis.org + TraceAnalysis.org -
Posted in Announcements, Best Practices, Computer Forensics, Computer Science, Countefactual Debugging, Crash Analysis Report Environment (CARE), Crash Dump Analysis, Crash Dump Patterns, DebugWare Patterns, Debugging, Debugging Industry, Debugging Methodology, Debugging Trends, Dublin School of Security, Economics, Education and Research, Escalation Engineering, First Fault Problem Solving, Malware Analysis, Malware Patterns, Mathematics of Debugging, Memiotics (Memory Semiotics), Memoretics, Memory Analysis Forensics and Intelligence, Memory Analysis Report System, Memory Dump Analysis Services, Memory Systems Language, Memory Visualization, New Debugging School, Science of Memory Dump Analysis, Science of Software Tracing, Security, Software Behavior Patterns, Software Defect Construction, Software Engineering, Software Generalist, Software Maintenance Institute, Software Narratology, Software Trace Analysis, Software Trace Visualization, Software Tracing Implementation Patterns, Software Troubleshooting Patterns, Structural Memory Patterns, Structural Trace Patterns, Systems Thinking, Testing, Tool Objects, Tools, Trace Analysis Patterns, Training and Seminars, Troubleshooting Methodology, Unified Debugging Patterns, Victimware, Visual Dump Analysis, Webinars, Workaround Patterns | No Comments »
Friday, December 31st, 2010
Similar to Google GMMXIe depiction and interpretation I propose another one related to memory centuries that start from 1000 CE (M…):
MMXI
Malware Memory eXception and Injection
or
Monitoring Memory, eXceptions, and Injections
- Dmitry Vostokov @ DumpAnalysis.org + TraceAnalysis.org -
Posted in Fun with Malware, Memory Analysis Forensics and Intelligence, New Acronyms | No Comments »
Monday, December 27th, 2010
Paraphrasing the title of Philip K. Dick’s novel Do Androids Dream of Electric Sheep? I’d like to tell the dream I had a few nights ago after starting my work on a computational security novel Session Zero (ISBN: 978-1908043092). I was in the hall of a building where Russian and American spies frequently intersect. Apparently, I was a technician there and everyone passing by was complaining about difficulties being a spy. I was listening and telling everyone that I wasn’t a spy, just a technician. Suddenly a thought came to my mind that if I were a real spy masquerading as a technician it would have made make a good novel plot… Then I met colleagues from one of my previous companies and I woke up.
- Dmitry Vostokov @ DumpAnalysis.org + TraceAnalysis.org -
Posted in Memory Analysis Forensics and Intelligence, Memory Dreams, Security | No Comments »
Saturday, December 25th, 2010
As a part of my efforts to unify malware and forensic analysis with memory dump and software trace analysis from behavioral and structural patterns perspective I created this domain name. The word victimware was borrowed and extended from its previous limited use:
Software Victimology (Part 1)
Software Victimology (Part 2)
- Dmitry Vostokov @ DumpAnalysis.org + TraceAnalysis.org -
Posted in Announcements, Computer Forensics, Malware Analysis, Memory Analysis Forensics and Intelligence, Victimware | No Comments »
Friday, December 17th, 2010
As the new decade is approaching (2011-2020) we would like to make a few previews and predictions:
- Increased complexity of software will bring more methods from biological, social sciences and humanities in addition to existing methods of automated debugging and computer science techniques
- Focus on first fault software problem solving (when aspect)
- Focus on pattern-driven software problem solving (how aspect)
- Fusion of debugging and malware analysis into a unified structural and behavioral pattern framework
- Visual debugging, memory and software trace visualization techniques
- Software maintenance certification
- Focus on domain-driven troubleshooting and debugging tools as a service (debugware TaaS)
- Focus on security issues related to memory dumps and software traces
- New scripting languages and programming language extensions for debugging
- The maturation of the science of memory snapshots and software traces (memoretics)
Imagining is not not limited to the above and more to come and explain in the forthcoming parts.
- Dmitry Vostokov @ DumpAnalysis.org + TraceAnalysis.org -
Posted in Announcements, Anthropology, Archaeology of Computer Memory, Biology, Certification, Computer Science, Countefactual Debugging, Crash Analysis Report Environment (CARE), Crash Dump Analysis, Crash Dump Patterns, DebugWare Patterns, Debugging, Debugging Industry, Debugging Methodology, Debugging Trends, Dublin School of Security, EasyDbg, Economics, Escalation Engineering, Evolution, First Fault Problem Solving, Futuristic Memory Dump Analysis, General Memory Analysis, General Science, Geography, Hardware, Hermeneutics of Memory Dumps and Traces, History, Humanities, Language, Laws of Troubleshooting and Debugging, Logic, Malware Analysis, Malware Patterns, Mathematics of Debugging, Memiotics (Memory Semiotics), Memoretics, Memory Analysis Forensics and Intelligence, Memory Analysis Report System, Memory Dump Analysis and History, Memory Systems Language, Memory Visualization, Paleo-debugging, Pattern Models, Pattern Prediction, Physics, Psychology, Publishing, Science of Memory Dump Analysis, Science of Software Tracing, Security, Social Media, Social Sciences, Software Architecture, Software Behavior Patterns, Software Chorography, Software Chorology, Software Defect Construction, Software Engineering, Software Generalist, Software Maintenance Institute, Software Narrative Fiction, Software Narratology, Software Technical Support, Software Trace Analysis, Software Trace Analysis and History, Software Trace Deconstruction, Software Trace Linguistics, Software Trace Visualization, Software Troubleshooting Patterns, Software Victimology, Statistics, Structural Memory Analysis and Social Sciences, Structural Memory Patterns, Structural Trace Patterns, Systems Thinking, Testing, Tools, Trace Analysis Patterns, Troubleshooting Methodology, Unified Debugging Patterns, Uses of UML, Victimware, Virtualization, Visual Dump Analysis, Windows System Administration, Workaround Patterns | No Comments »
Tuesday, November 30th, 2010
MAaaS includes 2 complementary DA+TA services:
1. Dump Analysis as a Service (DAaaS)
2. Trace Analysis as a Service (TAaaS)
Memory Dump Analysis Services is the first organization to provide such a service at an audit and certification levels.
- Dmitry Vostokov @ DumpAnalysis.org + TraceAnalysis.org -
Posted in Certification, Complete Memory Dump Analysis, Crash Analysis Report Environment (CARE), Crash Dump Analysis, Crash Dump Patterns, Debugging, Dublin School of Security, Escalation Engineering, Malware Analysis, Malware Patterns, Memiotics (Memory Semiotics), Memoretics, Memory Analysis Forensics and Intelligence, Memory Analysis Report System, Memory Dump Analysis Services, Minidump Analysis, Security, Software Behavior Patterns, Software Technical Support, Software Trace Analysis, Software Trace Reading, Structural Memory Patterns, Structural Trace Patterns, Tools, Trace Analysis Patterns, Windows System Administration | No Comments »
Thursday, November 25th, 2010
Posted in Announcements, Complete Memory Dump Analysis, Crash Analysis Report Environment (CARE), Crash Dump Analysis, Crash Dump De-analysis, Crash Dump Patterns, Debugging, Debugging Industry, Escalation Engineering, Kernel Development, Memory Analysis Forensics and Intelligence, Memory Dump Analysis Services, Minidump Analysis, Software Behavior Patterns, Software Engineering, Software Technical Support, Software Trace Analysis, Software Troubleshooting Patterns, Tools, Trace Analysis Patterns, Vista, Windows 7, Windows Server 2008, Windows System Administration, Workaround Patterns, x64 Windows | No Comments »
Friday, November 12th, 2010
Five volumes of cross-disciplinary Anthology (dubbed by the author “The Summa Memorianica”) lay the foundation of the scientific discipline of Memoretics (study of computer memory snapshots and their evolution in time) that is also called Memory Dump and Software Trace Analysis.ca
The 5th volume contains revised, edited, cross-referenced, and thematically organized selected DumpAnalysis.org blog posts about crash dump, software trace analysis and debugging written in February 2010 - October 2010 for software engineers developing and maintaining products on Windows platforms, quality assurance engineers testing software on Windows platforms, technical support and escalation engineers dealing with complex software issues, and security researchers, malware analysts and reverse engineers. The fifth volume features:
- 25 new crash dump analysis patterns
- 11 new pattern interaction case studies (including software tracing)
- 16 new trace analysis patterns
- 7 structural memory patterns
- 4 modeling case studies for memory dump analysis patterns
- Discussion of 3 common analysis mistakes
- Malware analysis case study
- Computer independent architecture of crash analysis report service
- Expanded coverage of software narratology
- Metaphysical and theological implications of memory dump worldview
- More pictures of memory space and physicalist art
- Classification of memory visualization tools
- Memory visualization case studies
- Close reading of the stories of Sherlock Holmes: Dr. Watson’s observational patterns
- Fully cross-referenced with Volume 1, Volume 2, Volume 3, and Volume 4
Product information:
- Title: Memory Dump Analysis Anthology, Volume 5
- Author: Dmitry Vostokov
- Language: English
- Product Dimensions: 22.86 x 15.24
- Paperback: 400 pages
- Publisher: Opentask (10 December 2010)
- ISBN-13: 978-1-906717-96-4
- Hardcover: 400 pages
- Publisher: Opentask (10 December 2010)
- ISBN-13: 978-1-906717-97-1

Back cover features memory space art image Hot Computation: Memory on Fire.
- Dmitry Vostokov @ DumpAnalysis.org + TraceAnalysis.org -
Posted in Aesthetics of Memory Dumps, Announcements, Archaeology of Computer Memory, Art, Assembly Language, Books, C and C++, CDF Analysis Tips and Tricks, Categorical Debugging, Common Mistakes, Complete Memory Dump Analysis, Computer Science, Crash Analysis Report Environment (CARE), Crash Dump Analysis, Crash Dump De-analysis, Crash Dump Patterns, Debugging, Debugging Methodology, Debugging Slang, Deep Down C++, Dr. Watson, Dublin School of Security, Education and Research, Escalation Engineering, Fun with Crash Dumps, Fun with Debugging, Fun with Software Traces, General Memory Analysis, Hermeneutics of Memory Dumps and Traces, Images of Computer Memory, Kernel Development, Malware Analysis, Malware Patterns, Mathematics of Debugging, Memiotics (Memory Semiotics), Memoidealism, Memoretics, Memory Analysis Culture, Memory Analysis Forensics and Intelligence, Memory Analysis Report System, Memory Diagrams, Memory Dreams, Memory Dump Analysis Jobs, Memory Dump Analysis Services, Memory Dump Analysis and History, Memory Dumps in Movies, Memory Dumps in Myths, Memory Religion (Memorianity), Memory Space Art, Memory Systems Language, Memory Visualization, Memory and Glitches, Memuonics, Metaphysical Society of Ireland, Minidump Analysis, Movies and Debugging, Multithreading, Museum of Debugging, Music for Debugging, Music of Computation, New Acronyms, New Words, Paleo-debugging, Pattern Models, Pattern Prediction, Philosophy, Physicalist Art, Psychoanalysis of Software Maintenance and Support, Publishing, Science of Memory Dump Analysis, Science of Software Tracing, Security, Software Architecture, Software Behavior Patterns, Software Chorography, Software Chorology, Software Defect Construction, Software Engineering, Software Generalist, Software Maintenance Institute, Software Narratology, Software Technical Support, Software Trace Analysis, Software Trace Analysis and History, Software Trace Deconstruction, Software Trace Reading, Software Trace Visualization, Software Tracing for Dummies, Software Troubleshooting Patterns, Software Victimology, Stack Trace Collection, Structural Memory Analysis and Social Sciences, Structural Memory Patterns, Structural Trace Patterns, Systems Thinking, Testing, Theology, Tool Objects, Tools, Trace Analysis Patterns, Training and Seminars, Troubleshooting Methodology, Uses of UML, Victimware, Virtualization, Vista, Visual Dump Analysis, Webinars, WinDbg Scripts, WinDbg Tips and Tricks, WinDbg for GDB Users, Windows 7, Windows Server 2008, Windows System Administration, Workaround Patterns, x64 Windows | No Comments »
Saturday, October 30th, 2010
If you develop and debug user space applications (and/or doing crash dump analysis in user space) or specialize in user space security and you want to understand Windows kernel dumps and device drivers better (and probably start writing your own kernel tools) or understand malware rootkits better here is the reading list I found the most effective over the last 7 years:
0.0. Read and re-read Windows Internals book in parallel while reading all other books. I read all editions by the way. It will show you the big picture and useful WinDbg commands and techniques but you need to read device driver books to fill the gaps and be confident in kernel space:

0.1. Start with The Windows 2000 Device Driver Book: A Guide for Programmers . This short book will show you the basics and you can start writing your drivers and kernel tools immediately.

0.2. Next read Windows NT Device Driver Development book to consolidate your knowledge. This book has been reprinted by OSR (I own the original New Riders Press edition):

0.3. Don’t stop here. Read Developing Windows NT Device Drivers: A Programmer’s Handbook . This is the very good book explaining everything in great detail and good pictures. You will finally understand various buffering methods.

0.4. Continue with WDM drivers and modern presentation: Programming the Microsoft Windows Driver Model . Must read even if your drivers are not WDM.

0.5. Finally read Developing Drivers with the Windows Driver Foundation book. It also covers ETW (event tracing for Windows), WinDbg extensions, PREfast and static driver verifier.

0.6. There is a forthcoming book Windows 7 Device Driver at the time of this writing that also covers WDF so you might want to start with #0.6 and continue with #0.5 as a reference:

Additional reading (not including DDK Help which you will use anyway) can be done in parallel after finishing “Windows NT Device Driver Development” book:
1.1. OSR NT Insider articles. I have their full printed collection 1996 - 2006 plus all the latest issues (looks like print editions are discontinued and the new ones are only digital):
http://www.osronline.com/
1.2. Windows NT File System Internals reprinted by OSR (I have the original O’Reilly edition):

1.3. Windows NT/2000 Native API Reference is fun to browse occasionally and indispensable if you don’t have access to Windows source code:

1.4. Rootkits: Subverting the Windows Kernel book will show you Windows kernel from the hacker perspective. In addition you will find the overview of kernel areas not covered in other books.

1.5. The Rootkit Arsenal: Escape and Evasion in the Dark Corners of the System is another excellent book that is up to date and explains kernel staff from ab initio. I’m reading it at the time of this writing and recommend it to read first or in parallel to all other books:

Of course, you must know C language and its idioms really well. Really know it down to assembly language level! I’ll publish other reading lists soon including reverse engineering classics. Stay tuned.
- Dmitry Vostokov @ DumpAnalysis.org + TraceAnalysis.org -
Posted in Books, Crash Dump Analysis, Debugging, Kernel Development, Malware Analysis, Memory Analysis Forensics and Intelligence, Security, Software Architecture | 1 Comment »
Friday, October 29th, 2010
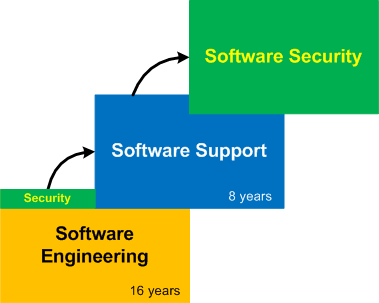
Having spent 16 years in software engineering I ventured into software support in 2003 (with 8th year started at the time of this writing). Now it is time for the next gradual shift into software security (the domain I previously had exposure to but not as a primary focus):
The title of this post is borrowed from the book I read from cover to cover long time ago and recently put on my desk again:
Journey of the Software Professional: The Sociology of Software Development

- Dmitry Vostokov @ DumpAnalysis.org + TraceAnalysis.org -
Posted in Announcements, Books, Dublin School of Security, History, Memory Analysis Forensics and Intelligence, Software Engineering, Software Technical Support | 4 Comments »
Thursday, October 28th, 2010
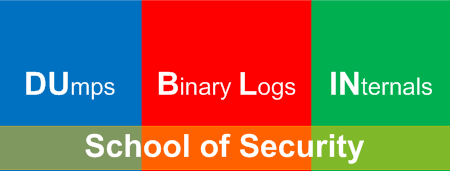
Motivated by the existence of London School of Economics (LSE) I just founded DSS. The program to be communicated soon and includes general memory dump and software trace analysis as a foundation for security. I like the name very much because of its additional meaning:
DUmps Binary Logs INternals
- Dmitry Vostokov @ DumpAnalysis.org + TraceAnalysis.org -
Posted in Announcements, Dublin School of Security, Malware Analysis, Malware Patterns, Memoretics, Memory Analysis Forensics and Intelligence, Memory Analysis Report System, New Acronyms, Security | 1 Comment »
Saturday, October 23rd, 2010
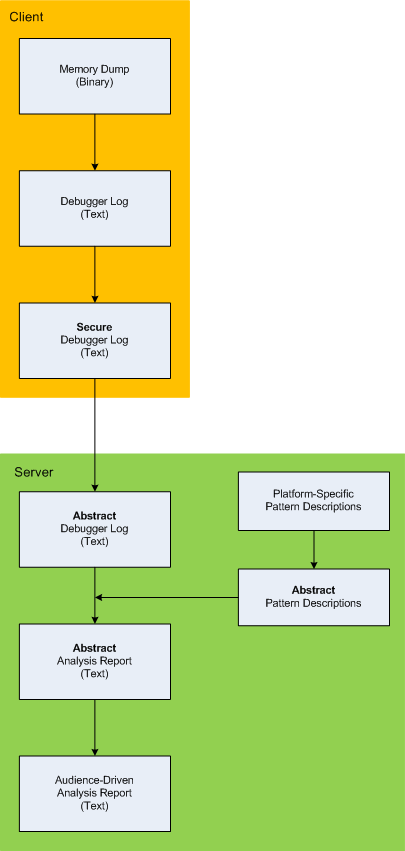
Here is the description of a high-level architecture of the previously announced project CARE (Crash Analysis Report Environment). To remind, the main idea of the project is to process memory dumps on a client to save debugger logs. They can be sent to a server for pattern-driven analysis of software behaviour. Textual logs can also be inspected by a client security team before sending. Certain sensitive information can be excluded or modified to have generic meaning according to the built-in processing rules like renaming (for example, server names and folders). Before processing, verified secured logs are converted to abstract debugger logs. Abstracting platform-specific debugger log format allows reuse of the same architecture for different computer platforms. We call it CIA (Computer Independent Architecture). Do not confuse it with ICA (Independent Computer Architecture) and CIA acronym is more appropriate for memory analysis (like similar MAFIA acronym, Memory Analysis Forensics and Intelligence Architecture). These abstract logs are checked for various patterns (in abstracted form) using abstract debugger commands and an abstract report is generated according to various checklists. Abstract reports are then converted to structured reports for the required audience level. Abstract memory analysis pattern descriptions are prepared from platform-specific pattern descriptions. In certain architectural component deployment configurations both client and server parts can reside on the same machine. Here’s the simple diagram depicting the flow of processing:
- Dmitry Vostokov @ DumpAnalysis.org + TraceAnalysis.org -
Posted in Announcements, Crash Analysis Report Environment (CARE), Crash Dump Analysis, Crash Dump Patterns, Debugging, Memory Analysis Forensics and Intelligence, New Acronyms, Security, Software Architecture, Software Behavior Patterns, Software Technical Support, Structural Memory Patterns, Tools | No Comments »
Friday, October 22nd, 2010
I detour for MARS expedition. You may also call it Memory Analysis Report System as malware analysis is always exploration of memory (in general). Why is this sudden change of course? After reading Gilles Deleuze I want to broaden the concept of “malware” and give it new orientation and direction of thinking. Beside that I also want new challenges after many years of research in pattern-driven memory dump and software trace analysis of abnormal software behaviour.
You may have also noticed small restructuring (rebranding) of this blog and DumpAnalysis.org headers.
See you there 
- Dmitry Vostokov @ DumpAnalysis.org + TraceAnalysis.org -
Posted in Announcements, Archaeology of Computer Memory, Assembly Language, Computer Science, Education and Research, General Memory Analysis, Malware Analysis, Malware Patterns, Memiotics (Memory Semiotics), Memoretics, Memory Analysis Forensics and Intelligence, Memory Analysis Report System, Memory Dump Analysis Services, New Acronyms, Philosophy, Science of Memory Dump Analysis, Science of Software Tracing, Security, Software Trace Analysis, Software Victimology, Structural Memory Patterns, Systems Thinking, Tools, Trace Analysis Patterns, Victimware, Windows System Administration | No Comments »
Wednesday, October 20th, 2010
As a practical example of applying behavioral and structural pattern analysis of computer memory and traces OpenTask plans to publish the following title next year:
- Title: Malware Patterns: Structure and Behavior of Computer Adware, Crimeware, Rootkits, Scareware, Spyware, Trojans, Viruses, Victimware and Worms
- Author: Dmitry Vostokov
- Paperback: 1200 pages
- Publisher: OpenTask (October 2011)
- ISBN-13: 978-1-908043-01-6
The inclusion of victimware is necessary because of the effects of defective malware.
- Dmitry Vostokov @ DumpAnalysis.org + TraceAnalysis.org -
Posted in Announcements, Books, Crash Dump Analysis, Crash Dump Patterns, Malware Analysis, Malware Patterns, Memiotics (Memory Semiotics), Memoretics, Memory Analysis Forensics and Intelligence, Publishing, Science of Memory Dump Analysis, Science of Software Tracing, Security, Software Behavior Patterns, Software Defect Construction, Software Trace Analysis, Software Victimology, Structural Memory Patterns, Trace Analysis Patterns, Victimware | No Comments »
Monday, October 18th, 2010
One of my home computers got infected. I confess that I don’t have an antivirus because I’m conscious while browsing Internet (the last infected machine I had was an MSDOS one) so perhaps one of my family members was less careful. I paid attention to the possible infection when IE started crashing when I was pushing a login button on one of online banking websites. However I didn’t pay enough attention because it was a heap corruption (see my previous case study) and simply switched to another non-crashing browser vendor such as Apple Safari. Since then IE was crashing periodically when I was pushing various admin buttons in WordPress but I didn’t pay much attention too because it was still heap corruption and I was thinking it was a script processing defect, waiting for a new IE update. Until one day explorer.exe crashed as well when I was entering a password for an ftp account. Here’s the stack trace that I got after opening a crash dump in WinDbg:
0:030> kL 100

ChildEBP RetAddr

0663e9c4 76f05610 ntdll!KiFastSystemCallRet

0663e9c8 7706a5d7 ntdll!NtWaitForMultipleObjects+0xc

0663ea64 7706a6f0 kernel32!WaitForMultipleObjectsEx+0×11d

0663ea80 770de2a5 kernel32!WaitForMultipleObjects+0×18

0663eaec 770de4d1 kernel32!WerpReportFaultInternal+0×16d

0663eb00 770bff4d kernel32!WerpReportFault+0×70

0663eb8c 76f17fc1 kernel32!UnhandledExceptionFilter+0×1b5

0663eb94 76ea9bdc ntdll!__RtlUserThreadStart+0×6f

0663eba8 76ea4067 ntdll!_EH4_CallFilterFunc+0×12

0663ebd0 76f05f79 ntdll!_except_handler4+0×8e

0663ebf4 76f05f4b ntdll!ExecuteHandler2+0×26

0663eca4 76f05dd7 ntdll!ExecuteHandler+0×24

0663eca4 93181a08 ntdll!KiUserExceptionDispatcher+0xf

WARNING: Frame IP not in any known module. Following frames may be wrong.

0663efa0 0321aaaf 0×93181a08

0663efac 6b887974 0×321aaaf

0663efbc 6b8973ad msieftp!InternetCloseHandleWrap+0×10

0663f810 6b897fbf msieftp!CFtpSite::_QueryServerFeatures+0×57

0663fa50 6b8981ae msieftp!CFtpSite::_LoginToTheServer+0×235

0663fa94 6b88b39e msieftp!CFtpSite::GetHint+0xe8

0663fab4 6b88b412 msieftp!CFtpDir::GetHint+0×1f

0663fae4 6b88ed38 msieftp!CFtpDir::WithHint+0×49

0663fb10 6b88eda4 msieftp!CFtpEidl::_Init+0×6e

0663fb2c 7584ecb4 msieftp!CFtpEidl::Next+0×41

0663fb64 7584f63b shell32!CEnumThread::_EnumFolder+0×65

0663fb80 7584f5ba shell32!CEnumThread::_RunEnum+0×6f

0663fb8c 7645c2c9 shell32!CEnumThread::s_EnumThreadProc+0×14

0663fc10 7706d0e9 shlwapi!WrapperThreadProc+0×11c

0663fc1c 76ee19bb kernel32!BaseThreadInitThunk+0xe

0663fc5c 76ee198e ntdll!__RtlUserThreadStart+0×23

0663fc74 00000000 ntdll!_RtlUserThreadStart+0×1b
Notice 0×321aaaf address. We see that wininet function was hooked by a code running in 0×0321XXXX range:
0:030> ub 6b887974

msieftp!InternetOpenWrap+0×46:

6b887963 cc              int     3

msieftp!InternetCloseHandleWrap:

6b887964 8bff            mov     edi,edi

6b887966 55              push    ebp

6b887967 8bec            mov     ebp,esp

6b887969 56              push    esi

6b88796a ff7508          push    dword ptr [ebp+8]

6b88796d 33f6            xor     esi,esi

6b88796f e82e610100      call    msieftp!InternetCloseHandle (6b89daa2)
0:030> u 6b89daa2

msieftp!InternetCloseHandle:

6b89daa2 ff2500278a6b    jmp     dword ptr [msieftp!_imp__InternetCloseHandle (6b8a2700)]

msieftp!_imp_load__InternetConnectW:

6b89daa8 b834278a6b      mov     eax,offset msieftp!_imp__InternetConnectW (6b8a2734)

6b89daad e9b4feffff      jmp     msieftp!_tailMerge_WININET_dll (6b89d966)

6b89dab2 cc              int     3

6b89dab3 cc              int     3

6b89dab4 cc              int     3

6b89dab5 cc              int     3

6b89dab6 cc              int     3
0:030> dp 6b8a2700 l1

6b8a2700  76dc9088
0:030> u 76dc9088

wininet!InternetCloseHandle:

76dc9088 e9031a458c      jmp     0321aa90

76dc908d 51              push    ecx

76dc908e 51              push    ecx

76dc908f 53              push    ebx

76dc9090 56              push    esi

76dc9091 57              push    edi

76dc9092 33db            xor     ebx,ebx

76dc9094 33ff            xor     edi,edi
0:030> u 0321aa90

0321aa90 55              push    ebp

0321aa91 8bec            mov     ebp,esp

0321aa93 837d0800        cmp     dword ptr [ebp+8],0

0321aa97 740c            je      0321aaa5

0321aa99 8b4508          mov     eax,dword ptr [ebp+8]

0321aa9c 50              push    eax

0321aa9d e82eedffff      call    032197d0

0321aaa2 83c404          add     esp,4
This address range was not on a loaded module list so I used image scanning command to detect Hidden Module:
0:030> .imgscan

MZ at 00080000, prot 00000002, type 01000000 - size 2cd000

Name: explorer.exe

MZ at 003d0000, prot 00000002, type 00040000 - size 2000

MZ at 018a0000, prot 00000008, type 00040000 - size 7000

MZ at 031c0000, prot 00000008, type 00040000 - size 3000

MZ at 031d0000, prot 00000002, type 01000000 - size c000

Name: DLAAPI_W.DLL

MZ at 03210000, prot 00000040, type 00020000 - size 1d000

[…]
!dh command was not showing any useful hints so I dumped the whole address range of that Unknown Component and found strange strings inside:
0:030> db 03210000 03210000+1d000

[...]

032246d0  2a 00 00 00 2a 00 00 00-42 6c 61 63 6b 77 6f 6f  *...*...Blackwoo

032246e0  64 50 52 4f 00 00 00 00-46 69 6e 61 6d 44 69 72  dPRO....FinamDir

032246f0  65 63 74 00 47 72 61 79-42 6f 78 00 4d 62 74 50  ect.GrayBox.MbtP

03224700  52 4f 00 00 4c 61 73 65-72 00 00 00 4c 69 67 68  RO..Laser...Ligh

03224710  74 53 70 65 65 64 00 00-4c 54 47 72 6f 75 70 00  tSpeed..LTGroup.

03224720  4d 62 74 00 53 63 6f 74-54 72 61 64 65 72 00 00  Mbt.ScotTrader..

03224730  53 61 78 6f 54 72 61 64-65 72 00 00 00 00 00 00  SaxoTrader......

03224740  50 72 6f 67 72 61 6d 3a-20 20 20 25 73 0d 0a 55  Program:   %s..U

03224750  73 65 72 6e 61 6d 65 3a-20 20 25 73 0d 0a 50 61  sername:  %s..Pa

03224760  73 73 77 6f 72 64 3a 20-20 25 73 0d 0a 41 63 63  ssword:  %s..Acc

03224770  6f 75 6e 74 4e 4f 3a 20-25 73 0d 0a 53 65 72 76  ountNO: %s..Serv

03224780  65 72 3a 20 20 20 20 25-73 0d 0a 00 5c 00 00 00  er:    %s...\...

03224790  25 73 20 25 73 00 00 00-25 73 00 00 50 52 4f 43  %s %s...%s..PROC

032247a0  45 53 53 4f 52 5f 49 44-45 4e 54 49 46 49 45 52  ESSOR_IDENTIFIER

032247b0  00 00 00 00 25 64 00 00-25 30 32 58 00 00 00 00  ....%d..%02X....

032247c0  30 00 00 00 2c 00 00 00-25 30 32 58 00 00 00 00  0...,...%02X....

[...]

03225000  01 01 00 00 5c 00 63 00-68 00 6b 00 6e 00 74 00  ....\.c.h.k.n.t.

03225010  66 00 73 00 2e 00 65 00-78 00 65 00 00 00 00 00  f.s...e.x.e.....

03225020  5c 00 63 00 68 00 6b 00-6e 00 74 00 66 00 73 00  \.c.h.k.n.t.f.s.

03225030  2e 00 64 00 61 00 74 00-00 00 00 00 a6 b7 04 5e  ..d.a.t........^

[...]
I didn’t pay attention to chkntfs.exe but did a search for SaxoTrader string in all files using findstr command and found chkntfs.exe as a system file in Start Menu \ Programs \ Startup folder in roaming user AppData. I couldn’t remove it so I had to boot in command line mode to do that. The crashes were gone since that. I double checked various iexplore.exe crash dumps saved previously and found the same module loaded, for example:
0:005> .imgscan

MZ at 00040000, prot 00000040, type 00020000 - size 1d000

MZ at 00340000, prot 00000002, type 01000000 - size 9c000

Name: iexplore.exe

[…]
Here we consider IE and Explorer as victimware of malware.
- Dmitry Vostokov @ DumpAnalysis.org + TraceAnalysis.org -
Posted in Crash Dump Analysis, Crash Dump Patterns, Malware Analysis, Memory Analysis Forensics and Intelligence, Security, Victimware, Victimware Analysis | 2 Comments »
Friday, October 1st, 2010
The next pattern is called Region Boundary. It is an inaccessible range of memory that surrounds Closed Memory Region. For example, the closed region of a kernel stack for the following thread has a one page boundary region next to its Base:
1: kd> !thread

THREAD fffffa8004544b60  Cid 0a6c.0acc  Teb: 000007fffffde000 Win32Thread: fffff900c1eb4010 RUNNING on processor 1

IRP List:

    fffffa8004d7e010: (0006,0118) Flags: 00060000  Mdl: 00000000

Not impersonating

DeviceMap                 fffff8a001e84c00

Owning Process            fffffa8004f68370       Image:         NotMyfault.exe

Attached Process          N/A            Image:         N/A

Wait Start TickCount      40290          Ticks: 0

Context Switch Count      408                 LargeStack

UserTime                  00:00:00.015

KernelTime                00:00:00.015

Win32 Start Address NotMyfault (0x0000000140002708)

Stack Init fffff8800587cdb0 Current fffff8800587c6f0

Base fffff8800587d000 Limit fffff88005874000 Call 0

[…]
1: kd> !pte fffff880`0587d000

                                           VA fffff8800587d000

PXE at FFFFF6FB7DBEDF88    PPE at FFFFF6FB7DBF1000    PDE at FFFFF6FB7E200160    PTE at FFFFF6FC4002C3E8

contains 0000000133D84863  contains 0000000133D83863  contains 00000000AA9AE863  contains 0000000000000000

pfn 133d84    ---DA--KWEV  pfn 133d83    ---DA--KWEV  pfn aa9ae     ---DA--KWEV  not valid
1: kd> !pte fffff880`0587d000+0n4096-1

  VA fffff8800587dfff

PXE at FFFFF6FB7DBEDF88 PPE at FFFFF6FB7DBF1000 PDE at FFFFF6FB7E200160 PTE at FFFFF6FC4002C3E8

contains 0000000133D84863 contains 0000000133D83863 contains 00000000AA9AE863 contains 0000000000000000

pfn 133d84 —DA–KWEV pfn 133d83 —DA–KWEV pfn aa9ae —DA–KWEV not valid
1: kd> !pte fffff880`0587d000+0n4096

                                           VA fffff8800587e000

PXE at FFFFF6FB7DBEDF88    PPE at FFFFF6FB7DBF1000    PDE at FFFFF6FB7E200160    PTE at FFFFF6FC4002C3F0

contains 0000000133D84863  contains 0000000133D83863  contains 00000000AA9AE863  contains 8000000028230963

pfn 133d84    —DA–KWEV  pfn 133d83    —DA–KWEV  pfn aa9ae     —DA–KWEV  pfn 28230     -G-DA–KW-V
The region after boundary belongs to another process thread kernel stack (I use CodeMachine WinDbg extension here):
1: kd> !cmkd.kvas  fffff8800587e000

kvas : Show region containing fffff8800587e000

### Start            End                                  Length Type

006 fffff88000000000 fffff89fffffffff       2000000000 ( 128 GB) SystemPTEs

Thread FFFFFA80053D0B60 [0798.0a5c] Stack fffff88005884000 - fffff8800587e000
1: kd> !thread FFFFFA80053D0B60

THREAD fffffa80053d0b60  Cid 0798.0a5c  Teb: 000007fffffdd000 Win32Thread: 0000000000000000 WAIT: (DelayExecution) UserMode Non-Alertable

    fffffa80053d0f20  Semaphore Limit 0x1

Not impersonating

DeviceMap                 fffff8a001e84c00

Owning Process            fffffa80053ce630       Image:         ApplicationB.exe

Attached Process          N/A            Image:         N/A

Wait Start TickCount      34911          Ticks: 5379 (0:00:01:23.912)

Context Switch Count      22

UserTime                  00:00:00.000

KernelTime                00:00:00.000

Win32 Start Address 0x000000013fe01538

Stack Init fffff88005883db0 Current fffff88005883970

Base fffff88005884000 Limit fffff8800587e000 Call 0

[…]
- Dmitry Vostokov @ DumpAnalysis.org + TraceAnalysis.org -
Posted in Crash Dump Analysis, Debugging, Memoretics, Memory Analysis Forensics and Intelligence, Structural Memory Patterns | No Comments »
Friday, October 1st, 2010
Now we propose the next group of general patterns related to memory regions (the terminology was partially influenced from topology). The first one we call Memory Region, for example:
1: kd> dp fffff88005875000 fffff88005875010

fffff880`05875000  039b5000`6e696268 00000000`00002000

fffff880`05875010  00000000`00000000
There are Open and Closed memory regions. We can extend the former ones in one or both directions:
1: kd> dp fffff88005875000-10 fffff88005875010+10

fffff880`05874ff0  6ab90c4f`039ba1b8 039b8050`fffffff8

fffff880`05875000  039b5000`6e696268 00000000`00002000

fffff880`05875010  00000000`00000000 00000000`00000000

fffff880`05875020  00000294`ffffffd0
The closed regions cannot be read past its boundary, like this kernel stack region [fffff880`05874000 fffff8800587d000):
1: kd> dp fffff88005874000-30

fffff880`05873fd0  ????????`???????? ????????`????????

fffff880`05873fe0  ????????`???????? ????????`????????

fffff880`05873ff0  ????????`???????? ????????`????????

fffff880`05874000  039ba000`6e696268 00000000`00001000

fffff880`05874010  00000000`00000000 00000000`00000000

fffff880`05874020  00206b6e`ffffffa8 01cae7bd`b8aca323

fffff880`05874030  039b6698`00000000 00000000`00000001

fffff880`05874040  ffffffff`039bafe8 039b6710`00000004
1: kd> dp fffff8800587d000-30

fffff880`0587cfd0  00000000`00000000 00000000`00000000

fffff880`0587cfe0  00000000`00000000 00000000`00000000

fffff880`0587cff0  00000000`00000000 00000000`00000000

fffff880`0587d000  ????????`???????? ????????`????????

fffff880`0587d010  ????????`???????? ????????`????????

fffff880`0587d020  ????????`???????? ????????`????????

fffff880`0587d030  ????????`???????? ????????`????????

fffff880`0587d040  ????????`???????? ????????`????????
- Dmitry Vostokov @ DumpAnalysis.org + TraceAnalysis.org -
Posted in Crash Dump Analysis, Debugging, Mathematics of Debugging, Memoretics, Memory Analysis Forensics and Intelligence, Structural Memory Patterns | 1 Comment »
Monday, September 27th, 2010
General Memory Analysis is another name for Memoretics, a discipline that studies memory snapshots including their similarities and differences on different system platforms such as Windows, Linus, Mac OS X, embedded and mobile systems, historical architectures, etc. The analysis of memory helps solve problems in various domains such as software troubleshooting and debugging, computer forensic analysis, etc.
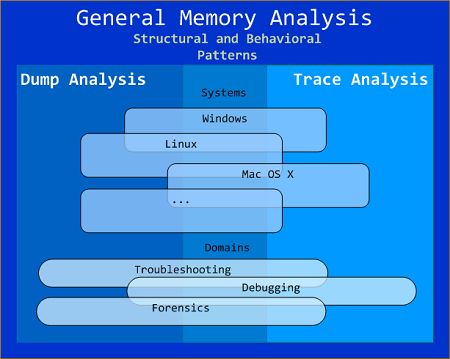
The current focus of interdisciplinary research is to build a unified memory pattern language that covers both behavioral and structural patterns and also to study the possibility of building memory systems from below, not from requirements -> architecture -> design -> implementation -> compilation -> linking -> loading -> execution but from directly modeling and assembling memory systems using memory patterns.
- Dmitry Vostokov @ DumpAnalysis.org + TraceAnalysis.org -
Posted in Announcements, Crash Dump Analysis, Debugging, General Memory Analysis, Memiotics (Memory Semiotics), Memoretics, Memory Analysis Forensics and Intelligence, Memory Systems Language, Security, Software Behavior Patterns, Software Technical Support, Software Trace Analysis, Structural Memory Patterns, Trace Analysis Patterns | No Comments »
Sunday, September 26th, 2010
The next pattern is called Snapshot Collection. This is a collection of files combined from either linear memory snapshots or aggregate snapshots saved as separate files at different times. Typical examples include:
- Several process memory dump files saved sequentially from a growing heap leaking process
- Several software traces from working and non-working scenarios for comparative analysis
- Dmitry Vostokov @ DumpAnalysis.org + TraceAnalysis.org -
Posted in Crash Dump Analysis, Debugging, Memoretics, Memory Analysis Forensics and Intelligence, Structural Memory Patterns | No Comments »