Archive for the ‘Memory Analysis Forensics and Intelligence’ Category
Wednesday, March 18th, 2009
Yesterday I submitted the magazine to print and distribution world-wide. If everything is right it should be available by the end of this month. This first issue features 12 page WinDbg command supplement to pattern-driven memory dump analysis methodology, an overview of Win32dd complete memory dumper and PowerDbg enhancements to debug ASP.NET code. The magazine will only be available in print.
- Dmitry Vostokov @ DumpAnalysis.org -
Posted in Announcements, Books, Crash Dump Analysis, Crash Dump Patterns, Debugged! MZ/PE, Debugging, Memory Analysis Forensics and Intelligence, Minidump Analysis, Publishing, Security, Software Technical Support, Testing, Tools, Training and Seminars, WinDbg Scripts, WinDbg Tips and Tricks | No Comments »
Friday, March 6th, 2009
Based on John Moore 8 science criteria we can consider Memory Dump Analysis (MDA) as a science:
1. MDA is based on data (memory dumps) collected in the field or re-pro / test environment.
2. Data (memory dumps) is collected to answer troubleshooting, debugging or forensics and intelligence questions. Observations in memory dumps are made to support or refute these questions.
3. Analysis of data (via memory dump analyzers, debuggers and log analyzers) is done objectively.
4. Troubleshooting, debugging or forensics hypotheses are developed and they are consistent with observations and compatible with general conceptual computer memory framework.
5. Troubleshooting, debugging or forensics hypotheses are tested and several comparable competing ones may be developed at any one time.
6. Generalizations are made that are valid universally within the domain of MDA.
7. The facts are confirmed independently.
8. Previously puzzling facts are explained.
It is also interesting to generalize the domain of MDA to empirical data collection via the so called universal memory dumps.
- Dmitry Vostokov @ DumpAnalysis.org -
Posted in Crash Dump Analysis, Memory Analysis Forensics and Intelligence, Philosophy, Science of Memory Dump Analysis, Security | No Comments »
Monday, March 2nd, 2009
Last week I had an opportunity to present a pattern-driven memory dump analysis methodology at a global engineering conference. Now in a series of articles I’m going to clarify certain points and extend it to wider domain of memory analysis including computer memory forensics and intelligence.
Today I post the reworked picture of a waterfall-like analysis process:
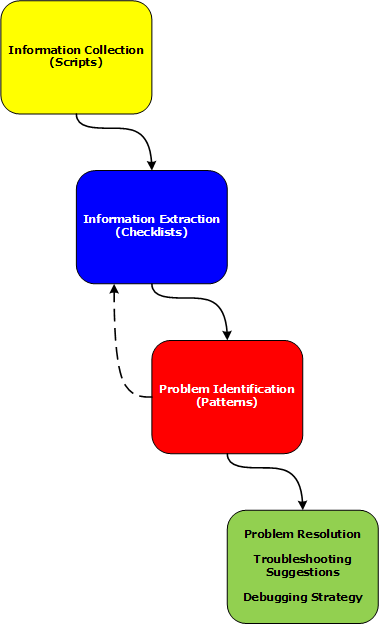
Various phases and their relationship will be discussed in subsequent parts together with examples.
- Dmitry Vostokov @ DumpAnalysis.org -
Posted in Citrix, Crash Dump Analysis, Crash Dump Patterns, Debugging, Debugging Methodology, Memory Analysis Forensics and Intelligence, Security, Software Technical Support, Troubleshooting Methodology, WinDbg Scripts | 2 Comments »
Friday, January 16th, 2009
DumpAnalysis.org accepts hardware such as laptops for reviewing in relation to their suitability for extreme debugging, computer forensics, crash dump analysis and memory visualization. If you work for a H/W company like HP, Apple, Dell, Acer, Sony or any other respectable manufacturer please don’t hesitate to forward this post to your management: it could be your company brand or laptop model that debugging and software technical support community chooses next time of upgrade or for T&D / R&D! H/W reviews will be posted on the main portal page which currently has an audience of more than a hundred thousand unique visitors per year from more than 20,000 network locations (*).
If your company is interested please don’t hesitate to use this contact form:
http://www.dumpanalysis.org/contact
(*) From Google Analytics report.
- Dmitry Vostokov @ DumpAnalysis.org -
Posted in Announcements, Crash Dump Analysis, Debugging, Hardware, Memory Analysis Forensics and Intelligence, Memory Visualization, Vista, Windows Server 2008 | No Comments »
Tuesday, December 30th, 2008
I didn’t know that such challenge and contest exists until I came across this blog:
http://blog.flexilis.com/2008/12/the-2008-malware-challenge/
I’m always interested in malware and reverse engineering because sites about these topics usually contain hard-to-find Windows internals information. May be I try next year if such opportunity arises again.
- Dmitry Vostokov @ DumpAnalysis.org -
Posted in Memory Analysis Forensics and Intelligence, Security | No Comments »
Saturday, December 27th, 2008
It had always been my dream since I left Moscow State University to be associated with a research institute. Until yesterday it became a reality with the announcement of
Memory Analysis & Debugging Institute (MA&DI).
From: http://www.dumpanalysis.org/madinstitute-announcement
- Dmitry Vostokov @ DumpAnalysis.org -
Posted in Announcements, Crash Dump Analysis, Debugging, Education and Research, History, Memory Analysis Forensics and Intelligence, Memory Visualization, Philosophy, Science of Memory Dump Analysis, Security, Software Technical Support, Testing, Training and Seminars | 1 Comment »
Friday, November 28th, 2008
Following the release of WinDbg: A Reference Poster and Learning Cards the following book is planned for Windows (GDB), Linux and FreeBSD users:
- Title: GDB and KDB Debuggers:
A Reference Poster and Learning Cards
- Author: Gonçalo Gomes
- Publisher: Opentask (1 April 2009)
- Language: English
- Product Dimensions: 28.0 x 21.6
- ISBN-13: 978-1-906717-39-1
- Paperback: 16 pages
- Dmitry Vostokov @ DumpAnalysis.org -
Posted in Announcements, Books, Crash Dump Analysis, Debugging, GDB for WinDbg Users, Memory Analysis Forensics and Intelligence, Publishing, Security, Software Technical Support, Tools | No Comments »
Tuesday, November 25th, 2008
As one of the new initiatives for the Year of Debugging DumpAnalysis Portal will publish bimonthly full color 16 page publication called:
Debugged! MZ/PE: MagaZine for/from Practicing Engineers
The only serial publication dedicated entirely to Windows® debugging
The first issue is planned for March, 2009 and will have ISBN-13: 978-1-906717-38-4. If it goes well I’m planning to have ISSN number assigned to it too. More details will be announced soon.
- Dmitry Vostokov @ DumpAnalysis.org -
Posted in Announcements, Assembly Language, Books, Bugchecks Depicted, CDA Pattern Classification, Citrix, Common Mistakes, Crash Dump Analysis, Crash Dump Patterns, Crash Dumps for Dummies, Data Recovery, Debugged! MZ/PE, Debugging, IDA for WinDbg Users, Kernel Development, Memory Analysis Forensics and Intelligence, Memory Visualization, Minidump Analysis, Philosophy, Publishing, Security, Software Technical Support, Testing, Tools, Training and Seminars, Troubleshooting Methodology, Vista, WinDbg Scripts, WinDbg Tips and Tricks, WinDbg for GDB Users, Windows Server 2008 | 4 Comments »
Tuesday, November 25th, 2008
I’m pleased to announce that OpenTask has submitted the book Dumps, Bugs and Debugging Forensics: The Adventures of Dr. Debugalov for printing and here is the link to TOC:
Table of Contents
- Dmitry Vostokov @ DumpAnalysis.org -
Posted in Announcements, Books, Bugtations, Cartoons, Certification, Code Reading, Crash Dump Analysis, Crash Dumps for Dummies, Debugging, Fun with Crash Dumps, Memory Analysis Forensics and Intelligence, New Words, Philosophy, Publishing, Science of Memory Dump Analysis, Software Technical Support, Testing, WinDbg Tips and Tricks | No Comments »
Monday, November 24th, 2008
I was thinking about the universal character of debugging for quite some time and finally the following bugtation provided an inspiration for a new book title to be published during the Year of Debugging:
Title: Breaking the Bug: Debugging as a Natural Phenomenon
ISBN-13: 978-1906717377
More product details will be announced later.
Actually I believe in the mystical nature of various debugging numbers and sequences. For example, the ISBN number of this book ends in 377 which is the octal base equivalent of 0n255 or 0xFF.
- Dmitry Vostokov @ DumpAnalysis.org -
Posted in Announcements, Books, Crash Dump Analysis, Debugging, Fun with Crash Dumps, Hardware, History, Memory Analysis Forensics and Intelligence, Philosophy, Publishing, Science of Memory Dump Analysis, Testing | No Comments »
Wednesday, November 5th, 2008
Matthieu Suiche has released the new version of win32dd tool with the ability to save physical memory in a WinDbg-compliant memory dump file including pages that normally are not saved in a complete memory dump.
- Dmitry Vostokov @ DumpAnalysis.org -
Posted in Announcements, Crash Dump Analysis, Data Recovery, Debugging, Memory Analysis Forensics and Intelligence, Security, Software Technical Support, Tools, Vista, Windows Server 2008 | No Comments »
Monday, November 3rd, 2008
I was always suspicious why kifastsystemcallretis the most searched keyword and now I think there are automated web scanning engines doing data mining for stack traces to keep their databases for crash dump analysis and other stats up-to-date. This is how I would design my own internet bot to find such stack traces. Originally I thought that people are looking for it and wrote this article:
What is KiFastSystemCallRet?
I might be wrong here and this function is searched by humans indeed because it is on top of stack traces and novice users of WinDbg or other debugging tools check its purpose.
- Dmitry Vostokov @ DumpAnalysis.org -
Posted in Crash Dump Analysis, Crash Dump Patterns, Memory Analysis Forensics and Intelligence, Stack Trace Collection | No Comments »
Saturday, October 18th, 2008
Paperback edition of Memory Dump Analysis Anthology, Volume 2 is finally available on Amazon and Barnes & Noble. Search Inside is also available on Amazon. In addition, I updated the list of recommended books:
Listmania! Crash Dump Analysis and Debugging
Hardcover edition will be available on Amazon and B&N in 2-3 weeks.
- Dmitry Vostokov @ DumpAnalysis.org -
Posted in Announcements, Assembly Language, Books, Bugchecks Depicted, CDF Analysis Tips and Tricks, Certification, Citrix, Common Mistakes, Crash Dump Analysis, Crash Dump Patterns, Crash Dumps for Dummies, Data Recovery, DebugWare Patterns, Debugging, Fun with Crash Dumps, Hardware, Kernel Development, Memory Analysis Forensics and Intelligence, Memory Dump Analysis Jobs, Memory Visualization, Minidump Analysis, Music for Debugging, New Words, Philosophy, Publishing, Science of Memory Dump Analysis, Security, Software Architecture, Software Technical Support, Stack Trace Collection, Testing, Tools, Training and Seminars, Troubleshooting Methodology, Virtualization, Vista, WinDbg Scripts, WinDbg Tips and Tricks, WinDbg for GDB Users, Windows Server 2008 | No Comments »
Saturday, October 11th, 2008
Seems railroad to it was a success: just got this message in my e-mail:
“Congratulations on passing your recent Microsoft Certification exam, inspiring confidence for your employer, your peers, and yourself with a widely-recognized validation of your skills on Microsoft technology.“
Because I haven’t done any exam since Windows Internals beta I assumed that I passed it and I was right! After registering at Microsoft certification site as MCP I was able to build my logo:
_1125.png)
Here is the link to Exam 70-660 information and required skills:
http://www.microsoft.com/learning/en/us/Exams/70-660.aspx
- Dmitry Vostokov @ DumpAnalysis.org -
Posted in Announcements, Assembly Language, Bugchecks Depicted, Certification, Citrix, Crash Dump Analysis, Debugging, Hardware, Kernel Development, Memory Analysis Forensics and Intelligence, Minidump Analysis, Software Technical Support, Tools, Training and Seminars, WinDbg Tips and Tricks | 6 Comments »
Friday, October 3rd, 2008
“Everything is memory dump.”
I’m very excited to announce that Volume 2 is available in paperback, hardcover and digital editions:
Memory Dump Analysis Anthology, Volume 2
In one or two weeks paperback edition should also appear on Amazon and other bookstores. Amazon hardcover edition is planned to be available by the end of October.
I’m often asked when Volume 3 is available and I currently plan to release it in October - November, 2009. In the mean time I’m planning to concentrate on other publishing projects.
- Dmitry Vostokov @ DumpAnalysis.org -
Posted in Announcements, Assembly Language, Books, Bugchecks Depicted, CDF Analysis Tips and Tricks, Citrix, Common Mistakes, Crash Dump Analysis, Crash Dump Patterns, Crash Dumps for Dummies, Data Recovery, DebugWare Patterns, Debugging, Fun with Crash Dumps, Kernel Development, Memory Analysis Forensics and Intelligence, Memory Dump Analysis Jobs, Memory Visualization, Minidump Analysis, Music for Debugging, New Words, Philosophy, Publishing, Science of Memory Dump Analysis, Security, Software Architecture, Software Technical Support, Stack Trace Collection, Testing, Tools, Training and Seminars, Troubleshooting Methodology, Virtualization, Vista, WinDbg Scripts, WinDbg Tips and Tricks, WinDbg for GDB Users, Windows Server 2008 | No Comments »
Wednesday, September 24th, 2008
Finally Dr. Debugalov adventures are going to be imprinted with bugs inside. This full-color book features never published before cartoons and a few surprises. It sets a new standard for entertainment in software engineering.
- Title: Dumps, Bugs and Debugging Forensics: The Adventures of Dr. Debugalov
- Author: Narasimha Vedala
- Editor: Dmitry Vostokov
- Publisher: Opentask (1 December 2008)
- Language: English
- Product Dimensions: 21.6 x 14.0
- ISBN-13: 978-1-906717-25-4
- Paperback: 64 pages
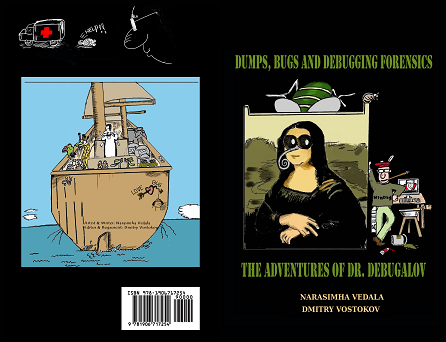
The cover was designed by Narasimha Vedala.
- Dmitry Vostokov @ DumpAnalysis.org -
Posted in Announcements, Art, Books, Bugtations, Cartoons, Crash Dump Analysis, Debugging, Fun with Crash Dumps, Memory Analysis Forensics and Intelligence, Publishing | No Comments »
Sunday, August 10th, 2008
This is a new word I’ve just coined to describe applications heavily dependent on various hooks that are either injected by normal Windows hooking mechanism, registry or via more elaborate tricks like remote threads or patching code. Originally I thought of hookware but found that this term is already in use for completely different purpose.
Now I list various patterns in memory dumps that help in detection, troubleshooting and debugging of hooksware:
- Hooked Functions (user space)
- Hooked Functions (kernel space)
- Hooking Level
This is the primary detection mechanism for hooks that patch code.
See also Raw Pointer and Out-of-Module Pointer patterns.
- Hooked Modules
The WinDbg script to run when you don’t know which module was patched.
- Changed Environment
Loaded hooks shift other DLLs by changing their load address and therefore might expose dormant bugs.
- Insufficient Memory (module fragmentation)
Hooks loaded in the middle of address space limit the maximum amount of memory that can be allocated at once. For example, various virtual machines, like Java, reserve the big chunk of memory at the start up.
- No Component Symbols
We can get an approximate picture of what a 3rd-party hook module does by looking at its import table or in the case of patching by looking at the list of deviations returned by .chkimg command.
- Unknown Component
Might give an idea about the author of the hook.
- Coincidental Symbolic Information
Sometimes hooks are loaded at round addresses like 0×10000000 and these values are very frequently used as flags or constants too.
- Wild Code
When hooking goes wrong the execution path goes into the wild territory.
- Execution Residue
Here we can find various hooks that use normal Windows hooking mechanism. Sometimes the search for “hook” word in symbolic raw stack output of dds command reveals them but beware of Coincidental Symbolic Information. See also Raw Stack Analysis Scripts page.
- Message Hooks - Modeling Example
Windows message hooking pattern example.
- Hidden Module
Some hooks may hide themselves.
- Dmitry Vostokov @ DumpAnalysis.org + TraceAnalysis.org -
Posted in Announcements, CDA Pattern Classification, Crash Dump Analysis, Crash Dump Patterns, Debugging, Malware Analysis, Malware Patterns, Memory Analysis Forensics and Intelligence, New Words, WinDbg Scripts, WinDbg Tips and Tricks | 2 Comments »
Thursday, August 7th, 2008
Sometimes we look for modules that were loaded and unloaded at some time. lm command lists unloaded modules but some of them could be mapped to address space without using runtime loader. The latter case is common for drm-type protection tools, rootkits, malware or crimeware which can influence a process execution. In such cases we can hope that they still remain in virtual memory and search for them. WinDbg .imgscan command greatly helps in identifying MZ/PE module headers. The following example just illustrates this command without implying that the found module did any harm:
0:000> .imgscan

MZ at 000d0000, prot 00000002, type 01000000 - size 6000

  Name: usrxcptn.dll

MZ at 00350000, prot 00000002, type 01000000 - size 9b000

  Name: ADVAPI32.dll

MZ at 00400000, prot 00000002, type 01000000 - size 23000

  Name: javaw.exe

MZ at 01df0000, prot 00000002, type 01000000 - size 8b000

  Name: OLEAUT32.dll

MZ at 01e80000, prot 00000002, type 01000000 - size 52000

  Name: SHLWAPI.dll

[…]
We don’t see usrxcptn in either loaded or unloaded module lists:
0:002> lm

start    end        module name

00350000 003eb000   advapi32

00400000 00423000   javaw

01df0000 01e7b000   oleaut32

01e80000 01ed2000   shlwapi

[...]
Unloaded modules:
This is why I call this pattern Hidden Module. We can use Unknown Component pattern to see the module resources if present in memory:
0:002> !dh 000d0000
[...]
SECTION HEADER #4

   .rsrc name

     418 virtual size

    4000 virtual address

     600 size of raw data

    1600 file pointer to raw data

       0 file pointer to relocation table

       0 file pointer to line numbers

       0 number of relocations

       0 number of line numbers

40000040 flags

         Initialized Data

         (no align specified)

         Read Only
[...]
0:002> dc 000d0000+4000 L418

[…]

000d4140  […] n…z.)…F.i.l.

000d4150  […] e.D.e.s.c.r.i.p.

000d4160  […] t.i.o.n…..U.s.

000d4170  […]   e.r. .D.u.m.p. .

000d4180  […] U.s.e.r. .M.o.d.

000d4190  […] e. .E.x.c.e.p.t.

000d41a0  […] i.o.n. .D.i.s.p.

000d41b0  […] a.t.c.h.e.r…..
0:002> du 000d416C

000d416c  "User Dump User Mode Exception Di"

000d41ac  "spatcher"
This component seems to be loaded or mapped only if userdump package was fully installed where usrxcptn.dll is a part of its redistribution. Although from the memory dump comment we also see that the dump was taken manually using command line userdump.exe we see that the full userdump package was additionally installed which was probably not necessary (see Correcting Microsoft article about userdump.exe):
Loading Dump File [javaw.dmp]

User Mini Dump File with Full Memory: Only application data is available
Comment: 'Userdump generated complete user-mode minidump with Standalone function on COMPUTER-NAME'
- Dmitry Vostokov @ DumpAnalysis.org -
Posted in Crash Dump Analysis, Crash Dump Patterns, Debugging, Malware Analysis, Memory Analysis Forensics and Intelligence, Security, WinDbg Tips and Tricks | 8 Comments »
Thursday, June 26th, 2008
In July-August Opentask publisher plans to have its own website. In the mean time here is the additional list of books to be published in the next 5-7 years starting from 2009 onwards:
- Memiotics (ISBN-13: 978-1906717087)
- Voice Recognition: Command and Control (ISBN-13: 978-1906717094)
- Memory Analysis: An Interdisciplinary Approach (ISBN-13: 978-1906717117)
- Deep Down C++ (ISBN-13: 978-1906717124)
- Management Bits: An Anthology from Reductionist Manager (ISBN-13: 978-1906717131)
- Classical, Quantum and Nonlinear Memoretics (ISBN-13: 978-1906717186)
- Crash Dump: A Software Engineering Autobiography (ISBN-13: 978-1906717193)
- Memoidealism: A New Kind of Philosophy (ISBN-13: 978-1906717209)
including 10-volume edition of Software Engineering Notebooks:
- Software Engineering Notebooks, Volume 1 (ISBN-13: 978-1906717148)
Details will be announced later on the publisher’s website.
Note: the book about voice recognition stands apart from the others. This is actually the title of the first book I wanted to write 5 years ago.
- Dmitry Vostokov @ DumpAnalysis.org -
Posted in Announcements, Books, Crash Dump Analysis, Debugging, Management Bits and Tips, Memory Analysis Forensics and Intelligence, Philosophy, Publishing, Science of Memory Dump Analysis | No Comments »
Wednesday, June 25th, 2008
I’m thinking big for a full-color book to celebrate the forthcoming anniversary of Memory Dump Analysis Anthology. Preliminary details:
- Title: Encyclopedia of Crash Dump Analysis Patterns
- Author: Dmitry Vostokov
- Publisher: Opentask (15 April 2009)
- Language: English
- Product Dimensions: 21.6 x 14.0
- ISBN-13: 978-1-906717-21-6
- Paperback: 400 pages
- Dmitry Vostokov @ DumpAnalysis.org -
Posted in Announcements, Books, Crash Dump Analysis, Crash Dump Patterns, Debugging, Memory Analysis Forensics and Intelligence, Minidump Analysis, Publishing, Science of Memory Dump Analysis, Software Technical Support, Tools, Troubleshooting Methodology, Vista, Windows Server 2008 | No Comments »