Archive for the ‘Memoretics’ Category
Friday, October 22nd, 2010
I detour for MARS expedition. You may also call it Memory Analysis Report System as malware analysis is always exploration of memory (in general). Why is this sudden change of course? After reading Gilles Deleuze I want to broaden the concept of “malware” and give it new orientation and direction of thinking. Beside that I also want new challenges after many years of research in pattern-driven memory dump and software trace analysis of abnormal software behaviour.
You may have also noticed small restructuring (rebranding) of this blog and DumpAnalysis.org headers.
See you there 
- Dmitry Vostokov @ DumpAnalysis.org + TraceAnalysis.org -
Posted in Announcements, Archaeology of Computer Memory, Assembly Language, Computer Science, Education and Research, General Memory Analysis, Malware Analysis, Malware Patterns, Memiotics (Memory Semiotics), Memoretics, Memory Analysis Forensics and Intelligence, Memory Analysis Report System, Memory Dump Analysis Services, New Acronyms, Philosophy, Science of Memory Dump Analysis, Science of Software Tracing, Security, Software Trace Analysis, Software Victimology, Structural Memory Patterns, Systems Thinking, Tools, Trace Analysis Patterns, Victimware, Windows System Administration | No Comments »
Wednesday, October 20th, 2010
As a practical example of applying behavioral and structural pattern analysis of computer memory and traces OpenTask plans to publish the following title next year:
- Title: Malware Patterns: Structure and Behavior of Computer Adware, Crimeware, Rootkits, Scareware, Spyware, Trojans, Viruses, Victimware and Worms
- Author: Dmitry Vostokov
- Paperback: 1200 pages
- Publisher: OpenTask (October 2011)
- ISBN-13: 978-1-908043-01-6
The inclusion of victimware is necessary because of the effects of defective malware.
- Dmitry Vostokov @ DumpAnalysis.org + TraceAnalysis.org -
Posted in Announcements, Books, Crash Dump Analysis, Crash Dump Patterns, Malware Analysis, Malware Patterns, Memiotics (Memory Semiotics), Memoretics, Memory Analysis Forensics and Intelligence, Publishing, Science of Memory Dump Analysis, Science of Software Tracing, Security, Software Behavior Patterns, Software Defect Construction, Software Trace Analysis, Software Victimology, Structural Memory Patterns, Trace Analysis Patterns, Victimware | No Comments »
Monday, October 18th, 2010
In order to start the analysis of a structured memory snapshot a debugger engine needs Anchor Region that describes memory layout and where to start unfolding of analysis. For example, it can be a list of modules (another forthcoming structural pattern). We can observe the importance of such regions when we try to open corrupt or severely truncated memory dumps:
[...]

KdDebuggerDataBlock is not present or unreadable.

[...]

Unable to read PsLoadedModuleList

[...]
For certain types of memory snapshots (like software traces) an anchor region coinsides with its structure description (message trace format for structured snapshots) and a trace file header (if any) for aggregate snapshots.
- Dmitry Vostokov @ DumpAnalysis.org + TraceAnalysis.org -
Posted in Crash Dump Analysis, Debugging, Memoretics, Structural Memory Patterns | 2 Comments »
Wednesday, October 13th, 2010
In addition to software narratology we would like to introduce another 2 branches of memoretics (borrowed from “geographical” chorography and chorology), the science of memory snapshots:
Software Chorography
The study and visualization of small memory regions compared to the full memory dumps.
Software Chorology
The spacial equivalent of software narratology where the latter is considered in chronological terms. Studies spatial distribution and causal relations between software behavioral and structural phenomena inside particular memory regions.
To give a perspective where usual software traces and memory dumps reside in terms narrativity and non-narrativity (spatiality) we created this diagram:
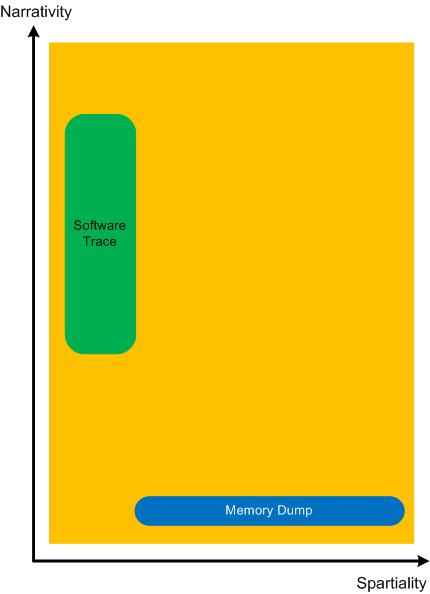
Memory dumps have some extension in the dimension of narrativity because it is possible to get stack traces and other execution residue from them that provide partial fragments of a software narrative.
- Dmitry Vostokov @ DumpAnalysis.org + TraceAnalysis.org -
Posted in Memoretics, Memory Visualization, Software Chorography, Software Chorology, Software Narratology | No Comments »
Wednesday, October 13th, 2010
Another important pattern category is Memory Hierarchy. Typical examples include a complete memory dump with a physical to virtual mapping and paged out memory. Please note that page file is optional and paging can be implemented without a page file. There can be several layers of hierarchy, for example:
- physical memory
- virtualized physical memory
- virtual memory
Another example is from the protected mode x86 architecture:
- physical memory
- linear memory (paging, virtual)
- logical memory (segments)
- Dmitry Vostokov @ DumpAnalysis.org + TraceAnalysis.org -
Posted in Breakfast with Intel, Crash Dump Analysis, Debugging, Memoretics, Structural Memory Patterns | No Comments »
Friday, October 1st, 2010
The next pattern is called Region Boundary. It is an inaccessible range of memory that surrounds Closed Memory Region. For example, the closed region of a kernel stack for the following thread has a one page boundary region next to its Base:
1: kd> !thread

THREAD fffffa8004544b60  Cid 0a6c.0acc  Teb: 000007fffffde000 Win32Thread: fffff900c1eb4010 RUNNING on processor 1

IRP List:

    fffffa8004d7e010: (0006,0118) Flags: 00060000  Mdl: 00000000

Not impersonating

DeviceMap                 fffff8a001e84c00

Owning Process            fffffa8004f68370       Image:         NotMyfault.exe

Attached Process          N/A            Image:         N/A

Wait Start TickCount      40290          Ticks: 0

Context Switch Count      408                 LargeStack

UserTime                  00:00:00.015

KernelTime                00:00:00.015

Win32 Start Address NotMyfault (0x0000000140002708)

Stack Init fffff8800587cdb0 Current fffff8800587c6f0

Base fffff8800587d000 Limit fffff88005874000 Call 0

[…]
1: kd> !pte fffff880`0587d000

                                           VA fffff8800587d000

PXE at FFFFF6FB7DBEDF88    PPE at FFFFF6FB7DBF1000    PDE at FFFFF6FB7E200160    PTE at FFFFF6FC4002C3E8

contains 0000000133D84863  contains 0000000133D83863  contains 00000000AA9AE863  contains 0000000000000000

pfn 133d84    ---DA--KWEV  pfn 133d83    ---DA--KWEV  pfn aa9ae     ---DA--KWEV  not valid
1: kd> !pte fffff880`0587d000+0n4096-1

  VA fffff8800587dfff

PXE at FFFFF6FB7DBEDF88 PPE at FFFFF6FB7DBF1000 PDE at FFFFF6FB7E200160 PTE at FFFFF6FC4002C3E8

contains 0000000133D84863 contains 0000000133D83863 contains 00000000AA9AE863 contains 0000000000000000

pfn 133d84 —DA–KWEV pfn 133d83 —DA–KWEV pfn aa9ae —DA–KWEV not valid
1: kd> !pte fffff880`0587d000+0n4096

                                           VA fffff8800587e000

PXE at FFFFF6FB7DBEDF88    PPE at FFFFF6FB7DBF1000    PDE at FFFFF6FB7E200160    PTE at FFFFF6FC4002C3F0

contains 0000000133D84863  contains 0000000133D83863  contains 00000000AA9AE863  contains 8000000028230963

pfn 133d84    —DA–KWEV  pfn 133d83    —DA–KWEV  pfn aa9ae     —DA–KWEV  pfn 28230     -G-DA–KW-V
The region after boundary belongs to another process thread kernel stack (I use CodeMachine WinDbg extension here):
1: kd> !cmkd.kvas  fffff8800587e000

kvas : Show region containing fffff8800587e000

### Start            End                                  Length Type

006 fffff88000000000 fffff89fffffffff       2000000000 ( 128 GB) SystemPTEs

Thread FFFFFA80053D0B60 [0798.0a5c] Stack fffff88005884000 - fffff8800587e000
1: kd> !thread FFFFFA80053D0B60

THREAD fffffa80053d0b60  Cid 0798.0a5c  Teb: 000007fffffdd000 Win32Thread: 0000000000000000 WAIT: (DelayExecution) UserMode Non-Alertable

    fffffa80053d0f20  Semaphore Limit 0x1

Not impersonating

DeviceMap                 fffff8a001e84c00

Owning Process            fffffa80053ce630       Image:         ApplicationB.exe

Attached Process          N/A            Image:         N/A

Wait Start TickCount      34911          Ticks: 5379 (0:00:01:23.912)

Context Switch Count      22

UserTime                  00:00:00.000

KernelTime                00:00:00.000

Win32 Start Address 0x000000013fe01538

Stack Init fffff88005883db0 Current fffff88005883970

Base fffff88005884000 Limit fffff8800587e000 Call 0

[…]
- Dmitry Vostokov @ DumpAnalysis.org + TraceAnalysis.org -
Posted in Crash Dump Analysis, Debugging, Memoretics, Memory Analysis Forensics and Intelligence, Structural Memory Patterns | No Comments »
Friday, October 1st, 2010
Now we propose the next group of general patterns related to memory regions (the terminology was partially influenced from topology). The first one we call Memory Region, for example:
1: kd> dp fffff88005875000 fffff88005875010

fffff880`05875000  039b5000`6e696268 00000000`00002000

fffff880`05875010  00000000`00000000
There are Open and Closed memory regions. We can extend the former ones in one or both directions:
1: kd> dp fffff88005875000-10 fffff88005875010+10

fffff880`05874ff0  6ab90c4f`039ba1b8 039b8050`fffffff8

fffff880`05875000  039b5000`6e696268 00000000`00002000

fffff880`05875010  00000000`00000000 00000000`00000000

fffff880`05875020  00000294`ffffffd0
The closed regions cannot be read past its boundary, like this kernel stack region [fffff880`05874000 fffff8800587d000):
1: kd> dp fffff88005874000-30

fffff880`05873fd0  ????????`???????? ????????`????????

fffff880`05873fe0  ????????`???????? ????????`????????

fffff880`05873ff0  ????????`???????? ????????`????????

fffff880`05874000  039ba000`6e696268 00000000`00001000

fffff880`05874010  00000000`00000000 00000000`00000000

fffff880`05874020  00206b6e`ffffffa8 01cae7bd`b8aca323

fffff880`05874030  039b6698`00000000 00000000`00000001

fffff880`05874040  ffffffff`039bafe8 039b6710`00000004
1: kd> dp fffff8800587d000-30

fffff880`0587cfd0  00000000`00000000 00000000`00000000

fffff880`0587cfe0  00000000`00000000 00000000`00000000

fffff880`0587cff0  00000000`00000000 00000000`00000000

fffff880`0587d000  ????????`???????? ????????`????????

fffff880`0587d010  ????????`???????? ????????`????????

fffff880`0587d020  ????????`???????? ????????`????????

fffff880`0587d030  ????????`???????? ????????`????????

fffff880`0587d040  ????????`???????? ????????`????????
- Dmitry Vostokov @ DumpAnalysis.org + TraceAnalysis.org -
Posted in Crash Dump Analysis, Debugging, Mathematics of Debugging, Memoretics, Memory Analysis Forensics and Intelligence, Structural Memory Patterns | 1 Comment »
Monday, September 27th, 2010
General Memory Analysis is another name for Memoretics, a discipline that studies memory snapshots including their similarities and differences on different system platforms such as Windows, Linus, Mac OS X, embedded and mobile systems, historical architectures, etc. The analysis of memory helps solve problems in various domains such as software troubleshooting and debugging, computer forensic analysis, etc.
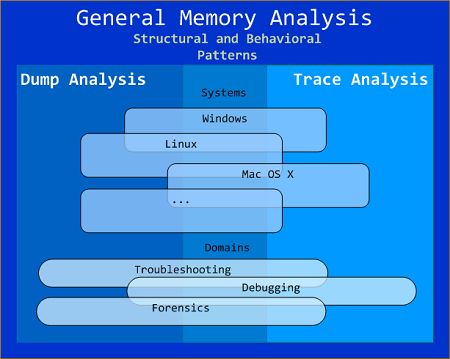
The current focus of interdisciplinary research is to build a unified memory pattern language that covers both behavioral and structural patterns and also to study the possibility of building memory systems from below, not from requirements -> architecture -> design -> implementation -> compilation -> linking -> loading -> execution but from directly modeling and assembling memory systems using memory patterns.
- Dmitry Vostokov @ DumpAnalysis.org + TraceAnalysis.org -
Posted in Announcements, Crash Dump Analysis, Debugging, General Memory Analysis, Memiotics (Memory Semiotics), Memoretics, Memory Analysis Forensics and Intelligence, Memory Systems Language, Security, Software Behavior Patterns, Software Technical Support, Software Trace Analysis, Structural Memory Patterns, Trace Analysis Patterns | No Comments »
Sunday, September 26th, 2010
The next pattern is called Snapshot Collection. This is a collection of files combined from either linear memory snapshots or aggregate snapshots saved as separate files at different times. Typical examples include:
- Several process memory dump files saved sequentially from a growing heap leaking process
- Several software traces from working and non-working scenarios for comparative analysis
- Dmitry Vostokov @ DumpAnalysis.org + TraceAnalysis.org -
Posted in Crash Dump Analysis, Debugging, Memoretics, Memory Analysis Forensics and Intelligence, Structural Memory Patterns | No Comments »
Sunday, September 26th, 2010
The next pattern is called Aggregate Snapshot. It is any memory dump or software trace file that is combined from Memory Snapshots. Typical examples include:
- A minidump file where only specific memory ranges are included
- A software trace file combined from structured memory snapshots
Note. I’ve also created a dedicated page to list all structural patterns:
Structural Memory Analysis Patterns
- Dmitry Vostokov @ DumpAnalysis.org + TraceAnalysis.org -
Posted in Crash Dump Analysis, Debugging, Memoretics, Memory Analysis Forensics and Intelligence, Structural Memory Patterns | 1 Comment »
Friday, September 24th, 2010
Now it’s time to divide memory analysis patterns discerned so far as mostly abnormal software behavior memory dump and software trace patterns into behavioral and structural catalogues. The goal is to account for normal system-independent structural entities and relationships visible in memory like modules, threads, processes and so on.
The first pattern (and also a super-pattern) we discuss in this part is called Memory Snapshot. It is further subdivided into Structured Memory Snapshot and BLOB Memory Snapshot. Structured sub-pattern includes:
- Contiguous memory dump files with artificially generated headers (for example, physical or process virtual space memory dump)
- Software trace messages with imposed internal structure
BLOB sub-pattern variety includes address range snapshots without any externally imposed structure, for example, saved by .writemem WinDbg command or ReadProcessMemory API and contiguous buffer and raw memory dumps saved by various memory acquisition tools.
Behavioral patterns that relate to Memory Snapshot pattern are:
I strive initially to publish at least one such pattern every day to fill the gap of normal patterns in memory analysis and later add more multi-platform details and examples from other platforms like Linux, Mac OS X, embedded and selected important historical architectures.
- Dmitry Vostokov @ DumpAnalysis.org + TraceAnalysis.org -
Posted in Crash Dump Analysis, Crash Dump Patterns, Debugging, General Memory Analysis, Memiotics (Memory Semiotics), Memoretics, Memory Analysis Forensics and Intelligence, Memory Systems Language, Science of Memory Dump Analysis, Science of Software Tracing, Security, Software Behavior Patterns, Software Trace Analysis, Structural Memory Patterns | 1 Comment »
Thursday, September 23rd, 2010
When I was a child I experienced dreams where I was carried by a huge wave that was transforming to a torus completely absorbing me up to a breakpoint of my wake up. A year ago I got the book Memory Evolutive Systems because of my interest in applying category theory to memory analysis and debugging and immediately recalled my long-time forgotten childhood dreams while staring at its front cover:

- Dmitry Vostokov @ DumpAnalysis.org + TraceAnalysis.org -
Posted in Books, Categorical Debugging, History, Mathematics, Memoretics, Memory Dreams, Memory Visualization, Science of Memory Dump Analysis | No Comments »
Monday, September 20th, 2010
There many interpretations of the letter M in M-theory but I propose another one: M stands for Memory. In any outcome it surely will be committed to memory in the future either as successful or not. On the other hand I’m now trying to make sense of it in relation to Memory as an ur-foundation (ur-, primordial, German prefix).
- Dmitry Vostokov @ DumpAnalysis.org + TraceAnalysis.org -
Posted in Fun with Crash Dumps, Memoidealism, Memoretics, Memuonics, New Acronyms, New Words, Philosophy, Physics | No Comments »
Wednesday, August 11th, 2010
There are many different approaches to illustrate virtual to physical memory mapping on systems with paging like Windows. Here is another approach that uses natural memory visualization. An image of a user process was generated and juxtaposed to an image of kernel memory dump generated afterwards to produce the combined picture of the full virtual space. Of course, uncommited regions were not included in it as they were not present in user and kernel dumps. Then, after reboot, the same application was launched again and an image of a complete memory dump was generated. Finally, both images were juxtaposed to produce this approximate picture:
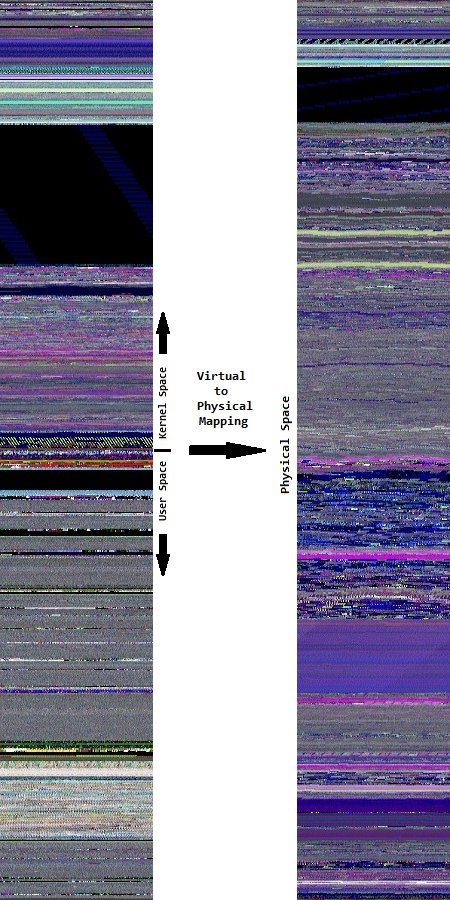
In the virtual memory space to the left we see much more granularity. On the contrary, the physical memory space to the right is more uniform and has a different coloring.
- Dmitry Vostokov @ DumpAnalysis.org + TraceAnalysis.org -
Posted in Computer Science, Fun with Crash Dumps, Memoretics, Memory Diagrams, Memory Space Art, Memory Visualization, Science of Memory Dump Analysis, Training and Seminars | No Comments »
Monday, May 10th, 2010
My drive to generalization led me to place an adornment on the portal to highlight the fact that memory and software trace analysis patterns are under an umbrella of general software behaviour patterns:
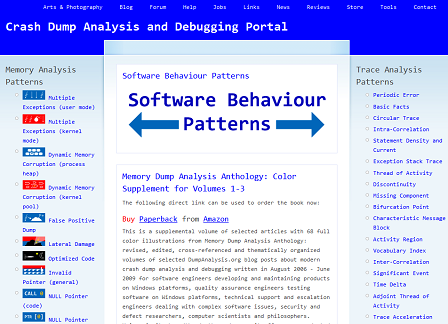
http://www.dumpanalysis.org/Software-Behavior-Patterns-Headline
In the forthcoming post series I plan to write about similarities between these two branches and also provide pattern examples from non-Windows platforms. All this material will provide the foundation for the forthcoming book Software Behavior: A Guide to Systematic Analysis (ISBN: 978-1906717162).
- Dmitry Vostokov @ DumpAnalysis.org + TraceAnalysis.org -
Posted in Announcements, Computer Science, Crash Dump Analysis, Crash Dump Patterns, Debugging, Escalation Engineering, Memiotics (Memory Semiotics), Memoretics, Science of Memory Dump Analysis, Science of Software Tracing, Software Behavior Patterns, Software Engineering, Software Maintenance Institute, Software Technical Support, Software Trace Analysis, Software Troubleshooting Patterns, Trace Analysis Patterns | No Comments »
Thursday, April 22nd, 2010
I’ve decided to adapt archaeological classificatory framework (using my favourite method of inquiry: metaphorical bijectionism) to lay out foundations for yet another attempt to classify DA+TA patterns):
Attribute  ↔ Pattern

Artefact   ↔ Component Artefact1

Assemblage ↔ Component Assemblage

Culture    ↔ Memory System Culture
2

1 Can be either a component-generated artefact or a component like a module or symbol file
2 Typical examples of memory system cultures are Windows, UNIX or even “Multiplatform”
I propose a word Memoarchaeological for such a framework and Memoarchaeology for a branch of Memoretics that studies saved computer memory artifacts from past computations (as opposed to live memory).
Note: In one of the forthcoming issues of Debugged! MZ/PE magazine there will be presented yet another classificatory scheme.
- Dmitry Vostokov @ DumpAnalysis.org + TraceAnalysis.org -
Posted in Announcements, Archaeology of Computer Memory, CDA Pattern Classification, Crash Dump Analysis, Crash Dump Patterns, Debugging, Memoretics, Memory Analysis Forensics and Intelligence, New Words, Science of Memory Dump Analysis, Science of Software Tracing, Software Behavior Patterns, Software Trace Analysis, Trace Analysis Patterns | No Comments »
Sunday, April 18th, 2010
OpenTask to offer first 3 volumes of Memory Dump Analysis Anthology in one set:


The set is available exclusively from OpenTask e-Commerce web site starting from June. Individual volumes are also available from Amazon, Barnes & Noble and other bookstores worldwide.
Product information:
- Title: Modern Memory Dump and Software Trace Analysis: Volumes 1-3
- Author: Dmitry Vostokov
- Language: English
- Product Dimensions: 22.86 x 15.24
- Paperback: 1600 pages
- Publisher: Opentask (31 May 2010)
- ISBN-13: 978-1-906717-99-5
Information about individual volumes:
- Dmitry Vostokov @ DumpAnalysis.org + TraceAnalysis.org -
Posted in .NET Debugging, Aesthetics of Memory Dumps, Announcements, AntiPatterns, Art, Assembly Language, Books, Bugchecks Depicted, C and C++, CDA Pattern Classification, CDF Analysis Tips and Tricks, Categorical Debugging, Certification, Citrix, Code Reading, Common Mistakes, Computational Ghosts and Bug Hauntings, Computer Science, Countefactual Debugging, Crash Analysis Report Environment (CARE), Crash Dump Analysis, Crash Dump Patterns, Crash Dumps for Dummies, Data Recovery, DebugWare Patterns, Debugging, Debugging Methodology, Debugging Slang, Deep Down C++, Dictionary of Debugging, Dr. Watson, Education and Research, Escalation Engineering, Fun with Crash Dumps, Futuristic Memory Dump Analysis, GDB for WinDbg Users, Hardware, History, Horrors of Computation, Hyper-V, Intelligent Memory Movement, Kernel Development, Laws of Troubleshooting and Debugging, Mathematics of Debugging, Memiotics (Memory Semiotics), Memoidealism, Memoretics, Memory Analysis Culture, Memory Analysis Forensics and Intelligence, Memory Auralization, Memory Dump Analysis Jobs, Memory Religion (Memorianity), Memory Space Art, Memory Space Music, Memory Systems Language, Memory Visualization, Memuonics, Minidump Analysis, Multithreading, Music for Debugging, Music of Computation, New Acronyms, New Words, Occult Debugging, Philosophy, Psi-computation, Publishing, Science of Memory Dump Analysis, Science of Software Tracing, Security, Software Architecture, Software Defect Construction, Software Engineering, Software Generalist, Software Maintenance Institute, Software Narratology, Software Technical Support, Software Trace Analysis, Software Trace Visualization, Software Tracing for Dummies, Software Victimology, Stack Trace Collection, Testing, Tools, Trace Analysis Patterns, Training and Seminars, Troubleshooting Methodology, Victimware, Virtualization, Vista, Visual Dump Analysis, WinDbg Scripts, WinDbg Tips and Tricks, WinDbg for GDB Users, Windows 7, Windows Server 2008, Windows System Administration | No Comments »
Monday, April 5th, 2010
I’m very pleased to announce that the Korean edition is available:

The book can be found on:
- Dmitry Vostokov @ DumpAnalysis.org + TraceAnalysis.org -
Posted in Announcements, AntiPatterns, Assembly Language, Books, Books (Korean), C and C++, Computer Science, Crash Dump Analysis, Crash Dump Patterns, Crash Dumps for Dummies, Debugging, Dr. Watson, Escalation Engineering, Fun with Crash Dumps, GDB for WinDbg Users, Hardware, Kernel Development, Mathematics of Debugging, Memiotics (Memory Semiotics), Memoretics, Memory Space Music, Memory Visualization, Minidump Analysis, Multithreading, Publishing, Science of Memory Dump Analysis, Security, Software Architecture, Software Engineering, Software Technical Support, Testing, Tools, Troubleshooting Methodology, Virtualization, Vista, WinDbg Scripts, WinDbg Tips and Tricks, WinDbg for GDB Users, Windows Server 2008, Windows System Administration | No Comments »
Monday, March 22nd, 2010
Let’s now introduce collective pointers or pointer cones. Suppose we have a set of pointers pointing to fields of some memory structure. This set of pointers could be another structure as well or just a collection of pointers that can be logically brought together:
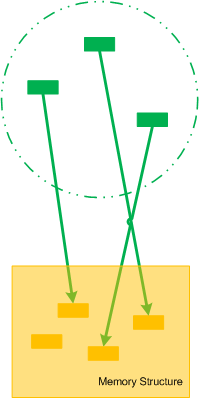
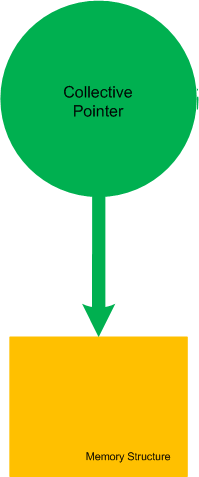
If we make the boundary opaque we can name such set of pointers as Collective Pointer (or Pointer Cone):
Another example is when we split the perception field of a pointer into disjoint collective pointers (the perception field as a whole is already a trivial collective pointer):

- Dmitry Vostokov @ DumpAnalysis.org + TraceAnalysis.org -
Posted in Categorical Debugging, Mathematics of Debugging, Memoretics, Science of Memory Dump Analysis | No Comments »
Saturday, February 27th, 2010
This post was motivated during my work on a memory dump differing tool called DumpLogic that can do logical and arithmetic operations between memory snapshots, for example, take a difference between them for further visualization. This tool is forthcoming next week and it resulted in another simple tool called DumpFilter. The latter allows to filter certain unsigned integer (DWORD) values from a memory dump (or any binary file) by replacing them with 0xFFFFFFFF and all other values with 0×00000000. The resultant binary file can be visualized by any data visualization package or transformed to a bitmap file using Dump2Picture to see distribution of filtered values.
As a filtering example I used TestDefaultDebugger64 to generate a process user memory dump. It was converted to a BMP file by Dump2Picture:
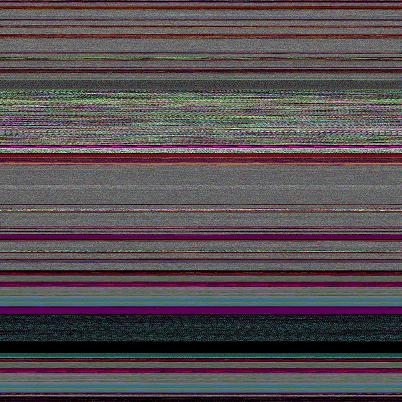
Then I filtered only AV exception code 0xc0000005:
C:\>DumpFilter tdd64.dmp tdd64.bin <dwords.txt
dwords.txt just contained one line
c0000005
It is possible to filter many values. Just put more lines to dwords.txt file. tdd64.bin was converted to tdd64.bmp by Dump2Picture:
C:\>Dump2Picture tdd64.bin tdd64.bmp
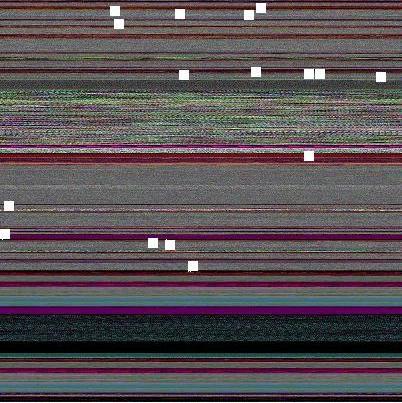
Because the image had only black and while RGBA colors I saved it as a B/W bitmap (click to enlarge, it is a 3236×3236 1.3Mb bitmap):

Every EV exception code is a white dot there but it is difficult to see them unless magnified. So I enlarged them manually on the following map:
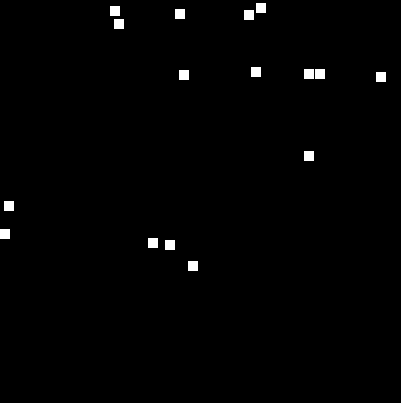
I put them on the original image too. We can see that exception processing spans many areas:
The tool and the sample dwords.txt file (for c0000005 and 80000003) can be downloaded from this location:
Download DumpFilter
Another example: Night Sky memory space art image is just a fragment after filtering all 1 values from another process memory dump.
- Dmitry Vostokov @ DumpAnalysis.org + TraceAnalysis.org -
Posted in Crash Dump Analysis, Crash Dump Patterns, Fun with Crash Dumps, Memoretics, Memory Visualization, Science of Memory Dump Analysis, Tools | No Comments »