Archive for the ‘Log Analysis’ Category
Thursday, May 18th, 2017
A typical software trace or log (for example, from Process Monitor) lists messages from several processes and threads sequentially. However, such columns may be split into individual process ID or thread ID columns. The same can be done for any Adjoint Thread and illustrated in the following diagram:
We call this analysis pattern Combed Trace by analogy with multibraiding.
- Dmitry Vostokov @ DumpAnalysis.org + TraceAnalysis.org -
Posted in Log Analysis, Software Trace Analysis, Software Trace Visualization, Trace Analysis Patterns | No Comments »
Wednesday, May 17th, 2017
In order to perform Inter-Correlational analysis among traces and logs especially when we have Indexical Trace we need a dual operation: an ability to identify traces and Use Case Trails, and, if necessary, find their corresponding Braids of Activity in an index trace. Some data from the tracing domain or use case description may serve is Intrinsic ID. It can be itself some numeric ID, user or computer name.
A typical log analysis case from a distributed environment is illustrated on the following diagram:
- Dmitry Vostokov @ DumpAnalysis.org + TraceAnalysis.org -
Posted in CDF Analysis Tips and Tricks, Log Analysis, Software Trace Analysis Tips and Tricks, Software Trace Reading, Trace Analysis Patterns | No Comments »
Wednesday, May 3rd, 2017
Often, for Inter-Correlational trace and log analysis, we need to make sure that we have synchronized traces. The one version of Unsynchronized Traces analysis pattern is depicted in the following diagram where one trace ends (possibly Truncated Trace) before the start of another trace and both were traced within one hour:
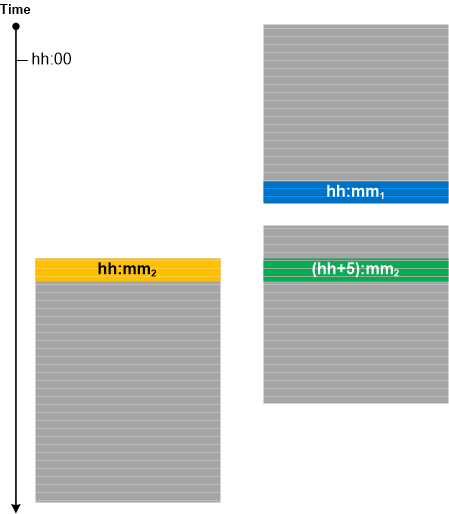
If tracing was done in different time zones with different local times specified in logs we can determine whether the traces are synchronized (when time zone information is not available in Basic Facts) by looking at minutes as shown for the third trace in the diagram above. This technique can also be used in trace calibration (see Calibrating Trace).
There is a similar analysis pattern for memory analysis called Unsynchronized Dumps.
- Dmitry Vostokov @ DumpAnalysis.org + TraceAnalysis.org -
Posted in CDF Analysis Tips and Tricks, Core Dump Analysis, Crash Dump Analysis, Crash Dump Patterns, Log Analysis, Software Trace Analysis, Software Trace Analysis Tips and Tricks, Software Trace Reading, Trace Analysis Patterns | No Comments »
Saturday, April 29th, 2017
The idea of Tensor Trace analysis pattern initially appeared in the context of memory dumps as general traces with several special traces inside but then developed further when working on Singleton Trace analysis pattern when we realized that several Singleton Traces may form a new separate log:

Therefore, we may combine several traces and logs into one global trace where each message references separate local traces and logs:

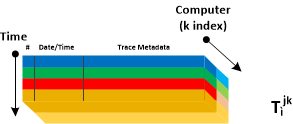
Typical example is a repeated tracing. Each trace has an i-th index spanning the number of trace messages. We say it is has Ti components. Each individual logging has an j-th index and overall global log has Tj components. Together the form the second rank tensor:
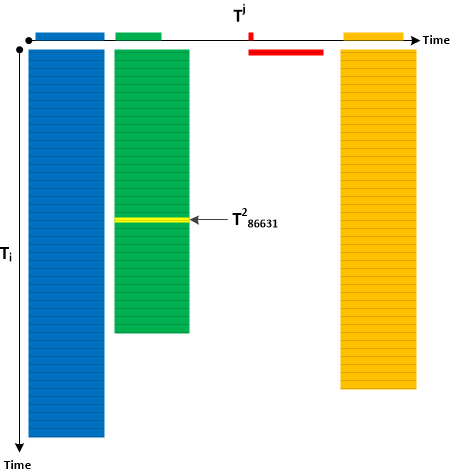
There can be Tensor Traces of the higher rank, for example, the 3rd component spanning computers:
This analysis pattern is different from Meta Trace where the latter is about trace evolution during software development. It is also different from Trace Dimension which is about one trace (Tensor Trace of rank 1).
- Dmitry Vostokov @ DumpAnalysis.org + TraceAnalysis.org -
Posted in Global Trace Analysis, Log Analysis, Software Trace Analysis, Trace Analysis Patterns | No Comments »
Saturday, April 29th, 2017
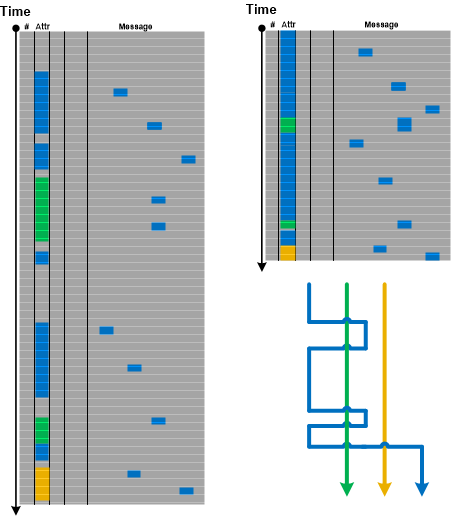
If we consider a log as a text, ignore its column structure, and do search for the particular attribute value (for example, PID) we get Message Set consisting of messages having that attribute value as column (Adjoint Thread of Activity) and messages having that attribute value referenced in their message text. We call this pattern Braid of Activity because metaphorically it looks like Adjoint Threads of Activity cross each other (like multibraiding):
- Dmitry Vostokov @ DumpAnalysis.org + TraceAnalysis.org -
Posted in Log Analysis, Software Trace Analysis, Software Trace Reading, Trace Analysis Patterns | No Comments »
Wednesday, April 19th, 2017
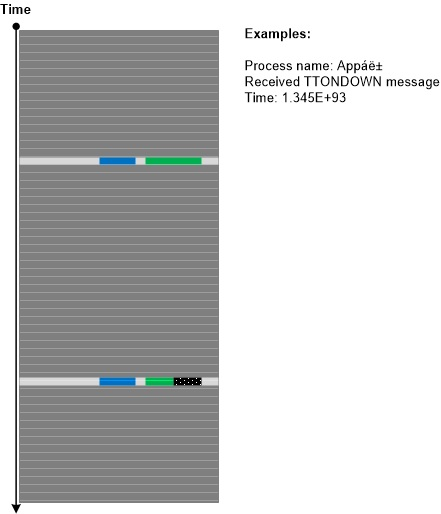
Status updates, error message boxes, and even abort errors can all be considered as examples of software traces and logs. We call such a log with one message only Singleton Trace. Please don’t confuse it with Singleton Event analysis pattern which is trivial for Singleton Traces. We illustrate this pattern with this picture of error message (in Russian it means “The machine doesn’t work. Code: SB”) from a lemonade-dispensing machine:
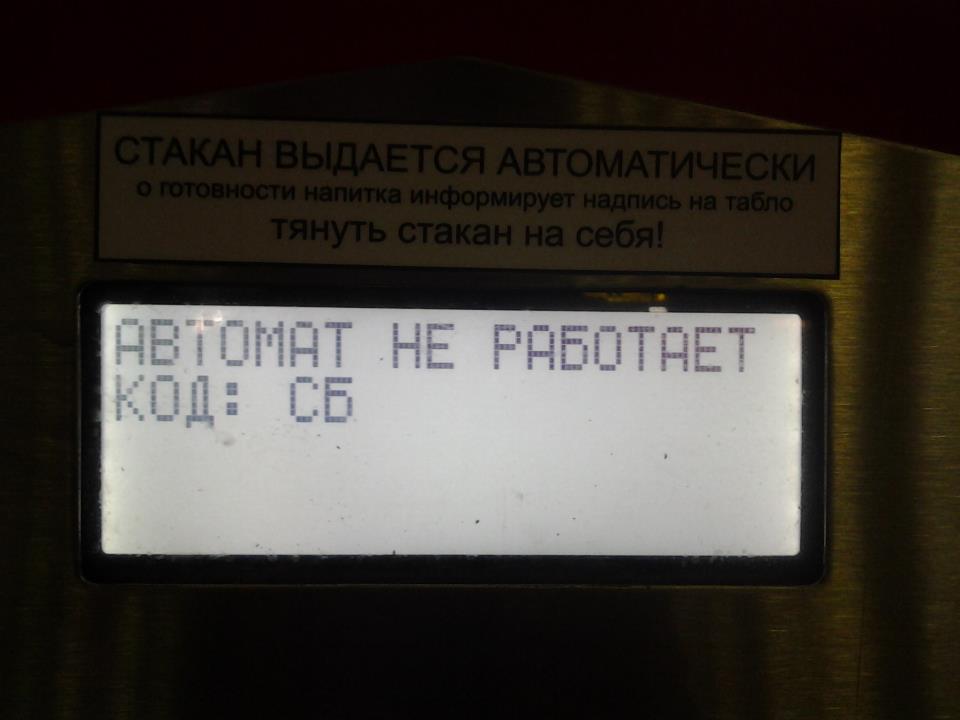
The message in such a trace may contain the associated stack trace as a trivial example of Fiber Bundle.
- Dmitry Vostokov @ DumpAnalysis.org + TraceAnalysis.org -
Posted in Log Analysis, Software Trace Analysis, Trace Analysis Patterns | No Comments »
Tuesday, April 18th, 2017
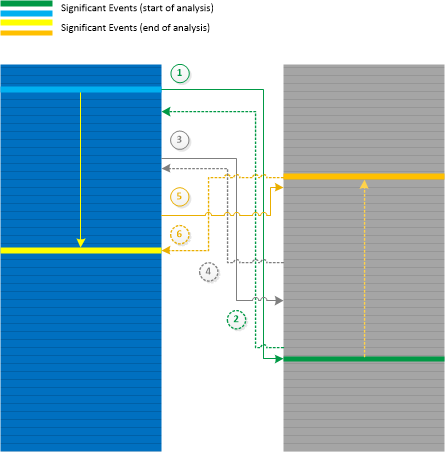
When doing Inter-Correlational analysis between different traces and logs we can move simultaneously along time direction or backwards (Back Tracing). In some cases we may start our analysis with the identification of Significant Events in both logs and then move in opposite directions finding another pair of messages that can be useful for diagnostic identification. We call this analysis pattern Galois Trace by analogy with Galois connection in mathematics. In our case moving from trace A to trace B and back corresponds to F and G functions with a and b as individual trace messages or their Message Contexts (as per monotone definition). The analysis pattern is illustrated in the following diagram:
- Dmitry Vostokov @ DumpAnalysis.org + TraceAnalysis.org -
Posted in Log Analysis, Software Trace Analysis, Trace Analysis Patterns | No Comments »
Sunday, April 2nd, 2017
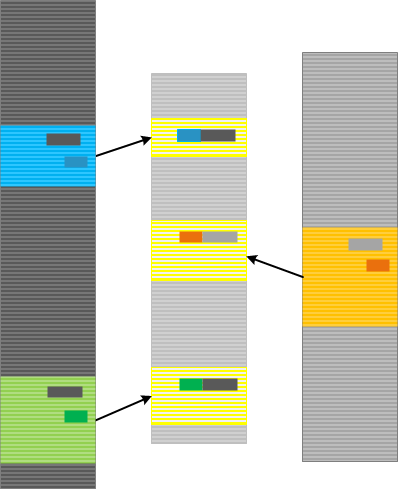
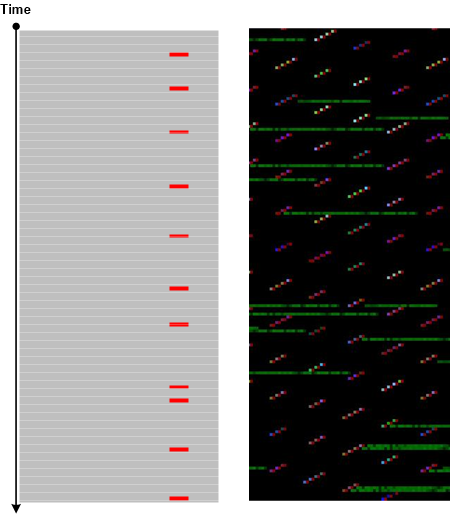
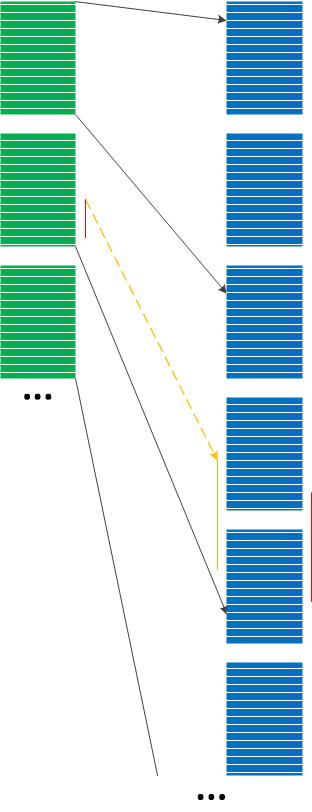
We can apply Message Set trace and log analysis pattern to itself and build multilevel Message Directory. The pattern name come from the analogy with memory management page tables, where we can select every 10th message to build a smaller Message Set, and then select every 10th message from it to build another Message Set, and so on. When looking at a higher level Message Set we can select a trace message and then look at its Message Context in the lower level Message Sets:
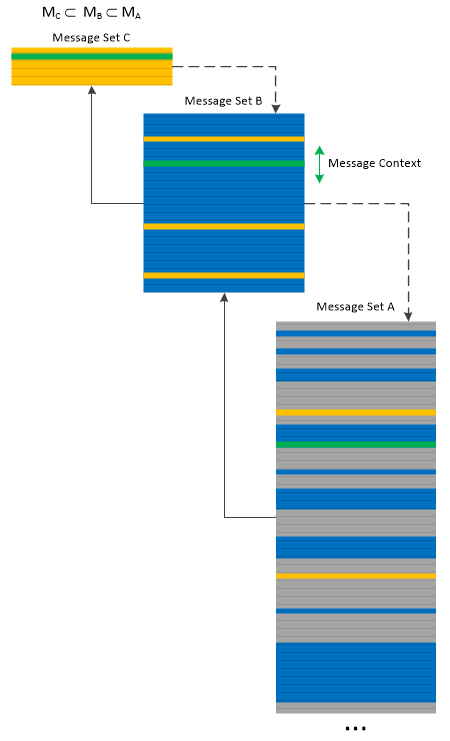
Message Directory is similar to Trace Frames analysis pattern but is fine-grained, and more individual message oriented than the latter analysis pattern. However, the former pattern can be used to implement the latter one.
- Dmitry Vostokov @ DumpAnalysis.org + TraceAnalysis.org -
Posted in Log Analysis, Software Trace Analysis, Software Trace Reading, Trace Analysis Patterns | No Comments »
Friday, March 24th, 2017
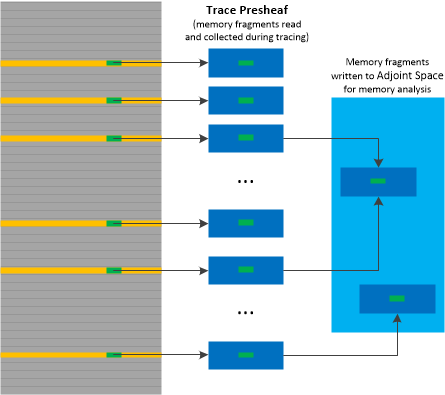
Adjoint Space and Trace Fibration analysis patterns may be useful in cases where complementing traces with memory dumps and vice versa provides better insight into software behavior. Ideally, every trace statement should have Adjoint Space but this is not feasible practically. The solution is to save memory regions surrounding trace message data, for example, structures referenced by pointers. This can be done either for each message or for selected Message Sets. Such memory data can be embedded inside logs as State Dump, Trace Extension or Inter-Correlation with a binary log of such memory fragments. This looks like a mapping between trace messages and memory objects. We call this analysis pattern Trace Presheaf by analogy with presheaves in mathematics. In case Adjoint Spaces are available (for example, memory dumps) such memory buffers can be written to memory by a debugger (in Windows by .readmem WinDbg command) and examined in association with the rest of Adjoint Space. This is illustrated in the following diagram:
- Dmitry Vostokov @ DumpAnalysis.org + TraceAnalysis.org -
Posted in Core Dump Analysis, Crash Dump Analysis, Crash Dump Patterns, Debugging, Log Analysis, Software Trace Analysis, Trace Analysis Patterns | No Comments »
Wednesday, March 22nd, 2017
The dual analysis technique to Adjoint Spaces trace and log analysis pattern is called Memory Fibration (by analogy with fibrations in mathematics). Certain process spaces may have associated external logs so the dynamics of memory can be examined backwards. Such traces and logs may be the parts of just one bigger log as Adjoint Threads of Activity with their PIDs as ATIDs.

- Dmitry Vostokov @ DumpAnalysis.org + TraceAnalysis.org -
Posted in Crash Dump Analysis, Crash Dump Patterns, Log Analysis, Software Trace Analysis, Trace Analysis Patterns | No Comments »
Tuesday, February 21st, 2017
Having chosen a trace message, we are interested in its Message Context which can span all “continuous” messages before and after from the same Thread of Activity. We it Activity Quantum which is variable and independent from the so-called CPU quantums. Different messages from Activity Quantum may be executed on different CPUs. The following diagram depicts this analysis pattern:
- Dmitry Vostokov @ DumpAnalysis.org + TraceAnalysis.org -
Posted in Log Analysis, Software Trace Analysis, Trace Analysis Patterns | No Comments »
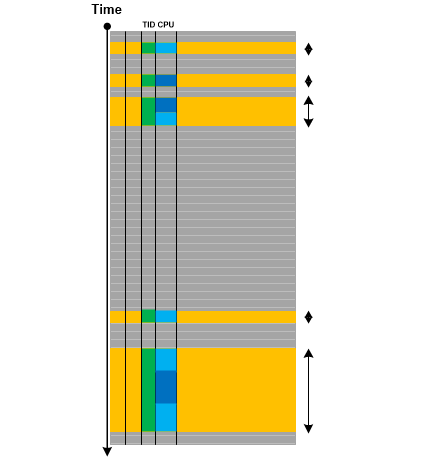
Wednesday, February 15th, 2017
Here we introduce Delay Dynamics analysis pattern. It is not an oxymoron and dynamics is referred to by what actually happens during the delay (Discontinuity with Time Delta) in other Threads of Activity as depicted in the following diagram:
Instead of threads various Adjoint Threads of Activity may also be inspected.
- Dmitry Vostokov @ DumpAnalysis.org + TraceAnalysis.org -
Posted in Log Analysis, Software Trace Analysis, Trace Analysis Patterns | No Comments »
Tuesday, February 7th, 2017
One of the trace attributes we didn’t pay much attention to in the past is CPU. This column is present in some ETW-based trace implementations such as Citrix CDF traces. As any trace attribute, it can be used to form Adjoint Thread of Activity (as all messages from code executed on that particular CPU). As we already considered threads as braids, we use braid groups as a further metaphor. In our case we combine CPUs and threads into one group which uses permutation for CPU scheduling. Instead of permutations, twists may be modeled as changes of threads. The Braid Group analysis pattern is illustrated in the following diagram:
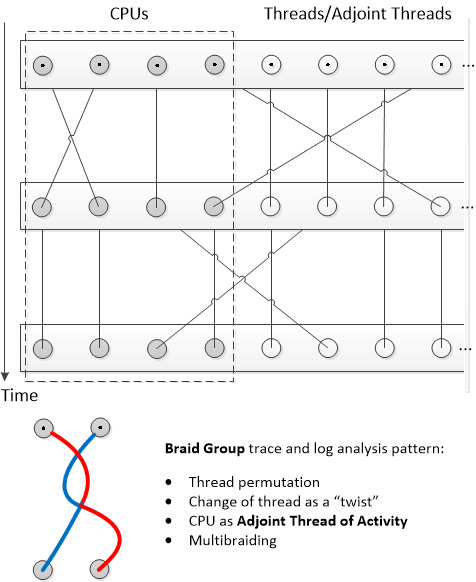
This is a preliminary description of the analysis pattern. We plan to elaborate on it in further case studies. For example, instead of multithreading we can use multibraiding.
- Dmitry Vostokov @ DumpAnalysis.org + TraceAnalysis.org -
Posted in CDF Analysis Tips and Tricks, Log Analysis, Software Trace Analysis, Trace Analysis Patterns | No Comments »
Monday, December 12th, 2016
Recently we found a correlation between software trace with high Statement Density and Current of Periodic Error with uniform Error Distribution and process heap Memory Leak suspected from memory dump analysis. If we metaphorically view periodic errors as “frequency” and the size of a heap as “mass” we may see that the growth of “frequency” correlates with the growth of “mass” and vice versa. Since frequency is inversely proportional to wave length we see a metaphorical analog to Louis de Broglie’s wave-particle duality. In general, as we already pointed in the discussion of narrativity and spatiality of software execution artifacts (see also Software Trace and Memory Dump Analysis seminar), software traces / logs and memory dumps can be seen as “dual” to each other according (metaphorically again) to de Broglie’s “duality of the laws of nature”. So we name this analysis pattern De Broglie Trace Duality since some memory dump regions can be considered of a general trace nature. Our correlation can be depicted in this diagram:
Practically, when we see Memory Consumption Patterns (but don’t know their source / root cause yet) we can ask for traces and logs, and in the case of frequent Periodic Errors found there we can suggest troubleshooting steps that may serve as a resolution or workaround.
- Dmitry Vostokov @ DumpAnalysis.org + TraceAnalysis.org -
Posted in Core Dump Analysis, Crash Dump Analysis, Crash Dump Patterns, Log Analysis, Root Cause Analysis, Software Trace Analysis, Trace Analysis Patterns, Trace Analysis and Physics | No Comments »
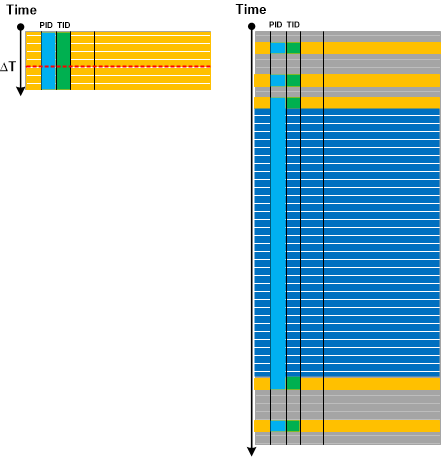
Wednesday, November 23rd, 2016
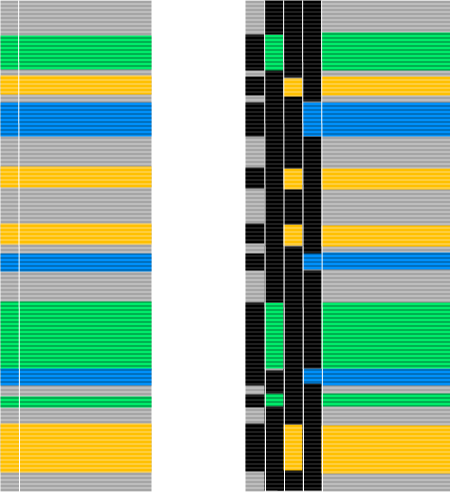
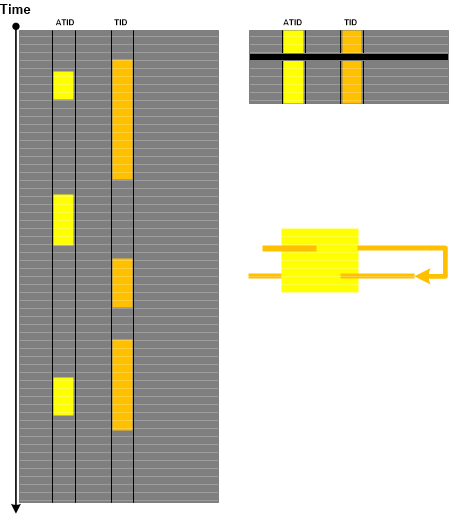
Considering and extending Trace Dimension to TID, ATID, and Time we use Poincaré section and Poincaré map analogies to introduce Poincaré Trace analysis pattern. We choose a value of one “coordinate”, for example, Time, and then form the new trace that consists of messages from different (A)TIDs that have the same timestamp as Time value or the last message(s) from other different ATIDs if they happened before section Time:
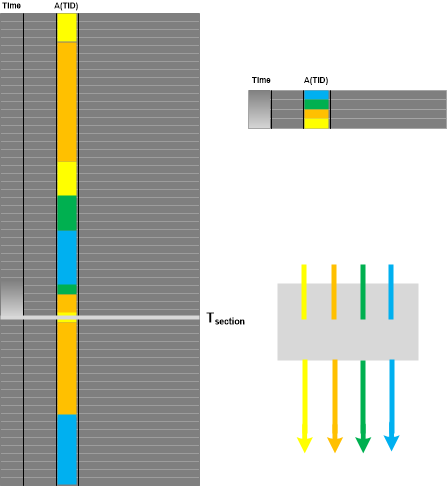
If we choose a different ATID than Time and TID, then Poincare Trace is equivalent to Adjoint Thread of Activity. If ATID is TID we have Thread of Activity as a trivial case. If we have Thread of Activity, we can choose some ATID and get Poincaré Trace as illustrated in the following diagram where the thick black line in the right Poincaré Trace represents Discontinuity and its Time Delta:
- Dmitry Vostokov @ DumpAnalysis.org + TraceAnalysis.org -
Posted in Log Analysis, Software Trace Analysis, Trace Analysis Patterns, Trace Analysis and Physics | No Comments »
Saturday, November 19th, 2016
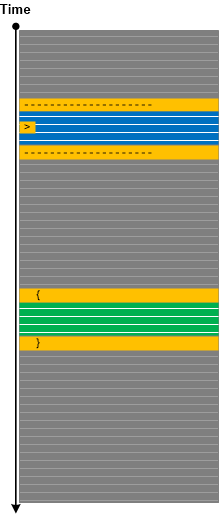
There are messages in traces and logs that alone do not have useful information. These are adornments or ornamentation messages that we initially called Delineator or Separator messages that structure message stream or Figural Events (where we borrowed the name figural from Lyotard) such as formatting the next message with { }. Such messages only make meaning with other meaningful messages. We call this pattern Ornament. It helps in using trace analysis patterns and trace pattern identification.
Ornament can also be present inside individual messages, for example, as a character prefix. It can be a part of Message Invariant or variable itself. Some ornamentation can play a rhetorical function.
Although ornament is present in non-software architecture this concept has never been explored in pattern–oriented software architecture and construction. We propose similar concept for source code (software construction) in addition to ornamentation of its Declarative Trace. For software post-construction, we also add ornament part to software structure and behavior parts.
- Dmitry Vostokov @ DumpAnalysis.org + TraceAnalysis.org -
Posted in Log Analysis, Software Trace Analysis, Trace Analysis Patterns | No Comments »
Tuesday, November 15th, 2016
When we have hundreds of separate trace files from Split Trace and a smaller Split Trace with fewer files or just a single trace file that was recorded simultaneously (for example, a client from client-server environment) we can “project” the smaller Message Space into the larger Message Space as depicted in the following diagram:
This Projective Space analysis pattern can be used in conjunction with Indexical Trace where time interval can be used as an index into the larger Split Trace. Such projection may not be accurate but, assuming that the target trace Statement Current is uniform on average, can still be a very good heuristic instead of a binary search. For example, recently we had 4 sequential trace files for the client and 36 sequential files for the server. The software problem interval was specified in Basic Facts. We found that it in the second path of the 4th client trace. We, therefore, only inspected the last 4 traces of the 36 server sequential trace set and found it contained in the 35th server trace.
This pattern uses projective space metaphor from mathematics.
- Dmitry Vostokov @ DumpAnalysis.org + TraceAnalysis.org -
Posted in CDF Analysis Tips and Tricks, Log Analysis, Software Trace Analysis, Trace Analysis Patterns | No Comments »
Friday, September 30th, 2016
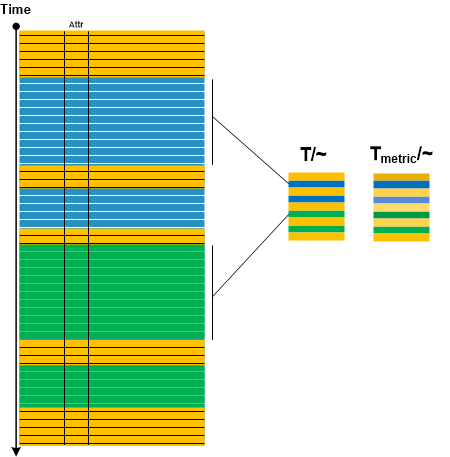
In Adjoint Message analysis pattern description we mentioned compressing message sequences having the same message attribute into one message. Considering the trace as “topological” space and message attribute as “equivalence” relation we introduce Quotient Trace analysis pattern by analogy with quotient space in topology. By endowing message sequences having the same attribute with some “metric” such as cardinality of Message Set we can also visually distinguish resulted quotient messages if they have the same attribute but from different sequences at different times. All this is illustrated in the following diagram:
- Dmitry Vostokov @ DumpAnalysis.org + TraceAnalysis.org -
Posted in Log Analysis, Software Trace Analysis, Software Trace Diagramming, Software Trace Visualization, Trace Analysis Patterns, Trace Analysis and Topology | No Comments »
Sunday, September 4th, 2016
Sometimes log messages are formatted with mistakes, buffers are not cleared before copying, copied strings are truncated, tracing implementation and presentation contains coding defects. There can be internal corruption when messages are formed or “corruption” during presentation, for example, default field conversion rules (like in Excel). We call this pattern Corrupt Message. Such messages may affect trace and log analysis where data search may not show full relevant results. We then recommend to double check findings by using Data Flow of a different Message Invariant.
- Dmitry Vostokov @ DumpAnalysis.org + TraceAnalysis.org -
Posted in Log Analysis, Software Trace Analysis, Trace Analysis Patterns | No Comments »
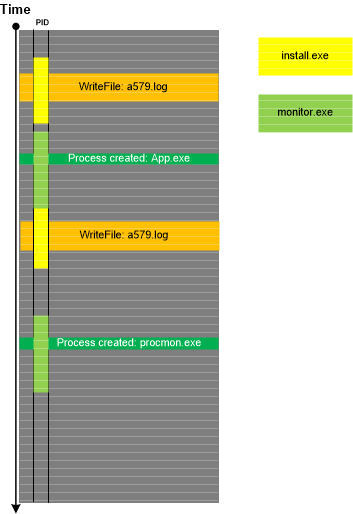
Saturday, September 3rd, 2016
Sometimes, the presence of some messages in a trace or log shows that some other tracing or logging tool was running or that some process was also doing tracing. We call this analysis pattern Surveyor. Such discovered tracing may not be related to the trace we are looking at (compare to Trace Extension) but may help with finding additional traces in the system as illustrated in the following diagram:
- Dmitry Vostokov @ DumpAnalysis.org + TraceAnalysis.org -
Posted in Log Analysis, Software Trace Analysis, Trace Analysis Patterns | No Comments »