Archive for the ‘Log Analysis’ Category
Monday, August 15th, 2016
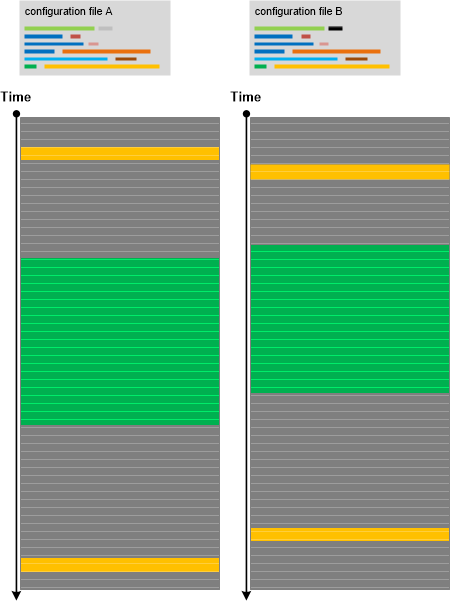
Recently we performed the diagnostic analysis of a software incident where certain functionality was not available to users and provided the report based on analysis patterns such as Focus of Tracing and Opposition Messages. We also conjectured some hypotheses explaining the observed abnormal behaviour. However, at the end, the problem was solved not by the analysis of a lengthy software execution log but by looking at the small configuration INI file where not working functionality was simply disabled in one line:
EnableFunctionality = 0
Even before that analysis we were thinking about the importance of Small DA+TA such as configuration files and registry details that can be considered as general software traces. Here DA+TA means Dump Artefact + Trace Artefact and Big DA+TA refers to software execution memory dump artefacts and trace artefacts that can be really huge. The analysis pattern is illustrated in the following diagram where we see no difference between working and non-working scenarios due to insufficient trace coverage (Sparse Trace):
- Dmitry Vostokov @ DumpAnalysis.org + TraceAnalysis.org -
Posted in Log Analysis, Software Trace Analysis, Trace Analysis Patterns | No Comments »
Saturday, August 13th, 2016
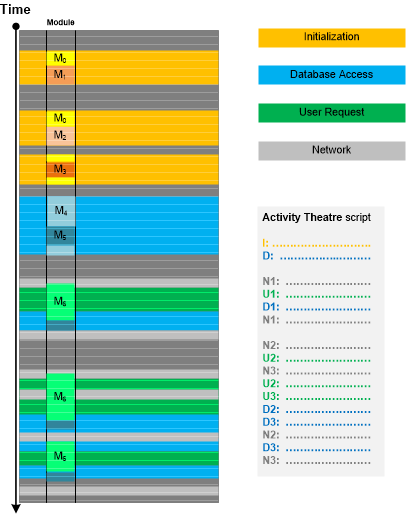
In addition to Message Patterns there are higher level patterns of specific activities and Motives. Such activities may or may not coincide with specific components (modules) because they may be grouped based on implementation messages, software internals semantics and not on architectural and design entities (as in Use Case Trail analysis pattern). Moreover, he same components may “play” different activity roles. Once assigned, Activity Theatre “scripts” can be compared with “scripts” from other traces and logs (Inter-Correlation) or different parts of the same log (Intra-Correlation). This pattern is illustrated in the following diagram:
- Dmitry Vostokov @ DumpAnalysis.org + TraceAnalysis.org -
Posted in Log Analysis, Software Trace Analysis, Trace Analysis Patterns | No Comments »
Tuesday, August 9th, 2016
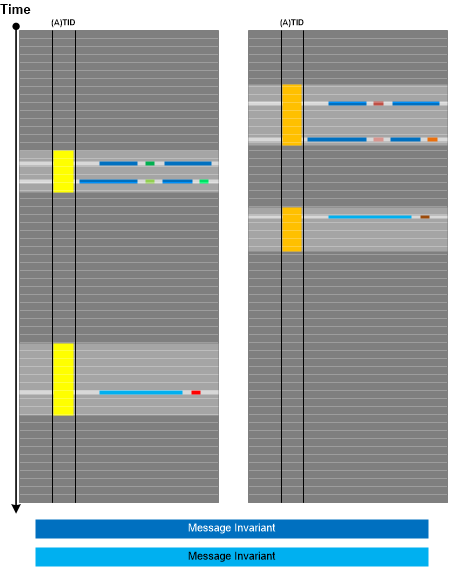
Now we come to the trace and log analysis pattern that we call Message Pattern. It is an ordered set of messages from Thread of Activity or Adjoint Thread of Activity having Message Invariants that can be used for matching another ordered set of messages in another (Inter-Correlation) or the same trace or log (Intra-Correlation). A typical Message Pattern from one of our own trace and log analysis sessions is depicted in the following diagram:
- Dmitry Vostokov @ DumpAnalysis.org + TraceAnalysis.org -
Posted in Log Analysis, Software Trace Analysis, Trace Analysis Patterns | No Comments »
Wednesday, July 13th, 2016
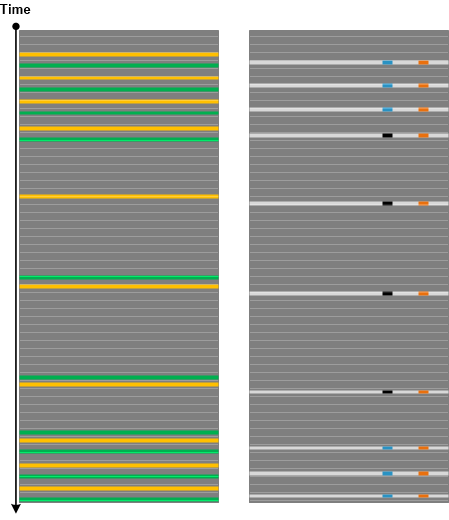
Some tracing architectures, especially the ones that intercept API calls by filtering or hooking, may log synchronous requests by remembering to write done return result in the same trace message later on when the response is available after the wait. If such data is still not available in the log or trace it may point to some blocked request for which other software execution artifact analysis (such as memory dump analysis) is necessary. In some cases, the analysis of the corresponding Fiber Bundle stack trace may point to Blocking Module or the involvement of file system filters. This analysis pattern that we call Missing Data is illustrated in the following diagram:
- Dmitry Vostokov @ DumpAnalysis.org + TraceAnalysis.org -
Posted in Crash Dump Patterns, Log Analysis, Software Trace Analysis, Trace Analysis Patterns | No Comments »
Wednesday, June 29th, 2016
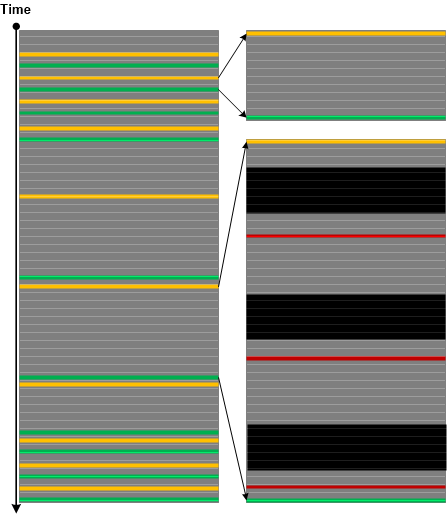
When using complex trace and log analysis patterns such as Fourier Activity we may be first interested in selecting all instances of a particular message type from specific Thread of Activity and then look for Time Deltas, Discontinuities, Data Flow, and other patterns. We call this analysis pattern Fiber of Activity by analogy of fibers (lightweight threads) since the individual thread execution flow is “co-operative” inside, whereas threads themselves are preempted outside. The following diagram from Fourier Analysis example illustrates the concept by showing three fibers:
This analysis pattern is different from trace-wide Sheaf of Activities where the latter is about selecting messages as Adjoint Threads of Activity which may span several processes and threads.
- Dmitry Vostokov @ DumpAnalysis.org + TraceAnalysis.org -
Posted in CDF Analysis Tips and Tricks, Log Analysis, Software Trace Analysis, Trace Analysis Patterns | No Comments »
Monday, June 27th, 2016
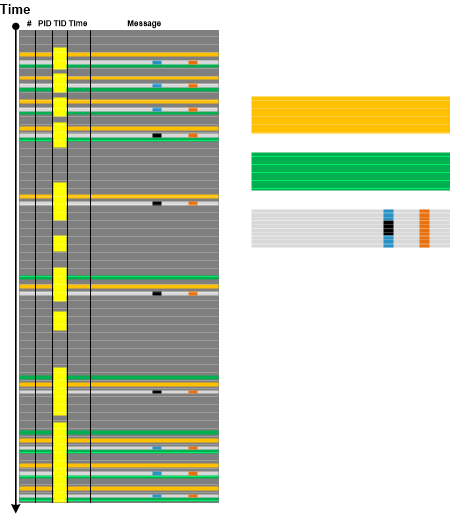
Sometimes we have trace and log messages that appear with certain time frequency throughout all log or specific Thread of Activity. Such frequencies may fluctuate reflecting varying system or process performance. Analyzing trace areas where such messages have different Time Deltas may point to additional diagnostic log messages useful for root cause analysis. The following minimal trace graph depicts the recent log analysis for proprietary file copy operation where the frequency of internal communication channel entry/exit Opposition Messages was decreasing from time to time. Such periods were correlating with increased time intervals between “entry” and “exit” messages. Analysis of messages between them revealed additional diagnostic statements missing in periods of higher frequency and corresponding Timeouts adding up to overall performance degradation and slowness of copy operation.
Additional analysis of Data Association in a different message type between available communication buffers and the total number of such buffers revealed significant frequency drop during constant Data Flow of zero available communication buffers:
We call this analysis pattern Fourier Activity by analogy with Fourier series in mathematics. This pattern is for individual message types and can also be considered a fine-grained example of Statement Current and Trace Acceleration analysis patterns which can be used to detect areas of different frequencies in individual Fibers (Adjoint Threads of Activities formed from the same Thread of Activity).
- Dmitry Vostokov @ DumpAnalysis.org + TraceAnalysis.org -
Posted in CDF Analysis Tips and Tricks, Log Analysis, Root Cause Analysis, Software Trace Analysis, Trace Analysis Patterns | No Comments »
Saturday, April 30th, 2016
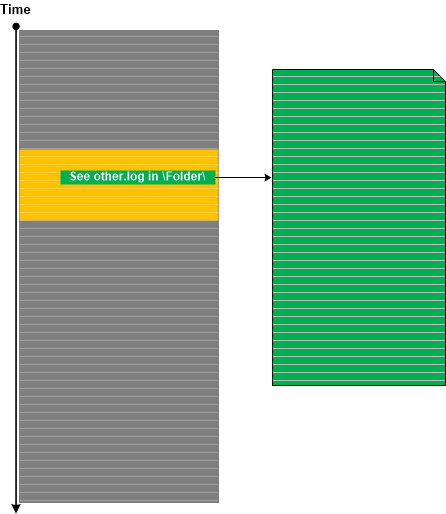
Trace Extension is an obvious log analysis pattern that is about trace messages that refer to some other trace or log that may or may not exist. Sometimes, there can be instructions to enable additional tracing that is not possible to cover by the current trace source. We have seen this in some trace statements from .NET Exception Stack Traces.
- Dmitry Vostokov @ DumpAnalysis.org + TraceAnalysis.org -
Posted in .NET Debugging, CDF Analysis Tips and Tricks, Log Analysis, Software Trace Analysis, Software Trace Reading, Trace Analysis Patterns | No Comments »
Wednesday, April 27th, 2016
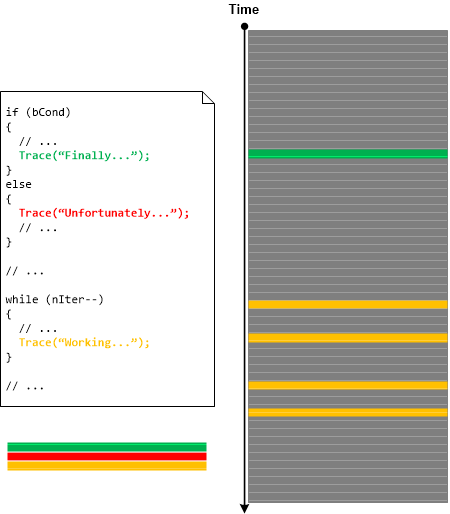
The trace statements in source code can be considered as Declarative Trace by analogy with variable declaration and definition in programming languages such as C and C++. Declaration of the variable doesn’t mean that the variable will be actually used. Some declared variables such as arrays will actually expand in memory when used (as in .bss sections). The same is with trace messages from Declarative Trace. Some of them will not appear in the actual software execution trace and some will be repeated because of loops and multiple code reentrance. However, Declarative Traces are useful for studying the possibilities of tracing and logging design, implementation, and coverage (for example, Sparse Trace). Some trace analysis patterns are also applicable for Declarative Traces such as Message Sets and Bifurcation Points (among different source code versions). This is illustrated in the following picture:
- Dmitry Vostokov @ DumpAnalysis.org + TraceAnalysis.org -
Posted in Log Analysis, Software Trace Analysis, Trace Analysis Patterns | No Comments »
Thursday, March 17th, 2016
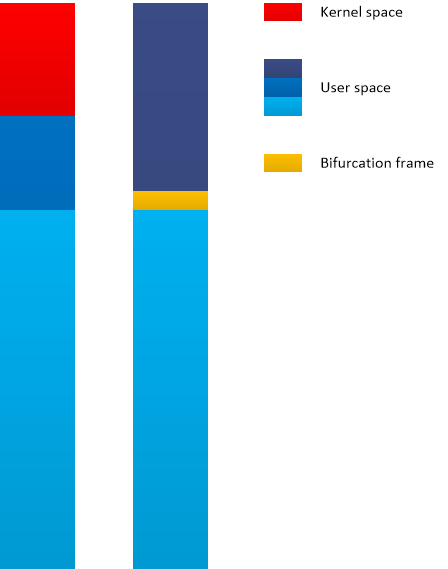
Variable Subtrace analysis pattern was introduced for inter-correlational analysis of CPU spikes across memory snapshots with just one thread involved. In contrast, we found Constant Subtrace pattern useful in Wait Chain analysis involving several threads in just one memory snapshot (intra-correlational analysis). Here a constant subtrace groups stack traces from Stack Trace Collection with a bifurcation stack trace frame (similar to Bifurcation Point trace analysis pattern) providing some wait chain relationship hint. Such subtraces traces may be initially found by the preceding wait chain analysis or by technology-specific subtraces such as ALPC/RPC server thread frames (as seen in an example stack from COM interface invocation). Here is a minimal stack trace diagram (similar to minimal trace graphs introduced in Accelerated Windows Software Trace Analysis training) illustrating the pattern (it also shows Spiking Thread pattern in user space as seen from a complete memory dump):
- Dmitry Vostokov @ DumpAnalysis.org + TraceAnalysis.org -
Posted in Crash Dump Analysis, Crash Dump Patterns, Log Analysis, Software Trace Analysis, Trace Analysis Patterns | No Comments »
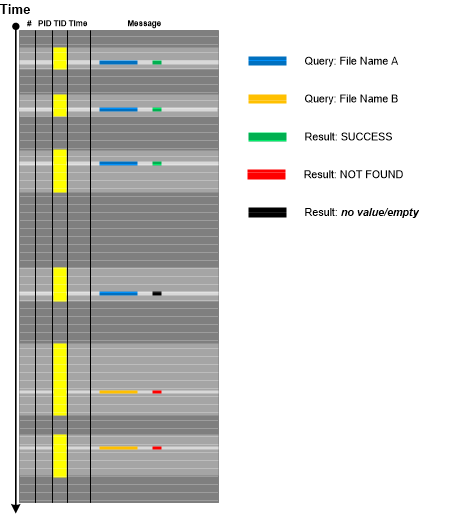
Saturday, March 12th, 2016
Data Selector is a variant of Inter-Correlation trace analysis pattern where we use data found in one trace to select Message Set or Adjoint Thread of Activity in another trace. This analysis activity is depicted in the following picture where we have a client log and corresponding server log. In the server log we have log entries for many client sessions. To select messages corresponding to our client session we use some data attribute in the client trace, for example, the user name, and Linked Messages analysis pattern to find one of the messages in the server log that contains the same user name. Then we find out which user session it belongs to and form its Adjoint Thread:
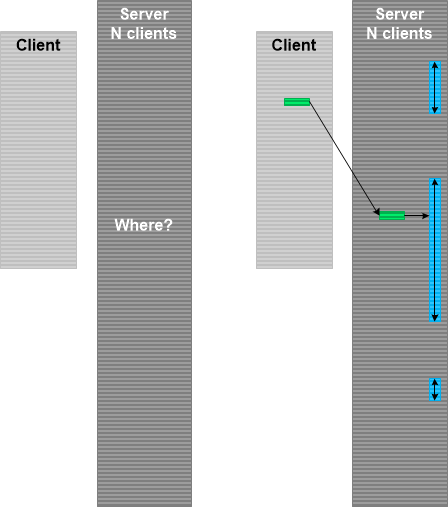
This pattern is different from Identification Messages where we don’t even know the object that emitted trace messages. In Data Selector case we know in principle what kind of messages we are looking for. We just need to select among many alternatives.
- Dmitry Vostokov @ DumpAnalysis.org + TraceAnalysis.org -
Posted in CDF Analysis Tips and Tricks, Log Analysis, Software Trace Analysis, Trace Analysis Patterns | No Comments »
Saturday, January 30th, 2016
Often, we need to identify the source of messages based on problem object or subsystem description (what question) before we proceed answering where question (where in the trace we can find messages related to the problem). Even when we know where are messages there can be many sources to select from (if we don’t know the where question we can use Indirect Message analysis pattern). To answer what question we propose Identification Messages analysis pattern. Basic Fact problem description may include properties and behavioural description of the problem object or subsystem. Based on that we can map them to the log messages that such an object can produce:
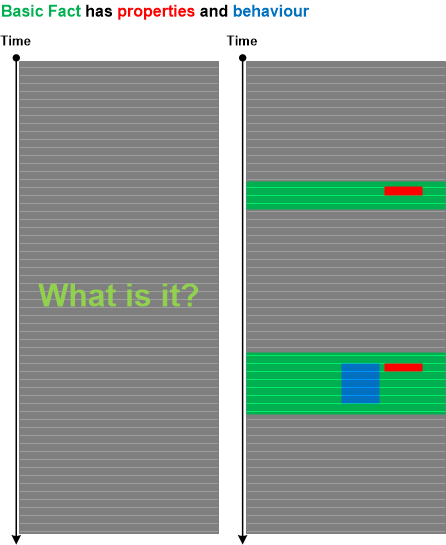
These messages may not be Error Messages or some other type of messages reflecting abnormal behavior. These messages are only used to identify the software object, module or subsystem.
For example, in one case there were problems with the custom status bar. However, the window handle for it or its parent wasn’t specified in the problem report. In the log file we had a lot of messages describing GUI behavior of many windows. To find out the status bar we thought that it should have small height but long width. Indeed we found one such child window. In addition, for this window the log file contained many messages related to frequent window text changes, possibly reflecting the status bar updates. Having identified the window handle, we proceeded to the analysis of another log with thousands of window messages. Because of the known window handle we were able to select only messages pertaining to our problem status bar.
- Dmitry Vostokov @ DumpAnalysis.org + TraceAnalysis.org -
Posted in CDF Analysis Tips and Tricks, Log Analysis, Software Trace Analysis, Software Trace Reading, Trace Analysis Patterns | No Comments »
Saturday, January 16th, 2016
When we have very large traces and Basic Facts containing some data values such as a user name, device name, or registry key value we may use Data Interval analysis pattern to select the trace fragment for the initial log analysis. The first and the last trace messages containing selected data for the closed Data Interval. Depending on the trace size and other considerations we can also choose open Data Intervals. It is illustrated in the following diagram where we use Analysis interval notation borrowed mathematics:
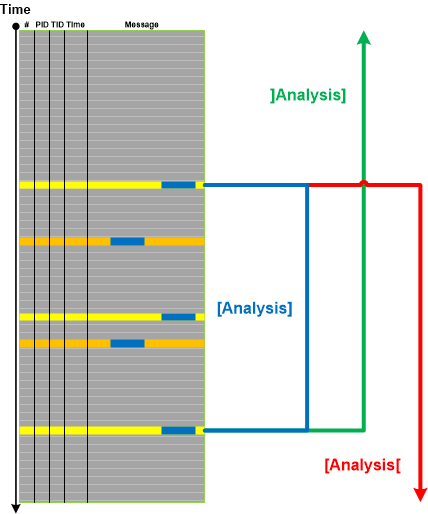
Interval boundary messages may also be used as Trace Mask for another trace.
- Dmitry Vostokov @ DumpAnalysis.org + TraceAnalysis.org -
Posted in CDF Analysis Tips and Tricks, Log Analysis, Software Trace Analysis, Trace Analysis Patterns | No Comments »
Saturday, November 14th, 2015
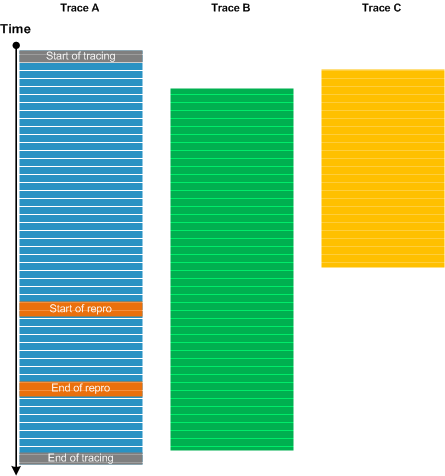
Multiple traces and logs are usually collected for diagnosing distributed systems. Different tools and tracing settings (circular, sequential, file size limit) may be used, systems may be unsynchronized, and individual system tracing may be started at different times due to manual tracing setup and switching between systems. There may be Blackouts, Circular, and Truncated traces. When we analyze such a trace set (Inter-Correlation) we usually select one trace or log that is used as Calibrating Trace. It is used for measuring all other traces against Basic Facts such as start and end tracing times, and the time of the problem. One such scenario is illustrated in the following diagram:
- Dmitry Vostokov @ DumpAnalysis.org + TraceAnalysis.org -
Posted in CDF Analysis Tips and Tricks, Log Analysis, Software Trace Analysis, Trace Analysis Patterns | No Comments »
Tuesday, November 10th, 2015
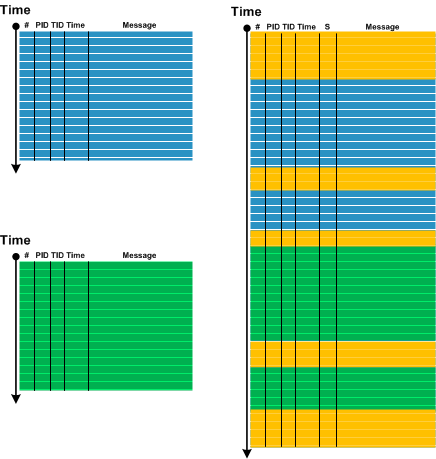
We would like to introduce Trace Dimension pattern to address the emerging complexity of logs from distributed environments. By a distributed environment we mean not only a collection of multiple computers (for example, client-server) but also terminal services environments with several different user sessions on one computer (OS) and even multiple user processes (IPC) in some cases. If some task can be performed on one machine or session or inside one process then splitting it across several computers, sessions, or processes usually results in logs with added Distributed Infrastructure Messages (DIMs) such as from proxies, channels and their management:
So, one of the trace simplification strategies is to request the reproduction and its tracing in a simplified environment (such as inside one terminal services session) to eliminate DIMs. In one case, we analyzed a trace for a clipboard paste problem in Windows terminal services environment. After a clipboard copy different data was pasted to different applications. The same behavior was observed for application processes running inside different sessions and processes running inside one session. However, the log was collected for the more complex multiple session scenario with many False Positive Errors which completely disappeared from one session scenario log.
DIM abbreviation played a role in naming this pattern. Additionally, if sessions can be considered a second dimension, then separate VMs can be considered as a third dimension, separate clouds as a 4th dimension, and so on.
- Dmitry Vostokov @ DumpAnalysis.org + TraceAnalysis.org -
Posted in CDF Analysis Tips and Tricks, Log Analysis, Software Trace Analysis, Trace Analysis Patterns | No Comments »
Thursday, October 22nd, 2015
Typical software trace may contain several Error Messages with different error codes and different exception names with Exception Stack Traces. Searching for individual codes or exceptions in problem databases may show many matches. Searching for all of them may show nothing. Therefore, we can construct the set of all subsets from the set of codes and exceptions (a power set) and perform analytic reasoning (and a search) based on certain subsets based on the problem description, Trace Viewpoints such as Use Case Trails, Motifs, Focus of Tracing, Foreground Components, (Adjoint) Threads of Activity, and simply some Activity Regions and Message Sets.
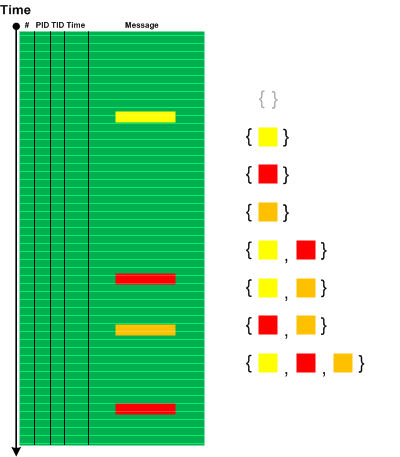
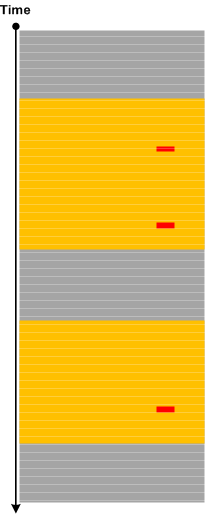
The following picture illustrates Error Powerset analysis pattern with a trace that has 4 error messages where 2 messages have the same error code.
- Dmitry Vostokov @ DumpAnalysis.org + TraceAnalysis.org -
Posted in Log Analysis, Software Trace Analysis, Trace Analysis Patterns | No Comments »
Wednesday, September 30th, 2015
Sometimes we have Periodic Message Blocks of a few adjacent messages, for example, when flags are translated into separate messages per bit. Then we may have a pattern of Sequence Repeat Anomaly when one of several message blocks have missing or added messages compared to the more numerous number of expected identical message blocks. Then Missing Message Message Context may be explored further. The following diagram illustrates the pattern:
The name of the pattern comes from the notion of repeated DNA sequences.
- Dmitry Vostokov @ DumpAnalysis.org + TraceAnalysis.org -
Posted in CDF Analysis Tips and Tricks, Log Analysis, Software Trace Analysis, Software Trace Analysis and Genetics, Software Trace Analysis and Genomics, Software Trace Reading, Trace Analysis Patterns | No Comments »
Saturday, September 12th, 2015
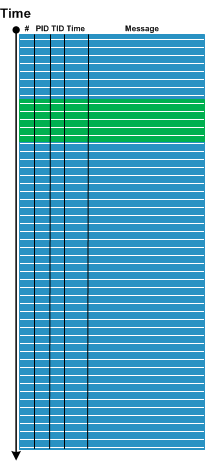
Recently we analyzed a few logs which ended with a specialized Activity Region from a subsystem that sets operational parameters. The problem description stated that the system became unresponsive after changing parameters in a certain sequence. Usually, for that system, when we stop logging (even after setting parameters) we end up with messages from some Background Components since some time passes between the end of setting parameters activity and the time the operator sends stop logging request:
However, in the problem case we see message flow stops right in the middle of parameter setting activity:
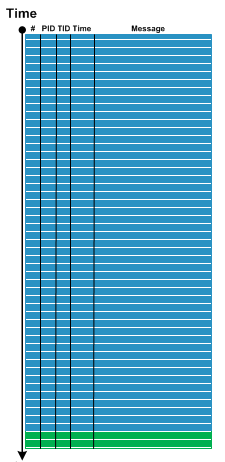
So we advised to check for any crashes or hangs, and, indeed, it was found that the system was actually experiencing system crashes, and we got memory dumps for analysis where we found Top Module from a 3rd-party vendor related to parameter setting activity.
Please also note an analogy here between normal thread stack traces from threads that are waiting most of the time and Spiking Thread stack trace caught up in the middle of some function.
We call this pattern Ruptured Trace after a ruptured computation.
Note, that if it is possible to restart the system and resume the same tracing we may get an instance of Blackout analysis pattern.
- Dmitry Vostokov @ DumpAnalysis.org + TraceAnalysis.org -
Posted in Core Dump Analysis, Crash Dump Analysis, Crash Dump Patterns, Log Analysis, Software Trace Analysis, Software Trace Analysis Tips and Tricks, Trace Analysis Patterns | No Comments »
Thursday, July 9th, 2015
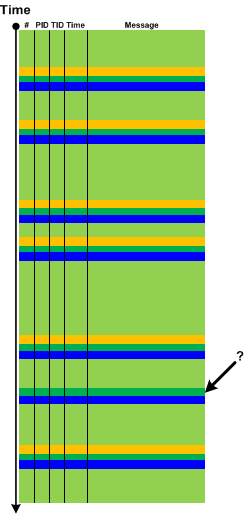
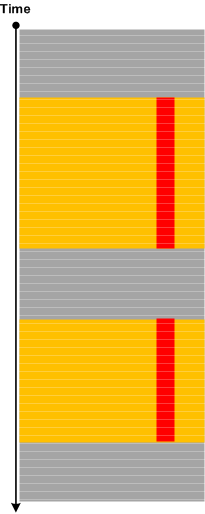
Sometimes a few Error Messages or Periodic Errors with low Statement Density for specific Activity Regions or Adjoint Threads of Activity (for specific component, file or function) may constitute Activity Disruption. If the particular functionality was no longer available at the logging time then its unavailability may not be explained by such disruptions, and such messages may be considered False Positive Errors in relation to the reported problem:
But, if we have Periodic Message Blocks containing only Periodic Errors, Activity Region or Adjoint Thread Discontinuity, or simply No Activity, then we may have the complete cease of activity that may correlate with the unavailable functionality:
- Dmitry Vostokov @ DumpAnalysis.org + TraceAnalysis.org -
Posted in Log Analysis, Software Trace Analysis, Trace Analysis Patterns | No Comments »
Tuesday, June 30th, 2015
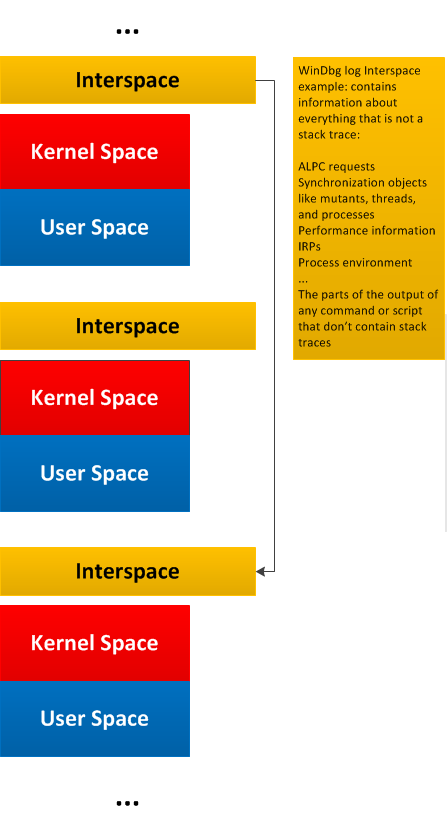
General traces and logs may have Message Space regions “surrounded” by the so-called Interspace. Such Interspace regions may link individual Message Space regions like in this diagram generalizing WinDbg !process 0 3f command output:
- Dmitry Vostokov @ DumpAnalysis.org + TraceAnalysis.org -
Posted in Debugging, Log Analysis, Software Trace Analysis, Software Trace Reading, Software Trace Visualization, Trace Analysis Patterns | No Comments »
Tuesday, March 3rd, 2015
When we do tracing and logging much of computational activity is not visible. For live tracing and debugging this can be alleviated by adding Watch Threads. These are selected memory locations that may or may not be formatted according to specific data structures and are inspected at each main trace message occurrence or after specific intervals or events:
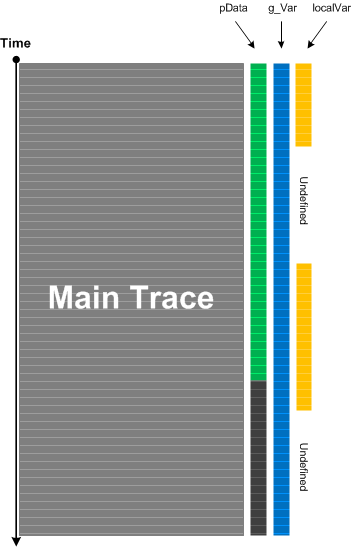
This analysis pattern is different from State Dump which is about intrinsic tracing where the developer of logging statements already incorporated variable watch in source code. Watch Threads are completely independent from original tracing and may be added independently. Counter Value is the simplest example of Watch Thread if done externally because the former usually doesn’t require source code and often means some OS or module variable independent of product internals. Watch Thread is also similar to Data Flow pattern where specific data we are interested in is a part of every trace message.
- Dmitry Vostokov @ DumpAnalysis.org + TraceAnalysis.org -
Posted in Debugging, Log Analysis, Performance Monitoring, Software Narratology, Software Trace Analysis, Trace Analysis Patterns | No Comments »