Archive for the ‘Escalation Engineering’ Category
Tuesday, May 25th, 2010
Finally Citrix has published a tool (written by my colleague Colm Naish, lead escalation engineer) that allows controlled injection of events into CDF (ETW) trace message stream. This is useful in many troubleshooting scenarios where we need to rely on Significant Event and Anchor Message analysis patterns to partition traces into artificial Activity Regions to start our analysis with. This is also analogous for the imposition of the external time on the stream of tracing events from software narratology perspective:
CDFMarker On Demand - For XenApp and XenDesktop
- Dmitry Vostokov @ DumpAnalysis.org + TraceAnalysis.org -
Posted in Announcements, CDF Analysis Tips and Tricks, Citrix, Debugging, Escalation Engineering, Software Engineering, Software Narratology, Software Technical Support, Software Trace Analysis, Software Trace Reading, Tools, Trace Analysis Patterns | 1 Comment »
Friday, May 21st, 2010
In this part I would like to introduce the notion of Forgotten Facts in opposition to Basic Facts or supporting information. These are facts that engineers often feel uncomfortable to mention because they are troubleshooting information they couldn’t obtain (if they tried) due to some time or customer pressures, failures, incorrectly understood troubleshooting procedures or some other obstacles. Therefore it is important to have a set of counter questions or checklists mapped from common software behaviour patterns to software troubleshooting patterns. Problem descriptions should also be subjected to close reading to reveal unconsciously concealed information. Next part will explore this in more detail with some case studies commissioned by Software Maintenance Institute.
- Dmitry Vostokov @ DumpAnalysis.org + TraceAnalysis.org -
Posted in Crash Dump Analysis, Debugging, Escalation Engineering, Psychoanalysis of Software Maintenance and Support, Psychology, Software Behavior Patterns, Software Maintenance Institute, Software Technical Support, Software Trace Analysis, Software Trace Reading, Software Troubleshooting Patterns | 1 Comment »
Monday, May 10th, 2010
My drive to generalization led me to place an adornment on the portal to highlight the fact that memory and software trace analysis patterns are under an umbrella of general software behaviour patterns:
http://www.dumpanalysis.org/Software-Behavior-Patterns-Headline
In the forthcoming post series I plan to write about similarities between these two branches and also provide pattern examples from non-Windows platforms. All this material will provide the foundation for the forthcoming book Software Behavior: A Guide to Systematic Analysis (ISBN: 978-1906717162).
- Dmitry Vostokov @ DumpAnalysis.org + TraceAnalysis.org -
Posted in Announcements, Computer Science, Crash Dump Analysis, Crash Dump Patterns, Debugging, Escalation Engineering, Memiotics (Memory Semiotics), Memoretics, Science of Memory Dump Analysis, Science of Software Tracing, Software Behavior Patterns, Software Engineering, Software Maintenance Institute, Software Technical Support, Software Trace Analysis, Software Troubleshooting Patterns, Trace Analysis Patterns | No Comments »
Wednesday, May 5th, 2010
PLOT - Program Lines of Trace - the source code lines behind trace messages
Examples: What a plot do we have here! The struggle against the monster database component and endless voyages across space boundaries.
- Dmitry Vostokov @ DumpAnalysis.org + TraceAnalysis.org
Posted in Debugging, Debugging Slang, Escalation Engineering, New Acronyms, Software Engineering, Software Narratology, Software Technical Support, Software Trace Analysis, Trace Analysis Patterns | 1 Comment »
Monday, May 3rd, 2010
Modern pattern-driven software trace analysis on Microsoft and Citrix platforms urgently requires a practical guide and OpenTask plans to publish this summer the following book in both Practical Foundations and Systematic Software Fault Analysis series:
- Title: Citrix Common Diagnostic Facility (CDF) and Microsoft Event Tracing for Windows (ETW) Software Trace Analysis: Practical Foundations
- Author: Dmitry Vostokov
- Publisher: Opentask (August 2010)
- Language: English
- Product Dimensions: 22.86 x 15.24
- ISBN: 1906717176
- ISBN-13: 978-1906717179
- Paperback: 200 pages
- Dmitry Vostokov @ DumpAnalysis.org + TraceAnalysis.org -
Posted in Announcements, Books, Citrix, Escalation Engineering, Publishing, Software Engineering, Software Technical Support, Software Trace Analysis, Software Tracing for Dummies, Testing, Tools, Trace Analysis Patterns, Training and Seminars, Windows System Administration | No Comments »
Sunday, May 2nd, 2010
c’t – Magazin für Computertechnik has published a review of First Fault Software Problem Solving book:
http://www.heise.de/ct/inhalt/2010/08/192/ (in German)
Fabian Röken kindly translated it into English:
No single large software package comes without errors. It seems that customers simply accept this, patiently waiting and hoping for patches or updates. Skwire sticks up for a more target-aimed approach: one will never get a faultless software, but it would already be a great improvement if flaws were already solved on their first occurrence (”first fault”) and not only after a long analysis (”second fault”).
The advantages are actually obvious. However, a corresponding stringent system architecture, as common on mainframes such as IBM’s z/OS, did not become prevalent in the PC market.
Skwire outlines the types of errors and strategies to resolve them in all details. His 40 years of experience, such as at IBM, shimmers through again and again. He puts emphasis on making sure that the reader understands the terminology he is using: “What is a problem in the first place?”, “What is a service point?” - in some cases he also explains specific metrics such as the “serviceability rating”.
His tool classification includes teaching tips, e.g. regarding the structure of a protocol in case of errors; or for tracking the important information how often an error must occur before a solution has to be approached. His suggestions equally address developers, designers, testers, managers - and the end user. In his last chapter he presents and reviews commercial tools in the first fault and second fault environment.
Skwire addresses a topic which is unfortunately very much neglected, and this alone already makes it worth enough to take a look at his book (***). Short quotations and humorous drawings relax the technical topic. If you are looking for an overview then you will be fine with this book. However, if you are a software developer looking for source code samples then you will search in vain. Skwire has released the book under the print-on-demand process. You will find it on Amazon, for example.
(Tobias Engler/fm)
- Dmitry Vostokov @ DumpAnalysis.org + TraceAnalysis.org -
Posted in Books, Escalation Engineering, First Fault Problem Solving, Software Engineering, Software Technical Support, Troubleshooting Methodology, Windows System Administration | No Comments »
Sunday, May 2nd, 2010
It is time to start being systematic. In addition to all-encompassing multi-volume Memory Dump Analysis Anthology OpenTask starts Systematic Software Fault Analysis series with Crash Dump Analysis: Practical Foundations as the first book. It introduces basic definitions, tools, memory dump collection and preliminary analysis methods for Windows platforms including legacy versions. This practical reference guide is a must have for system administrators of Windows server platforms and client workstations, technical support engineers and general Windows users. It builds foundation for the second book Crash Dump Analysis for System Administrators and Support Engineers and the remaining tetralogy books Windows Crash Dump Analysis and Advanced Windows Crash Dump Analysis.
Product information:
- Title: Crash Dump Analysis: Practical Foundations (Windows Edition, Systematic Software Fault Analysis Series)
- Authors: Dmitry Vostokov
- Publisher: Opentask (May 2010)
- Language: English
- Product Dimensions: 22.86 x 15.24
- ISBN-13: 978-1-906717-98-8
- Paperback: 100 pages
Fromt cover:
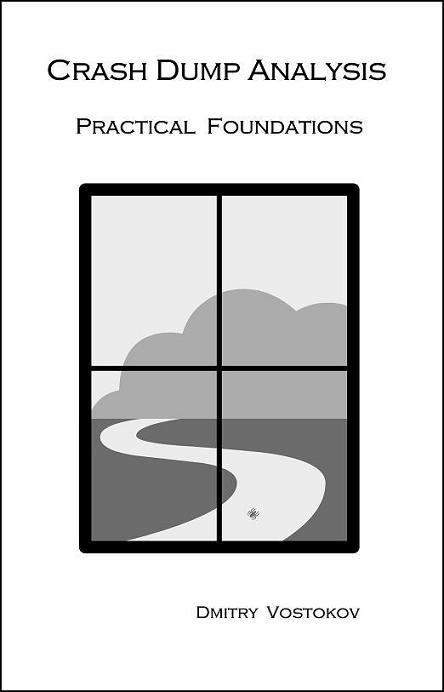
Table of Contents to be published soon.
- Dmitry Vostokov @ DumpAnalysis.org + TraceAnalysis.org -
Posted in Announcements, Books, Crash Dump Analysis, Crash Dumps for Dummies, Escalation Engineering, Publishing, Software Technical Support, Tools, Windows System Administration | No Comments »
Thursday, April 22nd, 2010
Forthcoming CARE and STARE online systems additionally aim to provide software behaviour pattern identification via debugger log and trace analysis and suggest possible software troubleshooting patterns. The purpose of these post series is to provide high level overview of possible patterns of software behavior and how they can be recognised and analyzed. This work started in October, 2006 with the identification of computer memory patterns and later continued with software trace patterns. Bringing all of them under a unified linked framework seems quite natural to me.
- Dmitry Vostokov @ DumpAnalysis.org + TraceAnalysis.org -
Posted in Computer Science, Crash Dump Analysis, Crash Dump Patterns, Escalation Engineering, Science of Memory Dump Analysis, Science of Software Tracing, Software Behavior Patterns, Software Engineering, Software Maintenance Institute, Software Technical Support, Software Trace Analysis, Software Troubleshooting Patterns, Trace Analysis Patterns | No Comments »
Tuesday, April 20th, 2010
The following tool published by Citrix follows DebugWare patterns in its overall architecture and design and was implemented by a team of engineers using RADII process:
SsOnExpert - Single Sign-On XenApp Plug-in Troubleshooting Tool
- Dmitry Vostokov @ DumpAnalysis.org + TraceAnalysis.org -
Posted in Announcements, Citrix, DebugWare Patterns, Debugging, Debugging Methodology, Escalation Engineering, Software Architecture, Software Engineering, Software Maintenance Institute, Software Technical Support, Tools, Troubleshooting Methodology | No Comments »
Sunday, April 18th, 2010
OpenTask to offer first 3 volumes of Memory Dump Analysis Anthology in one set:


The set is available exclusively from OpenTask e-Commerce web site starting from June. Individual volumes are also available from Amazon, Barnes & Noble and other bookstores worldwide.
Product information:
- Title: Modern Memory Dump and Software Trace Analysis: Volumes 1-3
- Author: Dmitry Vostokov
- Language: English
- Product Dimensions: 22.86 x 15.24
- Paperback: 1600 pages
- Publisher: Opentask (31 May 2010)
- ISBN-13: 978-1-906717-99-5
Information about individual volumes:
- Dmitry Vostokov @ DumpAnalysis.org + TraceAnalysis.org -
Posted in .NET Debugging, Aesthetics of Memory Dumps, Announcements, AntiPatterns, Art, Assembly Language, Books, Bugchecks Depicted, C and C++, CDA Pattern Classification, CDF Analysis Tips and Tricks, Categorical Debugging, Certification, Citrix, Code Reading, Common Mistakes, Computational Ghosts and Bug Hauntings, Computer Science, Countefactual Debugging, Crash Analysis Report Environment (CARE), Crash Dump Analysis, Crash Dump Patterns, Crash Dumps for Dummies, Data Recovery, DebugWare Patterns, Debugging, Debugging Methodology, Debugging Slang, Deep Down C++, Dictionary of Debugging, Dr. Watson, Education and Research, Escalation Engineering, Fun with Crash Dumps, Futuristic Memory Dump Analysis, GDB for WinDbg Users, Hardware, History, Horrors of Computation, Hyper-V, Intelligent Memory Movement, Kernel Development, Laws of Troubleshooting and Debugging, Mathematics of Debugging, Memiotics (Memory Semiotics), Memoidealism, Memoretics, Memory Analysis Culture, Memory Analysis Forensics and Intelligence, Memory Auralization, Memory Dump Analysis Jobs, Memory Religion (Memorianity), Memory Space Art, Memory Space Music, Memory Systems Language, Memory Visualization, Memuonics, Minidump Analysis, Multithreading, Music for Debugging, Music of Computation, New Acronyms, New Words, Occult Debugging, Philosophy, Psi-computation, Publishing, Science of Memory Dump Analysis, Science of Software Tracing, Security, Software Architecture, Software Defect Construction, Software Engineering, Software Generalist, Software Maintenance Institute, Software Narratology, Software Technical Support, Software Trace Analysis, Software Trace Visualization, Software Tracing for Dummies, Software Victimology, Stack Trace Collection, Testing, Tools, Trace Analysis Patterns, Training and Seminars, Troubleshooting Methodology, Victimware, Virtualization, Vista, Visual Dump Analysis, WinDbg Scripts, WinDbg Tips and Tricks, WinDbg for GDB Users, Windows 7, Windows Server 2008, Windows System Administration | No Comments »
Wednesday, April 14th, 2010
Time flows fast and I have refined my code I wrote at 6 year anniversary to include finer monthly tracing:
switch (months_at_citrix)

{

  case 60:

    write_blog_post(”I’ve just passed 5 year mark … “);

    wait_for_certificate();

    write_blog_post(”Shortly after celebrating 5 years … “);

    break;

  case 72:

    write_blog_post(”Threads in my process run very fast. Not long ago … “);

    break;

  case 78:

    write_blog_post(”Time flows fast and I have refined my code …“);

    break;

case 84:

    // … TBD

}
- Dmitry Vostokov @ DumpAnalysis.org + TraceAnalysis.org -
Posted in Announcements, Citrix, Crash Dump Analysis, Debugging, Escalation Engineering, History, Software Engineering, Software Technical Support, Software Trace Analysis | 1 Comment »
Tuesday, April 13th, 2010
.SYS - Sponsor YourSelf or Sponsor YourSelves.
Examples: I’m developing a fantastic project.SYS
- Dmitry Vostokov @ DumpAnalysis.org + TraceAnalysis.org -
Posted in Debugging Slang, Escalation Engineering, Software Engineering, Software Technical Support, Tools | No Comments »
Friday, April 9th, 2010
Plan to start providing training and seminars in my free time. If you are interested please answer these questions (you can either respond here in comments or use this form for private communication http://www.dumpanalysis.org/contact):
- Are you interested in on-site training, prefer traveling or attending webinars?
- Are you interested in software trace analysis as well?
- What specific topics are you interested in?
- What training level (beginner, intermediate, advanced) are you interested in? (please provide an example, if possible)
Additional topics of expertise that can be integrated into training include Source Code Reading and Analysis, Debugging, Windows Architecture, Device Drivers, Troubleshooting Tools Design and Implementation, Multithreading, Deep Down C and C++, x86 and x64 Assembly Language Reading.
Looking forward to your responses. Any suggestions are welcome.
- Dmitry Vostokov @ DumpAnalysis.org + TraceAnalysis.org -
Posted in .NET Debugging, Announcements, AntiPatterns, Assembly Language, Bugchecks Depicted, C and C++, CDA Pattern Classification, CDF Analysis Tips and Tricks, Certification, Code Reading, Common Mistakes, Crash Analysis Report Environment (CARE), Crash Dump Analysis, Crash Dump Patterns, Crash Dumps for Dummies, Data Recovery, DebugWare Patterns, Debugging, Debugging Methodology, Deep Down C++, Education and Research, Escalation Engineering, FreeBSD Crash Corner, GDB for WinDbg Users, Hardware, Hyper-V, Java Debugging, Kernel Development, Laws of Troubleshooting and Debugging, Linux Crash Corner, Mac Crash Corner, Memory Analysis Forensics and Intelligence, Memory Visualization, Minidump Analysis, Multithreading, Security, Software Architecture, Software Defect Construction, Software Engineering, Software Generalist, Software Maintenance Institute, Software Narratology, Software Technical Support, Software Trace Analysis, Software Trace Visualization, Software Tracing for Dummies, Software Victimology, Stack Trace Collection, Testing, Tools, Trace Analysis Patterns, Training and Seminars, Troubleshooting Methodology, Victimware, Virtualization, Vista, Visual Dump Analysis, WinDbg Scripts, WinDbg Tips and Tricks, WinDbg for GDB Users, Windows 7, Windows Server 2008, Windows System Administration, Workaround Patterns | No Comments »
Thursday, April 8th, 2010
This is a new open source tool similar to PDBFinder in functionality but with much simpler interface and internal implementation (based on the file name structure of the certain classes of TMF files for ETW). To be released this month on TraceAnalysis.org.
- Dmitry Vostokov @ DumpAnalysis.org + TraceAnalysis.org -
Posted in CDF Analysis Tips and Tricks, Citrix, Debugging, Escalation Engineering, Software Technical Support, Software Trace Analysis, Tools | No Comments »
Monday, April 5th, 2010
I’m very pleased to announce that the Korean edition is available:

The book can be found on:
- Dmitry Vostokov @ DumpAnalysis.org + TraceAnalysis.org -
Posted in Announcements, AntiPatterns, Assembly Language, Books, Books (Korean), C and C++, Computer Science, Crash Dump Analysis, Crash Dump Patterns, Crash Dumps for Dummies, Debugging, Dr. Watson, Escalation Engineering, Fun with Crash Dumps, GDB for WinDbg Users, Hardware, Kernel Development, Mathematics of Debugging, Memiotics (Memory Semiotics), Memoretics, Memory Space Music, Memory Visualization, Minidump Analysis, Multithreading, Publishing, Science of Memory Dump Analysis, Security, Software Architecture, Software Engineering, Software Technical Support, Testing, Tools, Troubleshooting Methodology, Virtualization, Vista, WinDbg Scripts, WinDbg Tips and Tricks, WinDbg for GDB Users, Windows Server 2008, Windows System Administration | No Comments »
Friday, April 2nd, 2010
Just got today a notification from one of corporate content providers that the following book was released a few months ago (reading it now and post a review later):
Technical Support Essentials: Advice to Succeed in Technical Support

It would be interesting to compare with the Art of Software Support book (I still hasn’t finished it yet).
- Dmitry Vostokov @ DumpAnalysis.org + TraceAnalysis.org -
Posted in Books, Escalation Engineering, Software Technical Support | No Comments »
Monday, March 15th, 2010
On The Same Page - coming to the same conclusion as another engineer when looking at a memory dump or a software trace. Literally means the same page of memory where an exception occurred or a stack trace is reconstructed or the same “page” when browsing a software trace output using a viewer.
Examples: Aha, we are on the same page!
- Dmitry Vostokov @ DumpAnalysis.org + TraceAnalysis.org -
Posted in Crash Dump Analysis, Debugging, Debugging Slang, Escalation Engineering, Fun with Crash Dumps, Software Technical Support, Software Trace Analysis | No Comments »
Thursday, February 11th, 2010
This is a revised, edited, cross-referenced and thematically organized volume of selected DumpAnalysis.org blog posts about crash dump analysis and debugging written in July 2009 - January 2010 for software engineers developing and maintaining products on Windows platforms, quality assurance engineers testing software on Windows platforms and technical support and escalation engineers dealing with complex software issues. The fourth volume features:
- 13 new crash dump analysis patterns
- 13 new pattern interaction case studies
- 10 new trace analysis patterns
- 6 new Debugware patterns and case study
- Workaround patterns
- Updated checklist
- Fully cross-referenced with Volume 1, Volume 2 and Volume 3
- New appendixes
Product information:
- Title: Memory Dump Analysis Anthology, Volume 4
- Author: Dmitry Vostokov
- Language: English
- Product Dimensions: 22.86 x 15.24
- Paperback: 410 pages
- Publisher: Opentask (30 March 2010)
- ISBN-13: 978-1-906717-86-5
- Hardcover: 410 pages
- Publisher: Opentask (30 April 2010)
- ISBN-13: 978-1-906717-87-2

Back cover features memory space art image: Internal Process Combustion.
- Dmitry Vostokov @ DumpAnalysis.org + TraceAnalysis.org -
Posted in .NET Debugging, Aesthetics of Memory Dumps, Announcements, AntiPatterns, Art, Assembly Language, Books, C and C++, CDA Pattern Classification, CDF Analysis Tips and Tricks, Categorical Debugging, Certification, Citrix, Code Reading, Common Mistakes, Computer Science, Countefactual Debugging, Crash Analysis Report Environment (CARE), Crash Dump Analysis, Crash Dump Patterns, Crash Dumps for Dummies, DebugWare Patterns, Debugging, Debugging Slang, Education and Research, Escalation Engineering, Fun with Crash Dumps, Games for Debugging, Hardware, Horrors of Computation, Hyper-V, Kernel Development, Laws of Troubleshooting and Debugging, Mathematics of Debugging, Memiotics (Memory Semiotics), Memoidealism, Memoretics, Memory Analysis Culture, Memory Analysis Forensics and Intelligence, Memory Dreams, Memory Dump Analysis Jobs, Memory Dumps in Movies, Memory Space Art, Memory Visualization, Memuonics, Minidump Analysis, Multithreading, Music for Debugging, New Acronyms, New Words, Opcodism, Philosophy, Physicalist Art, Publishing, Science Fiction, Science of Memory Dump Analysis, Science of Software Tracing, Security, Software Architecture, Software Defect Construction, Software Engineering, Software Generalist, Software Maintenance Institute, Software Narratology, Software Technical Support, Software Trace Analysis, Software Trace Visualization, Software Tracing for Dummies, Software Victimology, Stack Trace Collection, Testing, Tools, Trace Analysis Patterns, Training and Seminars, Troubleshooting Methodology, Victimware, Virtualization, Vista, Visual Dump Analysis, WinDbg Scripts, WinDbg Tips and Tricks, WinDbg for GDB Users, Windows 7, Windows Server 2008, Windows System Administration, Workaround Patterns | No Comments »
Monday, January 18th, 2010
After exciting results of the previous year of debugging it is time to announce modest plans for this year, 0×7DA:
Release the first beta version of EasyDbg
Release the first beta version of CARE (Crash Analysis Report Environment) for a pattern-driven debugger log analyzer with standards for structured audience-driven reports
Release the first beta version of STARE (Software Trace Analysis Report Environment) for a pattern-driven software trace analyzer with corresponding standards for structured audience-driven reports
Publish the following books on dump analysis that address different audiences (general users, system administrators, support and escalation engineers, testers, software engineers, security and software defect researchers):
- Windows Debugging Notebook
- Crash Dump Analysis for System Administrators and Support Engineers
- Memory Dump Analysis Anthology, Volume 4
- Memory Dump Analysis Anthology, Volume 5
- Memory Dump Analysis Anthology Color Supplement
- Principles of Memory Dump Analysis
- My Computer Crashes and Freezes: A Non-technical Guide to Software and Hardware Errors
- Linux, FreeBSD and Mac OS X Debugging: Practical Foundations
- Encyclopedia of Crash Dump Analysis Patterns
- WinDbg In Use: Debugging Exercises
Publish articles related to memory dump analysis in Debugged! magazine
Update WinDbg Poster and Cards
- Dmitry Vostokov @ DumpAnalysis.org + TraceAnalysis.org -
Posted in Announcements, Books, Certification, Crash Dump Analysis, Debugging, Education and Research, Escalation Engineering, FreeBSD Crash Corner, Linux Crash Corner, Mac Crash Corner, New Acronyms, Publishing, Software Engineering, Software Technical Support, Software Trace Analysis | 1 Comment »