Crash Dump Analysis Patterns (Part 251)
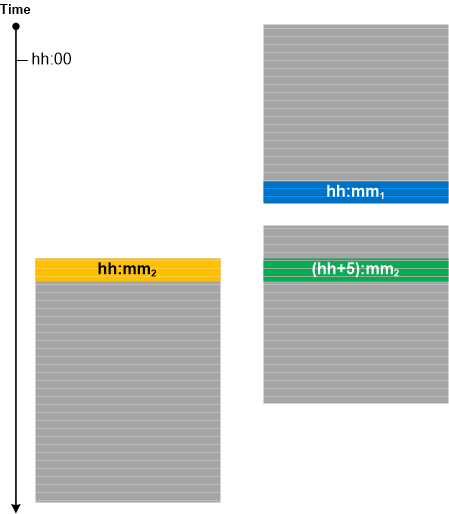
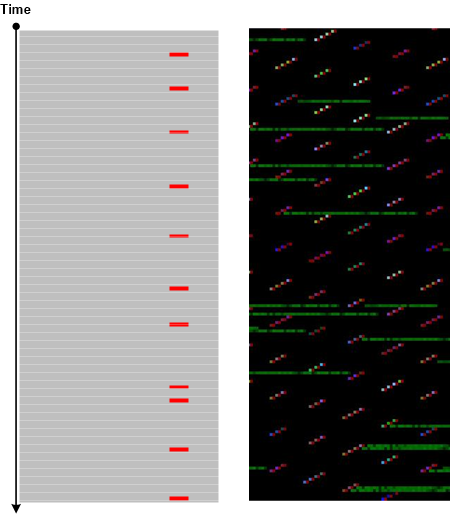
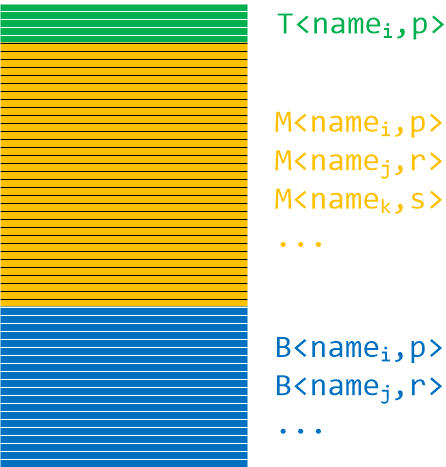
Friday, May 12th, 2017When the same API function is executed it may leave the same data structure in its Execution Residue inside raw stack regions of different threads. We call this analysis pattern Frame Regularity. It may be used to find and correctly interpret stack frame values from thread stack traces or regions based on values found in some other thread stack trace or region where we already know their meaning.
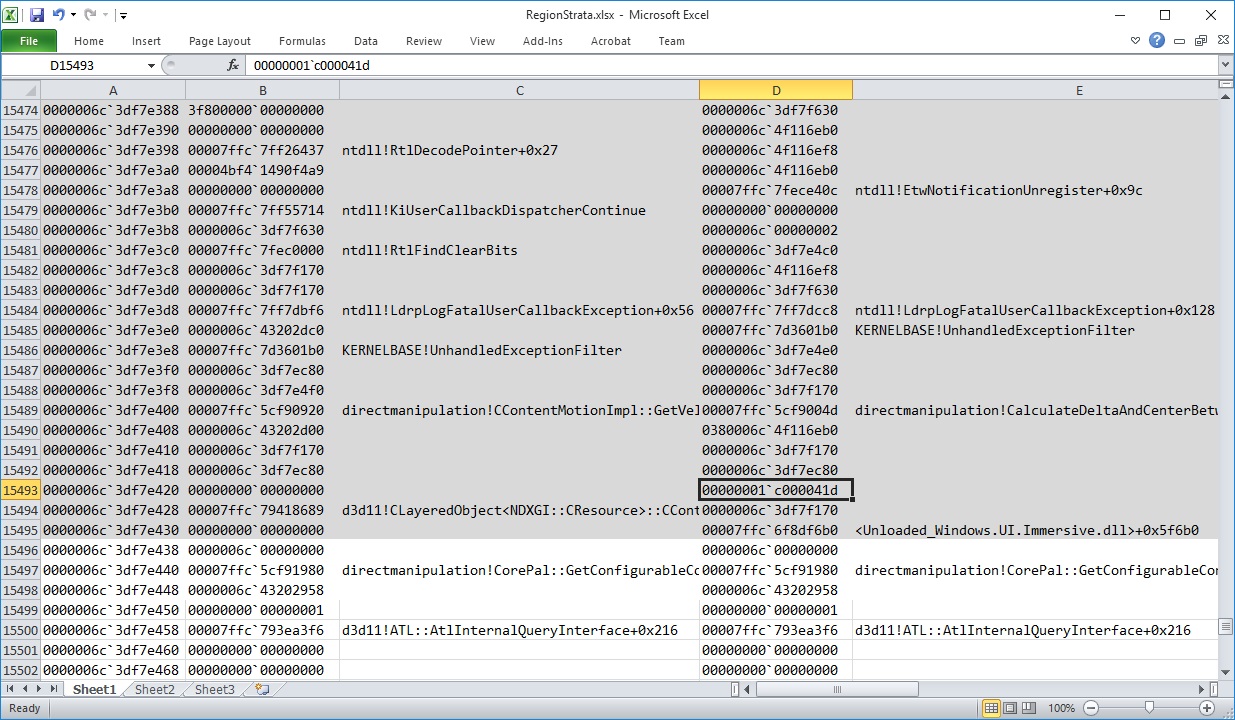
Consider the critical section Wait Chain below. We want to know what critical section the thread F34 is waiting for. The backwards disassembly of 00007ffd`41894e14 return address doesn’t show the critical section address explicitly. However, 00007ffd`43827e40 return address disassembly from a different critical section thread owner D7C shows critical section address 00007ffd`4391d8a8 which we can find as a 3rd “argument” to ntdll!RtlpWaitOnCriticalSection (which is just a value picked up from the stack region and not the real function argument passed by stack). Using Frame Regularity we try to see if the 3rd value for the same function from the thread F34 under question is also a critical section address 00000071`3f08c488. Indeed, we find that it is the address of the critical section owned by the thread B18.
0:000> !cs -l -o -s

-----------------------------------------

DebugInfo          = 0x00007ffd4391dbe8

Critical section   = 0x00007ffd4391d8a8 (ntdll!LdrpLoaderLock+0x0)

LOCKED

LockCount          = 0x13

WaiterWoken        = No

OwningThread       = 0×0000000000000f34

RecursionCount     = 0×1

LockSemaphore      = 0×8B0

SpinCount          = 0×0000000004000000

OwningThread DbgId = ~14s

OwningThread Stack =

Child-SP          RetAddr           : Args to Child                                                           : Call Site

00000071`40d4c618 00007ffd`43829a85 : 00000071`3f08c488 00000000`00000002 00000000`bd000200 00000000`00000000 : ntdll!NtWaitForSingleObject+0xa

00000071`40d4c620 00007ffd`43827f44 : 00000000`a90002ab 00007ffd`40d52eba 00000071`3f08c488 00000000`00000000 : ntdll!RtlpWaitOnCriticalSection+0xe1

00000071`40d4c6f0 00007ffd`41894e14 : 00000071`3f08c488 00007ffd`4229b3a8 00000000`00000000 00000071`3f08c470 : ntdll!RtlpEnterCriticalSectionContended+0xa4

00000071`40d4c730 00007ffd`41895d8d : 00000071`40c52ab0 00000000`00000000 00230022`00210020 00270026`00250024 : shell32!kfapi::CFolderPathResolver::GetPath+0×168

00000071`40d4dd50 00007ffd`41892d50 : 00000000`00000080 00000000`000000ce 00000000`00000104 00000000`000003ff : shell32!kfapi::CFolderCache::GetPath+0×772

00000071`40d4e0c0 00007ffd`41893540 : 00000071`40d4e258 00000000`20000020 00000000`000000ce 00000071`42141080 : shell32!kfapi::CKFFacade::GetFolderPath+0×120

00000071`40d4e220 00007ffd`4189368c : 00000000`00008023 00000000`000000ce 00000000`5307cc38 00000000`000000ce : shell32!SHGetFolderPathEx+0×80

00000071`40d4e290 00007ffd`40d61939 : 00000000`00000000 00000000`00000000 00000000`00000037 00000000`00008023 : shell32!SHGetFolderPathWWorker+0xf9

00000071`40d4e2f0 00007ffd`41a80fba : 00000000`00000000 00000000`00000000 00000071`40d4e400 00000071`42010000 : KERNELBASE!SHGetFolderPathW+0×49

00000071`40d4e330 00007ffd`40d7e60f : 00000071`00000001 00000000`00000020 00000000`00000035 00000071`42141080 : shell32!SHGetSpecialFolderPathWWorker+0×23

00000071`40d4e370 00000000`5317704d : 00000071`40d4e7d0 00000071`40d4ee68 00000000`00000000 00000000`53062b30 : KERNELBASE!SHGetSpecialFolderPathW+0×3f

00000071`40d4e3a0 00000000`530e72f1 : 00000000`5333fa10 00000000`00000001 00000000`5333fa10 00000000`530ab470 : ModuleA+0xccded

[…]

00000071`40d4eba0 00007ffd`4380e82e : 00000071`40cc6780 00000000`53060000 00000071`00000001 00007ffd`40892421 : ntdll!LdrpCallInitRoutine+0×4c

00000071`40d4ec00 00007ffd`4380e624 : 00000071`40cb2790 00007ffd`4384ee00 00000071`40cb2790 00000000`53224dec : ntdll!LdrpInitializeNode+0×176

ntdll!RtlpStackTraceDataBase is NULL. Probably the stack traces are not enabled.

—————————————–

DebugInfo          = 0×0000007140c52a70

Critical section   = 0×00007ffd31f41a88 (localspl!g_csBidiAccess+0×8)

LOCKED

LockCount          = 0×4

WaiterWoken        = No

OwningThread       = 0×0000000000000d7c

RecursionCount     = 0×1

LockSemaphore      = 0×1410

SpinCount          = 0×00000000020007d0

OwningThread DbgId = ~7s

OwningThread Stack =

Child-SP          RetAddr           : Args to Child                                                           : Call Site

00000071`4029e708 00007ffd`43829a85 : 0000a498`9a4b3f83 00000071`4029ec00 00000071`4029e880 00000071`4029e858 : ntdll!NtWaitForSingleObject+0xa

00000071`4029e710 00007ffd`43827f44 : 00000000`00000002 00007ffd`00000000 00007ffd`4391d8a8 00000071`4029e9d0 : ntdll!RtlpWaitOnCriticalSection+0xe1

00000071`4029e7e0 00007ffd`43827e40 : 00007ffd`41613750 00000071`3efa2a10 00007ffd`416b4d58 00007ffd`41686000 : ntdll!RtlpEnterCriticalSectionContended+0xa4

00000071`4029e820 00007ffd`4380ad5a : 00007ffd`41686000 00000071`4029e8e0 00007ffd`41613750 00000071`4029eeb8 : ntdll!LdrpAcquireLoaderLock+0×2c

00000071`4029e860 00007ffd`4386785f : 00000000`00000000 00007ffd`41685c64 00000000`00000000 00000071`4029e980 : ntdll!LdrpGetDelayloadExportDll+0×7e

00000071`4029e920 00007ffd`43826c8e : 00000000`00000000 00007ffd`41685c64 00000000`00000000 00007ffd`41613750 : ntdll!LdrpHandleProtectedDelayload+0×3f

00000071`4029ede0 00007ffd`4153763b : 00000071`4029ef50 00000000`00000000 00007ffd`2f4d3be0 00000000`00000003 : ntdll!LdrResolveDelayLoadedAPI+0×8e

00000071`4029ee40 00007ffd`415376df : 00000071`3ffe3020 00007ffd`2f4d2482 00000071`3ffe3020 00000071`3ffcb078 : combase!__delayLoadHelper2+0×2b

00000071`4029ee80 00007ffd`415239b6 : a4e9da62`d9130000 00000071`4029eed0 00000000`00000000 00000000`0000006c : combase!_tailMerge_OLEAUT32_dll+0×3f

00000071`4029eef0 00007ffd`41523883 : 00000071`40c22230 00000071`4029f029 00000000`80070015 00000071`3ffcf598 : combase!wCoUninitialize+0xb6

00000071`4029ef20 00007ffd`31e74e1a : 00000071`40c22230 00000000`00000000 00000000`80070015 00007ffd`2f4d3be0 : combase!CoUninitialize+0xb3

00000071`4029ef50 00007ffd`31e7459c : 00000000`00000000 00000071`4029f1d8 00007ffd`31f416d8 00000000`00000001 : localspl!GetBidiStrings+0×3be

00000071`4029f090 00007ffd`31e72150 : 00000000`00000000 00000071`4029f240 00007ffd`31f416d8 00000000`00000000 : localspl!GetBidiPropertiesForDevnode+0×9c

00000071`4029f140 00007ffd`31e7b03b : 00000000`00000008 00000071`403588e0 00000071`40a83130 00000000`00000001 : localspl!GetPropertiesFromPrinter+0×1f4

00000071`4029f750 00007ffd`31e7ae90 : 00000071`40aa6e40 00000000`00000000 00000000`00000001 00007ffd`ffff4b5e : localspl!CreatePrintQueueDevnodeWorker+0xab

00000071`4029f8a0 00007ffd`31eb475e : 00000000`00000000 00000000`00000000 00000071`3f05f470 00000000`00000000 : localspl!CreatePrintQueueDevnode+0xb4

00000071`4029f920 00007ffd`31eb46eb : 00000071`3ffe35c0 00000071`3f05f470 00007ffd`31eb4710 00000000`00000000 : localspl!DevnodeCreationWorkItem::Run+0×4e

00000071`4029f990 00007ffd`4386247e : 00007ffd`31eb46b0 00000071`3f05f3c0 00000071`4029fb78 00000071`3f05f470 : localspl!NThreadingLibrary::TWorkCrew::tpSimpleCallback+0×3b

00000071`4029f9c0 00007ffd`43824a5d : 00000071`3f05f470 00000071`3efd23f0 00000000`00000000 00000071`3f01e3e8 : ntdll!TppSimplepExecuteCallback+0×7e

00000071`4029fa00 00007ffd`410313d2 : 00000000`00000000 00007ffd`438245e0 00000071`3f01bf10 00000000`00000000 : ntdll!TppWorkerThread+0×47d

ntdll!RtlpStackTraceDataBase is NULL. Probably the stack traces are not enabled.

—————————————–

DebugInfo          = 0×0000007140c52970

Critical section   = 0×0000000001017600 (ModuleB+0×38F80)

LOCKED

LockCount          = 0×1

WaiterWoken        = No

OwningThread       = 0×0000000000000fe8

RecursionCount     = 0×1

LockSemaphore      = 0×14A0

SpinCount          = 0×00000000020007d0

OwningThread DbgId = ~22s

OwningThread Stack =

Child-SP          RetAddr           : Args to Child                                                           : Call Site

00000071`4102e6a8 00007ffd`43829a85 : 00000000`00000050 00007ffd`4381c937 00000071`3f110000 00000000`00000000 : ntdll!NtWaitForSingleObject+0xa

00000071`4102e6b0 00007ffd`43827f44 : 00000000`00000000 00000000`00000000 00007ffd`4391d8a8 00000000`00000000 : ntdll!RtlpWaitOnCriticalSection+0xe1

00000071`4102e780 00007ffd`43827e40 : 00000071`4102ebe8 00000000`00000000 00000071`4102ebb8 00000071`40cc5a00 : ntdll!RtlpEnterCriticalSectionContended+0xa4

00000071`4102e7c0 00007ffd`43818998 : 00007ff7`acadf000 00000071`4102e830 00000071`4102e830 00000071`4102e830 : ntdll!LdrpAcquireLoaderLock+0×2c

00000071`4102e800 00007ffd`4380b229 : 00000000`00000000 00000071`4102ee40 00007ffd`437f4d38 00000000`00000000 : ntdll!LdrpFindOrMapDll+0×4f8

00000071`4102eb50 00007ffd`4380af29 : 00000000`00000000 00000000`00000000 00000071`4102ee40 00000071`4102ee40 : ntdll!LdrpLoadDll+0×295

00000071`4102ed80 00007ffd`40d58e4a : 00000000`00000000 00000071`4102ee50 00000000`010154a0 00000000`00000002 : ntdll!LdrLoadDll+0×99

00000071`4102ee00 00000000`00fd36ec : 00000000`00000000 00000000`010020a0 00000000`010154a0 00000000`00000000 : KERNELBASE!LoadLibraryExW+0xca

00000071`4102ee70 00000000`00fd3aa6 : 00000071`41147420 00000000`028424c0 00000000`00000001 00000071`411473dc : ModuleB+0×1f1c

[…]

00000071`4102f5b0 00007ffd`3a9b5804 : 00000071`40c33ea8 00007ff7`00000008 00000000`00000008 00000071`3ffff190 : winspool!SpoolerPrinterEventNative+0xb1

00000071`4102f620 00007ffd`31a5566d : 00000071`40c33ea8 00000071`4102f719 00000000`00000008 00000000`00000000 : winspool!SpoolerPrinterEvent+0×54

00000071`4102f660 00007ffd`31e76682 : 00007ffd`31a55480 00000071`40c33ea8 00000071`4102f7c0 00000071`40aabcc0 : PrintIsolationProxy!sandbox::PrintSandboxObject::SandboxDriverEvent+0×1ed

00000071`4102f760 00007ffd`31e7659a : 00000071`3ffaf750 00007ffd`31e76610 00000071`40aabcc0 00000000`00000008 : localspl!sandbox::SandboxObserver::SandboxDriverEvent+0×72

00000071`4102f7b0 00007ffd`31e7621b : 00000071`40c33ea8 00000000`00000000 00000071`40c33ea8 00000000`00000000 : localspl!sandbox::SandboxPrinterDriverEvent+0xda

00000071`4102f820 00007ffd`31e76169 : 00000071`40aa6e40 00000000`00000001 00000000`00000000 00007ffd`31f40001 : localspl!SplDriverEvent+0×5b

00000071`4102f890 00007ffd`31f11c4b : 00000000`00000000 00000071`4102f940 00000071`40aa6e40 00007ffd`31f400c8 : localspl!PrinterDriverEvent+0xbd

ntdll!RtlpStackTraceDataBase is NULL. Probably the stack traces are not enabled.

—————————————–

DebugInfo          = 0×0000007140c52630

Critical section   = 0×000000713f08c488 (+0×713F08C488)

LOCKED

LockCount          = 0×1

WaiterWoken        = No

OwningThread       = 0×0000000000000b18

RecursionCount     = 0×1

LockSemaphore      = 0×14AC

SpinCount          = 0×00000000020007d0

OwningThread DbgId = ~1s

OwningThread Stack =

Child-SP          RetAddr           : Args to Child                                                           : Call Site

00000071`3fe4b5e8 00007ffd`43829a85 : 00000001`00000000 00000000`00000000 00000071`41927fd0 00007ffd`43821067 : ntdll!NtWaitForSingleObject+0xa

00000071`3fe4b5f0 00007ffd`43827f44 : 00000000`00000000 00000000`0000017b 00007ffd`4391d8a8 00000000`00000000 : ntdll!RtlpWaitOnCriticalSection+0xe1

00000071`3fe4b6c0 00007ffd`43827e40 : 00007ffd`41c57850 00000071`3efe3700 00007ffd`4229bf90 00007ffd`42203380 : ntdll!RtlpEnterCriticalSectionContended+0xa4

00000071`3fe4b700 00007ffd`4380ad5a : 00007ffd`42203380 00000071`3fe4b7c0 00007ffd`41c57850 00007ffd`4381609c : ntdll!LdrpAcquireLoaderLock+0×2c

00000071`3fe4b740 00007ffd`4386785f : 00000000`00000000 00007ffd`422026f4 00000071`3ef01790 00000071`3fe4b860 : ntdll!LdrpGetDelayloadExportDll+0×7e

00000071`3fe4b800 00007ffd`43826c8e : 00000000`00000000 00007ffd`422026f4 00000000`00000000 00007ffd`41c57850 : ntdll!LdrpHandleProtectedDelayload+0×3f

00000071`3fe4bcc0 00007ffd`41a818eb : 00000071`3fe4c910 00000071`3fe4c8a0 00000000`00000000 ffffffff`ffffffff : ntdll!LdrResolveDelayLoadedAPI+0×8e

00000071`3fe4bd20 00007ffd`41896d9f : 00000071`40c52670 ffffffff`ffffffff 00000000`00000000 00000071`3fe4e201 : shell32!_delayLoadHelper2+0×2b

00000071`3fe4bd60 00007ffd`41894374 : 00000071`3fe4c8a0 00000071`3fe4bf10 00000000`00000027 00000071`3fe4bed0 : shell32!_tailMerge_api_ms_win_core_com_l1_1_1_dll+0×3f

00000071`3fe4bdd0 00007ffd`4189409a : 00000000`00000000 00000000`00000000 00000071`3fe4c910 00000000`00000000 : shell32!kfapi::CFolderDefinitionStorage::_LoadRegistry+0xb4

00000071`3fe4c440 00007ffd`41896943 : 00000000`00000031 00000000`00000000 00000071`3fe4c698 00000071`40c52670 : shell32!kfapi::CFolderDefinitionStorage::Load+0×66

00000071`3fe4c6a0 00007ffd`4189796a : 00000000`00000000 00000071`40c539a0 00000071`40c37700 00007ffd`41a80f90 : shell32!kfapi::CFolderPathResolver::GetPath+0×242

00000071`3fe4dcc0 00007ffd`41892d50 : 00000071`3fe4e050 00000071`3fe4e038 00000071`3fe4e038 00000000`00000200 : shell32!kfapi::CFolderCache::GetPath+0xb74

00000071`3fe4e030 00007ffd`41893540 : 00000071`3fe4e1c8 00000071`40cb16f0 00000071`40cb16f0 00000000`00000000 : shell32!kfapi::CKFFacade::GetFolderPath+0×120

00000071`3fe4e190 00007ffd`4189368c : 00000000`00008023 00007ffd`4382c0ae 00000000`00000000 00000071`3ef92bd0 : shell32!SHGetFolderPathEx+0×80

00000071`3fe4e200 00007ffd`40d61939 : 00000000`00000000 00000000`00000000 00007ffd`40dc3f80 00000000`00008023 : shell32!SHGetFolderPathWWorker+0xf9

00000071`3fe4e260 00007ffd`41a80fba : 00000000`00000000 00000000`00000000 00000071`3fe4e370 00000000`00000000 : KERNELBASE!SHGetFolderPathW+0×49

00000071`3fe4e2a0 00007ffd`40d7e60f : 00000000`00000000 00000071`3fe4e370 00000000`00000023 00000000`00000001 : shell32!SHGetSpecialFolderPathWWorker+0×23

00000071`3fe4e2e0 00000000`540b036d : 00000071`3fe4e630 00000000`00000001 00000000`00000000 00000071`3fe4e6b0 : KERNELBASE!SHGetSpecialFolderPathW+0×3f

00000071`3fe4e310 00000000`54096f45 : 00000071`3fe4e708 00000000`00000001 00000071`3fe4e6d8 00000000`53fd1903 : ModuleC+0xdca2d

ntdll!RtlpStackTraceDataBase is NULL. Probably the stack traces are not enabled.
0:000> ub 00007ffd`41894e14

shell32!kfapi::CFolderPathResolver::GetPath+0×145:

00007ffd`41894df1 498d5d30        lea     rbx,[r13+30h]

00007ffd`41894df5 48895c2468      mov     qword ptr [rsp+68h],rbx

00007ffd`41894dfa 4c897c2470      mov     qword ptr [rsp+70h],r15

00007ffd`41894dff 498bff          mov     rdi,r15

00007ffd`41894e02 4c897c2470      mov     qword ptr [rsp+70h],r15

00007ffd`41894e07 488975e0        mov     qword ptr [rbp-20h],rsi

00007ffd`41894e0b 488bce          mov     rcx,rsi

00007ffd`41894e0e ff159cbaa900    call    qword ptr [shell32!_imp_EnterCriticalSection (00007ffd`423308b0)]
0:000> ub 00007ffd`43827e40

ntdll!LdrpAcquireLoaderLock:

00007ffd`43827e14 4053            push    rbx

00007ffd`43827e16 4883ec30        sub     rsp,30h

00007ffd`43827e1a 488d0d4f8d0f00  lea     rcx,[ntdll!LdrpModuleEnumLock (00007ffd`43920b70)]

00007ffd`43827e21 e8ca040000      call    ntdll!RtlAcquireSRWLockShared (00007ffd`438282f0)

00007ffd`43827e26 803c258403fe7f00 cmp     byte ptr [SharedUserData+0×384 (00000000`7ffe0384)],0

00007ffd`43827e2e 0f85242c0700    jne     ntdll!LdrpAcquireLoaderLock+0×72c44 (00007ffd`4389aa58)

00007ffd`43827e34 488d0d6d5a0f00  lea     rcx,[ntdll!LdrpLoaderLock (00007ffd`4391d8a8)]

00007ffd`43827e3b e820000000      call    ntdll!RtlEnterCriticalSection (00007ffd`43827e60)
- Dmitry Vostokov @ DumpAnalysis.org + TraceAnalysis.org -