Insufficient stack memory may not result in Stack Overflow if there are internal thread checks or external watchdog threads. In some way this is a specialization of a more general Insufficient Memory (region) analysis pattern.
Consider this thread stack trace we see when we open a crash dump in WinDbg:
0:003> kc
# Call Site
00 EdgeContent!wil::details::ReportFailure
01 EdgeContent!wil::details::ReportFailure_Hr
02 EdgeContent!wil::details::in1diag3::FailFast_Hr
03 EdgeContent!`anonymous namespace'::MemoryLimitWatchdogThreadProc
04 kernel32!BaseThreadInitThunk
05 ntdll!RtlUserThreadStart
The reported error is related to general security checks and doesn’t reveal much:
0:003> .lastevent
Last event: 10e0.25fc: Security check failure or stack buffer overrun - code c0000409 (first/second chance not available)
debugger time: Sat Sep 29 21:30:31.531 2018 (UTC + 1:00)
However, from Stack Trace Motif we may infer that the failure was related to some memory limit.
When looking at Stack Trace Collection we notice the thread #11 which has the long sequence of frames:
11 Id: 10e0.d68 Suspend: 2 Teb: 000000ca`e96e3000 Unfrozen
# Call Site
00 ntdll!NtWaitForSingleObject
01 KERNELBASE!WaitForSingleObjectEx
02 Chakra!Memory::Recycler::WaitForConcurrentThread
03 Chakra!Memory::Recycler::FinishConcurrentCollect
04 Chakra!ThreadContext::ExecuteRecyclerCollectionFunction
05 Chakra!Memory::Recycler::FinishConcurrentCollectWrapped
06 Chakra!Memory::Recycler::LargeAlloc<0>
07 Chakra!Memory::Recycler::AllocLeaf
08 Chakra!Js::CompoundString::GetSz
09 Chakra!Js::JSONStringifier::ReadProperty
0a Chakra!Js::JSONStringifier::ReadObject
0b Chakra!Js::JSONStringifier::ReadProperty
0c Chakra!Js::JSONStringifier::Stringify
0d Chakra!JSON::Stringify
0e Chakra!amd64_CallFunction
0f Chakra!Js::InterpreterStackFrame::OP_CallCommon<Js::OpLayoutDynamicProfile<
Js::OpLayoutT_CallIWithICIndex<Js::LayoutSizePolicy<0> > > >
10 Chakra!Js::InterpreterStackFrame::ProcessUnprofiled
11 Chakra!Js::InterpreterStackFrame::Process
12 Chakra!Js::InterpreterStackFrame::InterpreterHelper
13 Chakra!Js::InterpreterStackFrame::InterpreterThunk
[...]
fa Chakra!ThreadContext::ExecuteImplicitCall<<
lambda_5a46706206cf607f01fe0fb33b6e8acf> >
fb Chakra!Js::DynamicObject::CallToPrimitiveFunction
fc Chakra!Js::DynamicObject::ToPrimitiveImpl<409>
fd Chakra!Js::DynamicObject::ToPrimitive
fe Chakra!Js::JavascriptConversion::OrdinaryToPrimitive
ff Chakra!Js::JavascriptConversion::MethodCallToPrimitive
It looks like the thread stack is really long that we suspect the possibility of overflow:
0:003> ~11kc 0xffff
[...]
c473 Chakra!amd64_CallFunction
c474 Chakra!Js::JavascriptFunction::CallFunction<1>
c475 Chakra!Js::JavascriptFunction::CallRootFunctionInternal
c476 Chakra!Js::JavascriptFunction::CallRootFunction
c477 Chakra!ScriptSite::CallRootFunction
c478 Chakra!ScriptSite::Execute
c479 Chakra!ScriptEngineBase::Execute
c47a edgehtml!CMutationObserver::PerformMicrotaskCheckpoint
c47b edgehtml!CObserverManager::InvokeObserversForCheckpoint
c47c edgehtml!CObserverManager::MicroTaskExecutionCallback
c47d edgehtml!HTML5TaskScheduler::RunReadiedTask
c47e edgehtml!HTML5TaskScheduler::PerformMicrotaskCheckpoint
c47f edgehtml!CJScript9Holder::ExecuteCallback
c480 edgehtml!CScriptTimer::ExecuteTimer
c481 edgehtml!CScriptTimerManager::OnTick
c482 edgehtml!CPaintAlignedTimerManager<CPaintBeat>::ProcessTimers
c483 edgehtml!CPaintBeat::OnProcessTimersTask
c484 edgehtml!GWndAsyncTask::Run
c485 edgehtml!HTML5TaskScheduler::RunReadiedTask
c486 edgehtml!TaskSchedulerBase::RunReadiedTasksInTaskQueueWithCallback
c487 edgehtml!HTML5TaskScheduler::RunReadiedTasks
c488 edgehtml!HTML5EventLoopDriver::DriveLowPriorityTaskExecution
c489 edgehtml!GlobalWndOnPaintPriorityMethodCall
c48a edgehtml!GlobalWndProc
c48b user32!FilteredProcessRedirectingWndProcW
c48c user32!UserCallWinProcCheckWow
c48d user32!DispatchClientMessage
c48e user32!_fnDWORD
c48f ntdll!KiUserCallbackDispatcherContinue
c490 win32u!NtUserDispatchMessage
c491 user32!DispatchMessageWorker
c492 EdgeContent!CBrowserTab::_TabWindowThreadProc
c493 EdgeContent!LCIETab_ThreadProc
c494 edgeIso!_IsoThreadProc_WrapperToReleaseScope
c495 kernel32!BaseThreadInitThunk
c496 ntdll!RtlUserThreadStart
However, the current stack pointer is the way above the stack region limit:
0:003> ~11s
ntdll!NtWaitForSingleObject+0x14:
00007ffa`b0d99f74 c3 ret
0:011> r rsp
rsp=000000caeb033348
0:011> !teb
TEB at 000000cae96e3000
ExceptionList: 0000000000000000
StackBase: 000000caeba00000
StackLimit: 000000caeb00b000
SubSystemTib: 0000000000000000
FiberData: 0000000000001e00
ArbitraryUserPointer: 0000000000000000
Self: 000000cae96e3000
EnvironmentPointer: 0000000000000000
ClientId: 00000000000010e0 . 0000000000000d68
RpcHandle: 0000000000000000
Tls Storage: 000001e915185590
PEB Address: 000000cae96a8000
LastErrorValue: 1455
LastStatusValue: c000012d
Count Owned Locks: 0
HardErrorMode: 0
The last error code shows possible Insufficient Memory (committed memory) pattern but there were enough space in the page file and the same crashes were observed in a much more spacious memory environments:
0:011> !error c000012d

Error code: (NTSTATUS) 0xc000012d (3221225773) - {Out of Virtual Memory}  Your system is low on virtual memory. To ensure that Windows runs properly, increase the size of your virtual memory paging file. For more information, see Help.
0:011> !error 0n1455

Error code: (Win32) 0x5af (1455) - The paging file is too small for this operation to complete.
When we look at a raw stack trace region though, we see it was used to the fullest:
0:011> dps 000000caeb00b000 L30

000000ca`eb00b000  00000000`00000000

000000ca`eb00b008  00000000`00000000

000000ca`eb00b010  00000000`00000000

000000ca`eb00b018  00000000`00000000

000000ca`eb00b020  00000000`00000000

000000ca`eb00b028  00000000`00000000

000000ca`eb00b030  00000000`00000000

000000ca`eb00b038  00000000`00000000

000000ca`eb00b040  00000000`00000000

000000ca`eb00b048  00000000`00000000

000000ca`eb00b050  00000000`00000000

000000ca`eb00b058  00000000`00000000

000000ca`eb00b060  00000000`00000000

000000ca`eb00b068  00000000`00000000

000000ca`eb00b070  00000000`00000000

000000ca`eb00b078  00000000`00000000

000000ca`eb00b080  00000000`00000000

000000ca`eb00b088  00000000`00000000

000000ca`eb00b090  00000000`00000000

000000ca`eb00b098  000001e9`258805c0

000000ca`eb00b0a0  00000000`00000000

000000ca`eb00b0a8  00000000`00000000

000000ca`eb00b0b0  00000000`00000131

000000ca`eb00b0b8  00007ffa`8de137a9 Chakra!Js::DictionaryTypeHandlerBase<unsigned>::GetProperty+0×119

000000ca`eb00b0c0  00000000`00000006

000000ca`eb00b0c8  000001e9`258805c0

000000ca`eb00b0d0  000001e9`258805c0

000000ca`eb00b0d8  000001e9`283d4e70

000000ca`eb00b0e0  000000ca`eb00b210

000000ca`eb00b0e8  00000000`00000000

000000ca`eb00b0f0  00000000`00000131

000000ca`eb00b0f8  000001f1`71863c70

000000ca`eb00b100  00007ffa`8e3cd468 Chakra!Js::BuiltInPropertyRecords::number

000000ca`eb00b108  00000000`00000000

000000ca`eb00b110  000001f1`71863c70

000000ca`eb00b118  000000ca`eb00b210

000000ca`eb00b120  000001e9`258805c0

000000ca`eb00b128  00007ffa`8de103d3 Chakra!Js::DynamicObject::GetPropertyQuery+0×53

000000ca`eb00b130  000001e9`24cc65b0

000000ca`eb00b138  000001e9`258805c0

000000ca`eb00b140  000001e9`258805c0

000000ca`eb00b148  00000000`00000131

000000ca`eb00b150  000000ca`eb00b210

000000ca`eb00b158  00000000`00000000

000000ca`eb00b160  000001f1`71863c70

000000ca`eb00b168  00000000`00000000

000000ca`eb00b170  00000000`00000000

000000ca`eb00b178  00007ffa`8df79864 Chakra!Js::JavascriptOperators::GetProperty_InternalSimple+0×64
We also see Execution Residue possibly indicating catch exception processing:
0:011> dpS 000000caeb00b000 L100

00007ffa`8de137a9 Chakra!Js::DictionaryTypeHandlerBase<unsigned short>::GetProperty+0x119

00007ffa`8e3cd468 Chakra!Js::BuiltInPropertyRecords::number

00007ffa`8de103d3 Chakra!Js::DynamicObject::GetPropertyQuery+0x53

00007ffa`8df79864 Chakra!Js::JavascriptOperators::GetProperty_InternalSimple+0x64

00007ffa`b0d470d0 ntdll!RtlSetLastWin32Error+0x40

00007ffa`b0d470d0 ntdll!RtlSetLastWin32Error+0x40

00007ffa`b048a5da msvcrt!getptd_noexit+0x6e

00007ffa`8dfb36d6 Chakra!`Js::JavascriptExceptionOperators::StackTraceAccessor'::`1'::catch$8

+0x50

00007ffa`b048a553 msvcrt!getptd+0xb

00007ffa`b045aad6 msvcrt!_DestructExceptionObject+0x46

00007ffa`b0463798 msvcrt!_CxxCallCatchBlock+0x1e8

00007ffa`8ddb6d54 Chakra!Js::JavascriptExceptionOperators::StackTraceAccessor+0x2a4

00007ffa`8e324798 Chakra!ValueType::PrimitiveOrObject+0xa80

00007ffa`8dfb3686 Chakra!`Js::JavascriptExceptionOperators::StackTraceAccessor'::`1'::catch$8

00007ffa`8dd20000 Chakra!_jscriptinfo_IID_Lookup <PERF> (Chakra+0x0)

00007ffa`b04635b0 msvcrt!_CxxCallCatchBlock

00007ffa`b0d9e2b3 ntdll!RcConsolidateFrames+0x3

00007ffa`8ddb6d54 Chakra!Js::JavascriptExceptionOperators::StackTraceAccessor+0x2a4

00007ffa`8de137a9 Chakra!Js::DictionaryTypeHandlerBase<unsigned short>::GetProperty+0x119

00007ffa`8e3cd468 Chakra!Js::BuiltInPropertyRecords::number

00007ffa`8de103d3 Chakra!Js::DynamicObject::GetPropertyQuery+0x53

00007ffa`8df79864 Chakra!Js::JavascriptOperators::GetProperty_InternalSimple+0x64

00007ffa`b0d470d0 ntdll!RtlSetLastWin32Error+0x40

00007ffa`b0d470d0 ntdll!RtlSetLastWin32Error+0x40

00007ffa`b048a5da msvcrt!getptd_noexit+0x6e

00007ffa`8dfb36d6 Chakra!`Js::JavascriptExceptionOperators::StackTraceAccessor'::`1'::catch$8

+0x50

00007ffa`b048a553 msvcrt!getptd+0xb

00007ffa`b045aad6 msvcrt!_DestructExceptionObject+0x46

00007ffa`b0463798 msvcrt!_CxxCallCatchBlock+0x1e8

00007ffa`8ddb6d54 Chakra!Js::JavascriptExceptionOperators::StackTraceAccessor+0x2a4
Another similar crash on a different machine with much more memory available had Active Thread Exception Stack Trace:
0:013> kc

# Call Site

00 ntdll!NtQueryWnfStateNameInformation

01 ntdll!SignalStartWerSvc

02 ntdll!SendMessageToWERService

03 ntdll!ReportExceptionInternal

04 kernel32!WerpReportFaultInternal

05 kernel32!WerpReportFault

06 KERNELBASE!UnhandledExceptionFilter

07 Chakra!FatalExceptionFilter

08 Chakra!ReportFatalException$filt$0

09 msvcrt!_C_specific_handler

0a ntdll!RtlpExecuteHandlerForException

0b ntdll!RtlDispatchException

0c ntdll!RtlRaiseException

0d KERNELBASE!RaiseException

0e Chakra!ReportFatalException

0f Chakra!OutOfMemory_fatal_error

10 Chakra!Js::Exception::RaiseIfScriptActive

11 Chakra!Js::Throw::OutOfMemory

12 Chakra!Memory::Recycler::LargeAlloc<0>

13 Chakra!Memory::Recycler::AllocLeaf

14 Chakra!Js::LazyJSONString::GetSz

15 Chakra!Js::CompoundString::AppendGeneric<Js::CompoundString>

16 Chakra!Js::JavascriptExceptionOperators::StackTraceAccessor

17 Chakra!Js::InlineCache::TryGetProperty<1,1,1,1,0>

18 Chakra!Js::CacheOperators::TryGetProperty<1,1,1,1,1,1,1,0,0>

19 Chakra!Js::JavascriptOperators::PatchGetValue<1,Js::InlineCache>

1a js!d.toString

[...]
which actually showed the Javascript URL:
0:013> .frame 1a

1a 00000037`4671e5e0 00007ffe`1753f1a1 js!d.toString [https://yastatic.net/awaps-ad-sdk-js-bundles/1.0-889/bundles/inpage.bundle.js @ 8,36454]
The stack region was also almost full with execution residue including exception catch processing. But this time it show “stack space” hint:
0:013> !teb

TEB at 00000037456dc000

ExceptionList:        0000000000000000

StackBase:            0000003747100000

StackLimit:           000000374670a000

SubSystemTib:         0000000000000000

FiberData:            0000000000001e00

ArbitraryUserPointer: 0000000000000000

Self:                 00000037456dc000

EnvironmentPointer:   0000000000000000

ClientId:             0000000000005914 . 0000000000001150

RpcHandle:            0000000000000000

Tls Storage:          000001a5bcfd88d0

PEB Address:          00000037456bd000

LastErrorValue:       0

LastStatusValue:      c000012d

Count Owned Locks:    0

HardErrorMode:        0
0:013> s-su 000000374670a000 00000037`46720000

[…]

00000037`4670d210  “tack space”

[…]
Note: Regardless of the actual root cause and mechanism for these crash dumps, such stack region monitoring can also be used for software prognostics purposes.
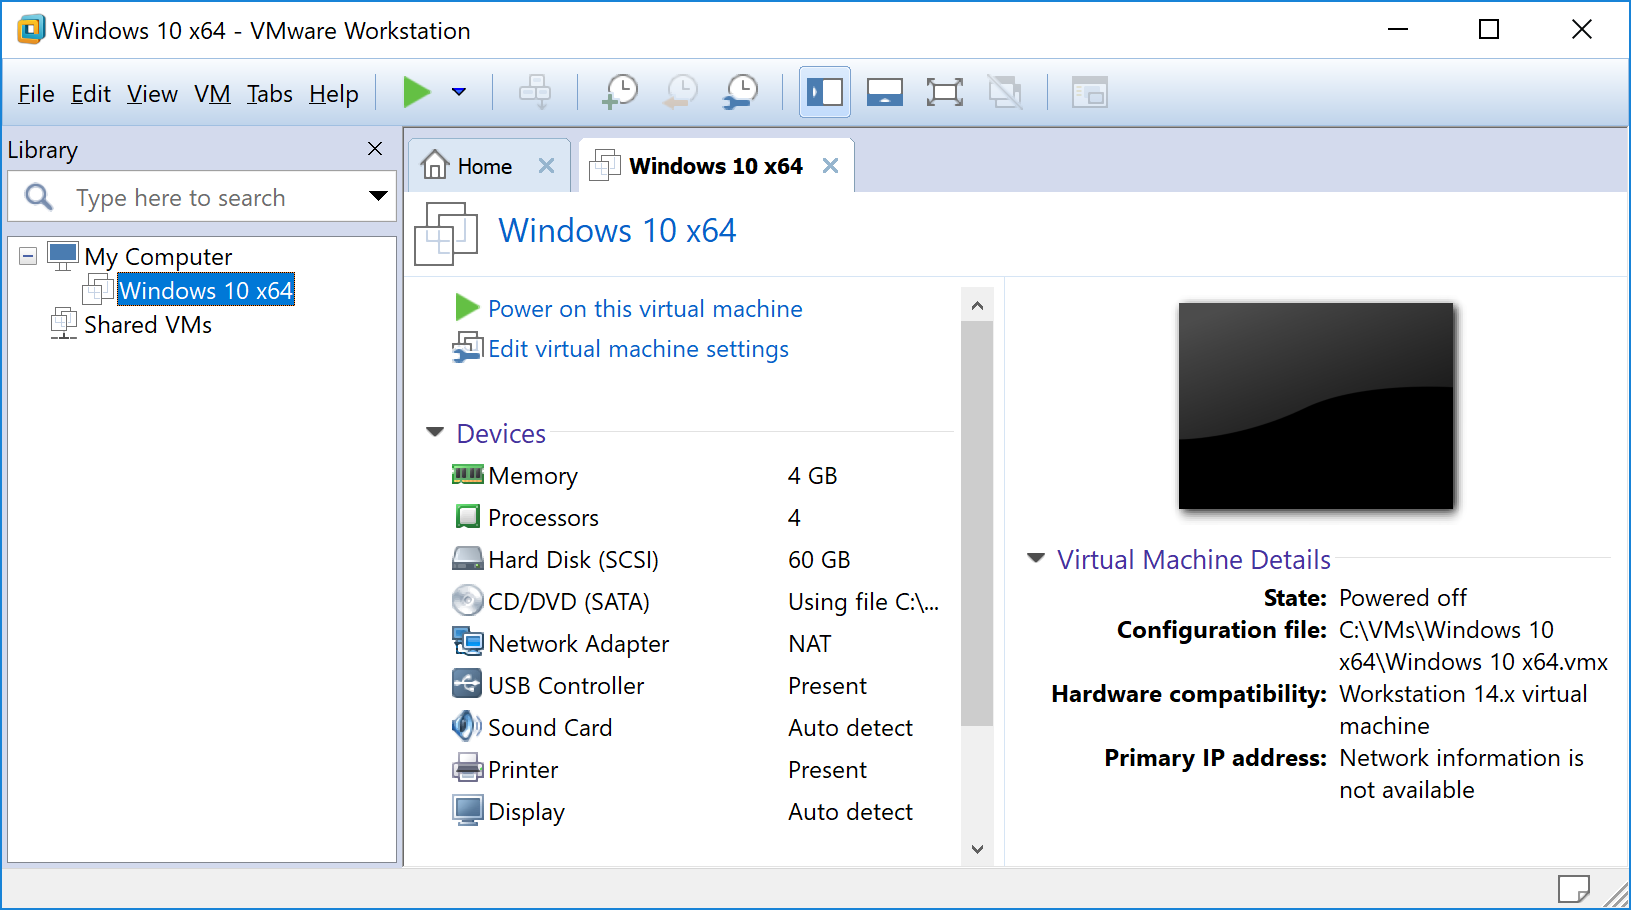
The example dump can be downloaded from here.
- Dmitry Vostokov @ DumpAnalysis.org + TraceAnalysis.org -