The Sector of Crash Dump Analysis Posts
Saturday, December 20th, 2008Just noticed today that the number of posts in crash dump category became 512:

Of course, with this post, it is now 513.
- Dmitry Vostokov @ DumpAnalysis.org -
Just noticed today that the number of posts in crash dump category became 512:

Of course, with this post, it is now 513.
- Dmitry Vostokov @ DumpAnalysis.org -
In one system even Task Manager was hanging and forced complete memory dump reveals a blocked GUI dialog thread waiting for an LPC reply:
THREAD fffffade69e36310 Cid 4b30.4f34 Teb: 000007fffffde000 Win32Thread: fffff97ff3f97620 WAIT: (Unknown) UserMode Non-Alertable
fffffade69e36678 Semaphore Limit 0x1
Waiting for reply to LPC MessageId a7531ec4:
Current LPC port fffffa8007118190
Not impersonating
DeviceMap fffffa80021c6240
Owning Process fffffadee0332040 Image: taskmgr.exe
Wait Start TickCount 80209499 Ticks: 5596 (0:00:01:27.437)
Context Switch Count 173 LargeStack
UserTime 00:00:00.000
KernelTime 00:00:00.031
Win32 Start Address taskmgr!wWinMainCRTStartup (0×000000010001bfe0)
Start Address kernel32!BaseProcessStart (0×0000000077d59620)
Stack Init fffffad7c6e5ae00 Current fffffad7c6e5a8e0
Base fffffad7c6e5b000 Limit fffffad7c6e52000 Call 0
Priority 14 BasePriority 13 PriorityDecrement 0
Child-SP RetAddr Call Site
fffffad7`c6e5a920 fffff800`01027752 nt!KiSwapContext+0×85
fffffad7`c6e5aaa0 fffff800`0102835e nt!KiSwapThread+0×3c9
fffffad7`c6e5ab00 fffff800`01283ebb nt!KeWaitForSingleObject+0×5a6
fffffad7`c6e5ab80 fffff800`0102e3fd nt!NtRequestWaitReplyPort+0xa60
fffffad7`c6e5ac70 00000000`77ef0c0a nt!KiSystemServiceCopyEnd+0×3 (TrapFrame @ fffffad7`c6e5ac70)
00000000`000adef8 000007ff`7fd6df46 ntdll!ZwRequestWaitReplyPort+0xa
00000000`000adf00 000007ff`7fd6e17f RPCRT4!LRPC_CCALL::SendReceive+0×447
00000000`000adfe0 000007ff`7fe974c8 RPCRT4!NdrSendReceive+0xf6
00000000`000ae010 000007ff`7fe975bd RPCRT4!NdrpClientCall2+0×7e2
00000000`000ae5f0 000007ff`7d4d8a0d RPCRT4!NdrClientCall2+0×1d
00000000`000ae620 00000001`00011029 WINSTA!WinStationGetProcessSid+0xfd
00000000`000ae6a0 00000001`00010e3b taskmgr!CProcInfo::SetProcessUsername+0×189
00000000`000ae930 00000001`000118e9 taskmgr!CProcInfo::SetData+0×53b
00000000`000aebb0 00000001`000122f4 taskmgr!CProcPage::UpdateProcInfoArray+0×449
00000000`000aee70 00000001`00013eab taskmgr!CProcPage::TimerEvent+0×14
00000000`000aeea0 00000001`00004e8f taskmgr!CProcPage::Initialize+0×29b
00000000`000af320 00000001`000070e8 taskmgr!MainWnd_OnInitDialog+0×2ff
00000000`000af620 00000000`77c34582 taskmgr!MainWindowProc+0×3f8
00000000`000af680 00000000`77c34bf2 USER32!UserCallDlgProcCheckWow+0×210
00000000`000af760 00000000`77c2ff5f USER32!DefDlgProcWorker+0xf6
00000000`000af7f0 00000000`77c29beb USER32!InternalCreateDialog+0×16a7
00000000`000af980 00000001`00007c97 USER32!CreateDialogParamW+0xab
00000000`000afa00 00000001`0001c24b taskmgr!wWinMain+0×5f7
00000000`000afed0 00000000`77d5964c taskmgr!wWinMainCRTStartup+0×26b
00000000`000aff80 00000000`00000000 kernel32!BaseProcessStart+0×29
We search for that LPC message:
6: kd> !lpc message a7531ec4
Searching message a7531ec4 in threads ...
Server thread fffffade6b8cf7a0 is working on message a7531ec4
Client thread fffffade69e36310 waiting a reply from a7531ec4
[…]
and then examine the corresponding server thread (for visual clarity only 1 argument is shown for each function call):
6: kd> !thread fffffade6b8cf7a0 16
THREAD fffffade6b8cf7a0 Cid 0238.8ff4 Teb: 000007fffff48000 Win32Thread: 0000000000000000 WAIT: (Unknown) UserMode Non-Alertable
fffffade6f2e93c0 SynchronizationEvent
Impersonation token: fffffa8013a17700 (Level Impersonation)
DeviceMap fffffa80021c6240
Owning Process fffffade6f337040 Image: svchost.exe
Wait Start TickCount 80209499 Ticks: 5596 (0:00:01:27.437)
Context Switch Count 40138
UserTime 00:00:00.140
KernelTime 00:00:00.312
Win32 Start Address 0×00000000a7531ec4
LPC Server thread working on message Id a7531ec4
Start Address kernel32!BaseThreadStart (0×0000000077d6b6a0)
Stack Init fffffad867f5ae00 Current fffffad867f5a950
Base fffffad867f5b000 Limit fffffad867f55000 Call 0
Priority 13 BasePriority 8 PriorityDecrement 0
Child-SP RetAddr : Args to Child : Call Site
fffffad8`67f5a990 fffff800`01027752 : fffffa80`071181f0 : nt!KiSwapContext+0×85
fffffad8`67f5ab10 fffff800`0102835e : 00000000`00000000 : nt!KiSwapThread+0×3c9
fffffad8`67f5ab70 fffff800`0127f03f : 00000000`00000000 : nt!KeWaitForSingleObject+0×5a6
fffffad8`67f5abf0 fffff800`0102e3fd : fffffade`6b8cf7a0 : nt!NtWaitForSingleObject+0xc1
fffffad8`67f5ac70 00000000`77ef0a2a : 00000000`77efb9a6 : nt!KiSystemServiceCopyEnd+0×3 (TrapFrame @ fffffad8`67f5ac70)
00000000`04d0f098 00000000`77efb9a6 : 00000000`00000000 : ntdll!NtWaitForSingleObject+0xa
00000000`04d0f0a0 00000000`77efba10 : 000007ff`7b8c3500 : ntdll!RtlpWaitOnCriticalSection+0×240
00000000`04d0f120 000007ff`7b887042 : 00000000`04d0f300 : ntdll!RtlEnterCriticalSection+0xa9
[…]
00000000`04d0f190 000007ff`7fe96cc9 : 00000000`00000048 : RPCRT4!Invoke+0×65
00000000`04d0f210 000007ff`7fe9758d : 00000000`04d0f8f0 : RPCRT4!NdrStubCall2+0×54d
00000000`04d0f7d0 000007ff`7fd697b4 : 00000000`0450a8fd : RPCRT4!NdrServerCall2+0×1d
00000000`04d0f800 000007ff`7fd6990d : 00000000`00377aa0 : RPCRT4!DispatchToStubInCNoAvrf+0×14
00000000`04d0f830 000007ff`7fd69766 : 00000000`00000001 : RPCRT4!RPC_INTERFACE::DispatchToStubWorker+0×50d
00000000`04d0f9a0 000007ff`7fd6b214 : 00000000`06c18ba0 : RPCRT4!RPC_INTERFACE::DispatchToStub+0×2ec
00000000`04d0fa20 000007ff`7fd6b9e3 : 00000000`06c18ba0 : RPCRT4!LRPC_SCALL::DealWithRequestMessage+0×63b
00000000`04d0fae0 000007ff`7fd7007c : 00000000`048348a0 : RPCRT4!LRPC_ADDRESS::DealWithLRPCRequest+0×3bf
00000000`04d0fba0 000007ff`7fd45369 : 00000000`0525fd30 : RPCRT4!LRPC_ADDRESS::ReceiveLotsaCalls+0×710
00000000`04d0feb0 000007ff`7fd65996 : 00000000`00000000 : RPCRT4!RecvLotsaCallsWrapper+0×9
00000000`04d0fee0 000007ff`7fd65d51 : 00000000`0492de90 : RPCRT4!BaseCachedThreadRoutine+0xde
00000000`04d0ff50 00000000`77d6b6da : 00000000`77d6b6a0 : RPCRT4!ThreadStartRoutine+0×21
00000000`04d0ff80 00000000`00000000 : 00000000`00000000 : kernel32!BaseThreadStart+0×3a
We see the thread above is waiting for a critical section and we examine it using !cs WinDbg extension command after switching to the process context of that thread:
6: kd> .process /r /p fffffade6f337040
Implicit process is now fffffade`6f337040
Loading User Symbols
6: kd> !cs 000007ff`7b8c3500
Critical section = 0×000007ff7b8c3500 (DllA!Lock+0×0)
DebugInfo = 0×00000000000ffea0
LOCKED
LockCount = 0×8
WaiterWoken = No
OwningThread = 0×0000000000004100
RecursionCount = 0×1
LockSemaphore = 0×8E0
SpinCount = 0×0000000000000000
From the output we know the critical section owner thread and examine it too (function call arguments are not shown for visual clarity):
6: kd> !thread -t 4100 16
Looking for thread Cid = 4100 …
THREAD fffffade6b9df4f0 Cid 0238.4100 Teb: 000007fffff58000 Win32Thread: 0000000000000000 WAIT: (Unknown) UserMode Non-Alertable
fffffadff5edadc0 Mutant - owning thread fffffadfe2486bf0
Impersonation token: fffffa8010197250 (Level Impersonation)
Owning Process fffffade6f337040 Image: svchost.exe
Wait Start TickCount 79672315 Ticks: 542780 (0:02:21:20.937)
Context Switch Count 174
UserTime 00:00:00.000
KernelTime 00:00:00.000
Win32 Start Address 0×00000000a75007ac
LPC Server thread working on message Id a75007ac
Start Address kernel32!BaseThreadStart (0×0000000077d6b6a0)
Stack Init fffffad83a94ee00 Current fffffad83a94e950
Base fffffad83a94f000 Limit fffffad83a949000 Call 0
Priority 8 BasePriority 8 PriorityDecrement 0
Kernel stack not resident.
Child-SP RetAddr : Call Site
fffffad8`3a94e990 fffff800`01027752 : nt!KiSwapContext+0×85
fffffad8`3a94eb10 fffff800`0102835e : nt!KiSwapThread+0×3c9
fffffad8`3a94eb70 fffff800`0127f03f : nt!KeWaitForSingleObject+0×5a6
fffffad8`3a94ebf0 fffff800`0102e3fd : nt!NtWaitForSingleObject+0xc1
fffffad8`3a94ec70 00000000`77ef0a2a : nt!KiSystemServiceCopyEnd+0×3 (TrapFrame @ fffffad8`3a94ec70)
00000000`03c8efa8 000007ff`7b880427 : ntdll!NtWaitForSingleObject+0xa
[…]
00000000`03c8f1a0 000007ff`7fe96cc9 : RPCRT4!Invoke+0×65
00000000`03c8f210 000007ff`7fe9758d : RPCRT4!NdrStubCall2+0×54d
00000000`03c8f7d0 000007ff`7fd697b4 : RPCRT4!NdrServerCall2+0×1d
00000000`03c8f800 000007ff`7fd6990d : RPCRT4!DispatchToStubInCNoAvrf+0×14
00000000`03c8f830 000007ff`7fd69766 : RPCRT4!RPC_INTERFACE::DispatchToStubWorker+0×50d
00000000`03c8f9a0 000007ff`7fd6b214 : RPCRT4!RPC_INTERFACE::DispatchToStub+0×2ec
00000000`03c8fa20 000007ff`7fd6b9e3 : RPCRT4!LRPC_SCALL::DealWithRequestMessage+0×63b
00000000`03c8fae0 000007ff`7fd7007c : RPCRT4!LRPC_ADDRESS::DealWithLRPCRequest+0×3bf
00000000`03c8fba0 000007ff`7fd45369 : RPCRT4!LRPC_ADDRESS::ReceiveLotsaCalls+0×710
00000000`03c8feb0 000007ff`7fd65996 : RPCRT4!RecvLotsaCallsWrapper+0×9
00000000`03c8fee0 000007ff`7fd65d51 : RPCRT4!BaseCachedThreadRoutine+0xde
00000000`03c8ff50 00000000`77d6b6da : RPCRT4!ThreadStartRoutine+0×21
00000000`03c8ff80 00000000`00000000 : kernel32!BaseThreadStart+0×3a
We see that it is waiting for a mutant and examine its owner thread:
6: kd> !thread fffffadfe2486bf0 16
THREAD fffffadfe2486bf0 Cid 0238.7010 Teb: 000007fffff5e000 Win32Thread: 0000000000000000 WAIT: (Unknown) UserMode Non-Alertable
fffffadfe2486f58 Semaphore Limit 0x1
Waiting for reply to LPC MessageId a7507485:
Current LPC port fffffa8006822c80
Not impersonating
DeviceMap fffffa8000003790
Owning Process fffffade6f337040 Image: svchost.exe
Wait Start TickCount 79744596 Ticks: 470499 (0:02:02:31.546)
Context Switch Count 29636
UserTime 00:00:00.062
KernelTime 00:00:00.156
Win32 Start Address 0×00000000a74ff6e4
LPC Server thread working on message Id a74ff6e4
Start Address kernel32!BaseThreadStart (0×0000000077d6b6a0)
Stack Init fffffad7d98a0e00 Current fffffad7d98a08e0
Base fffffad7d98a1000 Limit fffffad7d989b000 Call 0
Priority 13 BasePriority 8 PriorityDecrement 0
Kernel stack not resident.
Child-SP RetAddr : Call Site
fffffad7`d98a0920 fffff800`01027752 : nt!KiSwapContext+0×85
fffffad7`d98a0aa0 fffff800`0102835e : nt!KiSwapThread+0×3c9
fffffad7`d98a0b00 fffff800`01283ebb : nt!KeWaitForSingleObject+0×5a6
fffffad7`d98a0b80 fffff800`0102e3fd : nt!NtRequestWaitReplyPort+0xa60
fffffad7`d98a0c70 00000000`77ef0c0a : nt!KiSystemServiceCopyEnd+0×3 (TrapFrame @ fffffad7`d98a0c70)
00000000`0430dc18 000007ff`7fd6df46 : ntdll!ZwRequestWaitReplyPort+0xa
00000000`0430dc20 000007ff`7fd6e17f : RPCRT4!LRPC_CCALL::SendReceive+0×447
00000000`0430dd10 000007ff`7fe974c8 : RPCRT4!NdrSendReceive+0xf6
00000000`0430dd40 000007ff`7fe975bd : RPCRT4!NdrpClientCall2+0×7e2
00000000`0430e320 00000000`676b1dd7 : RPCRT4!NdrClientCall2+0×1d
[…]
The thread above is waiting for an LPC message and we examine its corresponding server thread:
6: kd> !lpc message a7507485
Searching message a7507485 in threads ...
Client thread fffffadfe2486bf0 waiting a reply from a7507485
Server thread fffffade6f3c9720 is working on message a7507485
[...]
6: kd> !thread fffffade6f3c9720 16
THREAD fffffade6f3c9720 Cid 6308.a1c8 Teb: 000000007ef24000 Win32Thread: 0000000000000000 WAIT: (Unknown) UserMode Non-Alertable
fffffade68d31a40 SynchronizationEvent
Not impersonating
DeviceMap fffffa80016ce1b0
Owning Process fffffade69c29430 Image: AppA.exe
Wait Start TickCount 79744596 Ticks: 470499 (0:02:02:31.546)
Context Switch Count 7230
UserTime 00:00:00.218
KernelTime 00:00:00.109
Win32 Start Address 0×00000000a7507485
LPC Server thread working on message Id a7507485
Start Address kernel32!BaseThreadStartThunk (0×000000007d4d1504)
Stack Init fffffad83f7e4e00 Current fffffad83f7e4950
Base fffffad83f7e5000 Limit fffffad83f7df000 Call 0
Priority 9 BasePriority 8 PriorityDecrement 0
Kernel stack not resident.
Child-SP RetAddr : Call Site
fffffad8`3f7e4990 fffff800`01027752 : nt!KiSwapContext+0×85
fffffad8`3f7e4b10 fffff800`0102835e : nt!KiSwapThread+0×3c9
fffffad8`3f7e4b70 fffff800`0127f03f : nt!KeWaitForSingleObject+0×5a6
fffffad8`3f7e4bf0 fffff800`0102e3fd : nt!NtWaitForSingleObject+0xc1
fffffad8`3f7e4c70 00000000`78b842d9 : nt!KiSystemServiceCopyEnd+0×3 (TrapFrame @ fffffad8`3f7e4c70)
00000000`0257f108 00000000`78b840e5 : wow64cpu!CpupSyscallStub+0×9
00000000`0257f110 00000000`6b006a5a : wow64cpu!Thunk0ArgReloadState+0×1a
00000000`0257f180 00000000`6b005e0d : wow64!RunCpuSimulation+0xa
00000000`0257f1b0 00000000`77f109f0 : wow64!Wow64LdrpInitialize+0×2ed
00000000`0257f6f0 00000000`77ef30a5 : ntdll!LdrpInitialize+0×2aa
00000000`0257f7d0 00000000`7d4d1504 : ntdll!KiUserApcDispatcher+0×15 (TrapFrame @ 00000000`0257fb38)
00000000`0257fcc8 00000000`00000000 : kernel32!BaseThreadStartThunk
We see the thread belongs to a virtualized WOW64 process and presently I’m not aware of how to get its 32-bit stacks from complete memory dumps. WOW64 extensions seems only working in process user dumps. Therefore I recommended to get a userdump of AppA process using 32-bit version of userdump.exe as soon as the same condition starts surfacing again.
- Dmitry Vostokov @ DumpAnalysis.org -
Now its time to write about wait chains involving LPC calls. These chains are easily identified by searching for “Waiting for reply to LPC MessageId” in the output of !process 0 ff command or if we know that some specific process is hanging and see that message in its thread information output. For example, in one kernel memory dump taken when AppA was hanging we see this example of Blocked Thread pattern:
7: kd> !process 88556778 ff
PROCESS 88556778 SessionId: 0 Cid: 1f88 Peb: 7ffdc000 ParentCid: 0f74
DirBase: 96460000 ObjectTable: e65a5348 HandleCount: 80.
Image: AppA.exe
VadRoot 870d2208 Vads 54 Clone 0 Private 234. Modified 0. Locked 0.
DeviceMap e22ba7c0
Token e5e47cf0
ElapsedTime 00:04:44.017
UserTime 00:00:00.000
KernelTime 00:00:00.000
QuotaPoolUsage[PagedPool] 20092
QuotaPoolUsage[NonPagedPool] 2160
Working Set Sizes (now,min,max) (748, 50, 345) (2992KB, 200KB, 1380KB)
PeakWorkingSetSize 748
VirtualSize 16 Mb
PeakVirtualSize 16 Mb
PageFaultCount 810
MemoryPriority BACKGROUND
BasePriority 8
CommitCharge 252
PEB NULL...
THREAD 8861aab8 Cid 1f88.1bd4 Teb: 7ffdf000 Win32Thread: bc161ea8 WAIT: (Unknown) UserMode Non-Alertable
8861aca4 Semaphore Limit 0x1
Waiting for reply to LPC MessageId 00037bb2:
Current LPC port e625bbd0
Not impersonating
DeviceMap e22ba7c0
Owning Process 88556778 Image: AppA.exe
Wait Start TickCount 426549 Ticks: 18176 (0:00:04:44.000)
Context Switch Count 76 LargeStack
UserTime 00:00:00.000
KernelTime 00:00:00.000
Win32 Start Address 0×010043ab
Start Address 0×77e617f8
Stack Init bab4b000 Current bab4ac08 Base bab4b000 Limit bab47000 Call 0
Priority 11 BasePriority 8 PriorityDecrement 2
Kernel stack not resident.
ChildEBP RetAddr
bab4ac20 8083d5b1 nt!KiSwapContext+0×26
bab4ac4c 8083df9e nt!KiSwapThread+0×2e5
bab4ac94 8093eda1 nt!KeWaitForSingleObject+0×346
bab4ad50 80833bef nt!NtRequestWaitReplyPort+0×776
bab4ad50 7c8285ec nt!KiFastCallEntry+0xfc
Now we look for a server thread processing the message 00037bb2:
7: kd> !lpc message 00037bb2
Searching message 37bb2 in threads ...
Server thread 89815db0 is working on message 37bb2
Client thread 8861aab8 waiting a reply from 37bb2
Searching thread 8861aab8 in port rundown queues …
Server communication port 0xe1216be8
Handles: 1 References: 1
The LpcDataInfoChainHead queue is empty
Connected port: 0xe625bbd0 Server connection port: 0xe1323f68
Client communication port 0xe625bbd0
Handles: 1 References: 2
The LpcDataInfoChainHead queue is empty
Server connection port e1323f68 Name: ApiABC
Handles: 1 References: 43
Server process : 887d32d0 (svchost.exe)
Queue semaphore : 884df210
Semaphore state 0 (0x0)
The message queue is empty
Messages in LpcDataInfoChainHead:
0000 e6067418 - Busy Id=00020695 From: 0224.134c Context=80050003 [e1323fe8 . e65fa5a8]
Length=0044002c Type=00380001 (LPC_REQUEST)
Data: 00000001 00050242 00000000 00000000 00000000 00000000
0000 e65fa5a8 - Busy Id=0002e1dd From: 0fd8.0fe0 Context=80110002 [e6067418 . e5f6a360]
Length=0044002c Type=00380001 (LPC_REQUEST)
Data: 00000001 00050242 c03007fc c01fff7c 00000000 80a84456
0000 e5f6a360 - Busy Id=00037bb2 From: 1f88.1bd4 Context=8017000f [e65fa5a8 . e1323fe8]
Length=0044002c Type=00380001 (LPC_REQUEST)
Data: 00000001 00050242 88572278 88572290 8a386990 000015e7
The LpcDataInfoChainHead queue contains 3 messages
Threads in RunDown queue : 0xe6067258 0xe65fa3e8 0xe5f6a1a0
Done.
7: kd> !thread 89815db0
THREAD 89815db0 Cid 1218.0c00 Teb: 7ff8f000 Win32Thread: 00000000 WAIT: (Unknown) UserMode Non-Alertable
88603e40 Mutant - owning thread 884d7db0
Not impersonating
DeviceMap e10018b8
Owning Process 887d32d0 Image: svchost.exe
Wait Start TickCount 426549 Ticks: 18176 (0:00:04:44.000)
Context Switch Count 42
UserTime 00:00:00.000
KernelTime 00:00:00.000
Win32 Start Address 0×00037bb2
LPC Server thread working on message Id 37bb2
Start Address 0×77e617ec
Stack Init f60e0000 Current f60dfc60 Base f60e0000 Limit f60dd000 Call 0
Priority 9 BasePriority 8 PriorityDecrement 0
Kernel stack not resident.
ChildEBP RetAddr Args to Child
f60dfc78 8083d5b1 89815db0 89815e58 00000006 nt!KiSwapContext+0×26
f60dfca4 8083df9e 00000000 00000000 00000000 nt!KiSwapThread+0×2e5
f60dfcec 8092ae57 88603e40 00000006 00000001 nt!KeWaitForSingleObject+0×346
f60dfd50 80833bef 000004fc 00000000 00000000 nt!NtWaitForSingleObject+0×9a
f60dfd50 7c8285ec 000004fc 00000000 00000000 nt!KiFastCallEntry+0xfc
We see that it is blocked waiting for a synchronization object (mutant, shown in magenta above) and we check the thread 884d7db0 that owns it:
7: kd> !thread 884d7db0
THREAD 884d7db0 Cid 1218.12ec Teb: 7ffdd000 Win32Thread: 00000000 WAIT: (Unknown) UserMode Non-Alertable
884d7f9c Semaphore Limit 0x1
Waiting for reply to LPC MessageId 0000fa9e:
Current LPC port e121fdb8
Not impersonating
DeviceMap e10018b8
Owning Process 887d32d0 Image: svchost.exe
Wait Start TickCount 11800 Ticks: 432925 (0:01:52:44.453)
Context Switch Count 111
UserTime 00:00:00.000
KernelTime 00:00:00.000
Win32 Start Address 0×0000fa9b
LPC Server thread working on message Id fa9b
Start Address 0×77e617ec
Stack Init f4598000 Current f4597c08 Base f4598000 Limit f4595000 Call 0
Priority 9 BasePriority 8 PriorityDecrement 0
Kernel stack not resident.
ChildEBP RetAddr Args to Child
f4597c20 8083d5b1 884d7db0 884d7e58 00000007 nt!KiSwapContext+0×26
f4597c4c 8083df9e 884d7f9c 884d7f70 884d7db0 nt!KiSwapThread+0×2e5
f4597c94 8093eda1 884d7f9c 00000011 80930901 nt!KeWaitForSingleObject+0×346
f4597d50 80833bef 00000560 000ebfe0 000ebfe0 nt!NtRequestWaitReplyPort+0×776
f4597d50 7c8285ec 00000560 000ebfe0 000ebfe0 nt!KiFastCallEntry+0xfc
The thread is waiting for the LPC message 0000fa9e and we look for a server thread processing it:
7: kd> !thread 898c6db0
THREAD 898c6db0 Cid 0b38.188c Teb: 7ff4d000 Win32Thread: 00000000 WAIT: (Unknown) UserMode Non-Alertable
884362c8 SynchronizationEvent
Not impersonating
DeviceMap e11399e8
Owning Process 88340758 Image: AppB.exe
Wait Start TickCount 11801 Ticks: 432924 (0:01:52:44.437)
Context Switch Count 7
UserTime 00:00:00.000
KernelTime 00:00:00.000
Win32 Start Address 0x0000fa9e
LPC Server thread working on message Id fa9e
Start Address 0x77e617ec
Stack Init f5138000 Current f5137c60 Base f5138000 Limit f5135000 Call 0
Priority 9 BasePriority 8 PriorityDecrement 0
Kernel stack not resident.
ChildEBP RetAddr Args to Child
f5137c78 8083d5b1 898c6db0 898c6e58 00000006 nt!KiSwapContext+0x26
f5137ca4 8083df9e 00000000 00000000 00000000 nt!KiSwapThread+0x2e5
f5137cec 8092ae57 884362c8 00000006 00000001 nt!KeWaitForSingleObject+0x346
f5137d50 80833bef 0000056c 00000000 00000000 nt!NtWaitForSingleObject+0x9a
f5137d50 7c8285ec 0000056c 00000000 00000000 nt!KiFastCallEntry+0xfc
We also see that the thread 884d7db0 was working on message fa9b (shown in blue above) and therefore we can find its client thread:
7: kd> !lpc message fa9b
Searching message fa9b in threads ...
Server thread 884d7db0 is working on message fa9b
Client thread 871ab9a0 waiting a reply from fa9b
Searching thread 871ab9a0 in port rundown queues …
Server communication port 0xe23f68b8
Handles: 1 References: 1
The LpcDataInfoChainHead queue is empty
Connected port: 0xe1325c10 Server connection port: 0xe1323f68
Client communication port 0xe1325c10
Handles: 1 References: 2
The LpcDataInfoChainHead queue is empty
Server connection port e1323f68 Name: ApiABC
Handles: 1 References: 43
Server process : 887d32d0 (svchost.exe)
Queue semaphore : 884df210
Semaphore state 0 (0x0)
The message queue is empty
Messages in LpcDataInfoChainHead:
0000 e6067418 - Busy Id=00020695 From: 0224.134c Context=80050003 [e1323fe8 . e65fa5a8]
Length=0044002c Type=00380001 (LPC_REQUEST)
Data: 00000001 00050242 00000000 00000000 00000000 00000000
0000 e65fa5a8 - Busy Id=0002e1dd From: 0fd8.0fe0 Context=80110002 [e6067418 . e5f6a360]
Length=0044002c Type=00380001 (LPC_REQUEST)
Data: 00000001 00050242 c03007fc c01fff7c 00000000 80a84456
0000 e5f6a360 - Busy Id=00037bb2 From: 1f88.1bd4 Context=8017000f [e65fa5a8 . e1323fe8]
Length=0044002c Type=00380001 (LPC_REQUEST)
Data: 00000001 00050242 88572278 88572290 8a386990 000015e7
The LpcDataInfoChainHead queue contains 3 messages
Threads in RunDown queue : 0xe6067258 0xe65fa3e8 0xe5f6a1a0
Done.
7: kd> !thread 871ab9a0
THREAD 871ab9a0 Cid 180c.1810 Teb: 7ffdf000 Win32Thread: bc011008 WAIT: (Unknown) UserMode Non-Alertable
871abb8c Semaphore Limit 0x1
Waiting for reply to LPC MessageId 0000fa9b:
Current LPC port e1325c10
Not impersonating
DeviceMap e10018b8
Owning Process 8963c388 Image: AppC.exe
Wait Start TickCount 11796 Ticks: 432929 (0:01:52:44.515)
Context Switch Count 540 LargeStack
UserTime 00:00:00.046
KernelTime 00:00:00.062
Start Address 0x0103e1b0
Stack Init f68a4000 Current f68a3c08 Base f68a4000 Limit f689f000 Call 0
Priority 15 BasePriority 15 PriorityDecrement 0
Kernel stack not resident.
ChildEBP RetAddr Args to Child
f68a3c20 8083d5b1 871ab9a0 871aba48 00000004 nt!KiSwapContext+0x26
f68a3c4c 8083df9e 871abb8c 871abb60 871ab9a0 nt!KiSwapThread+0x2e5
f68a3c94 8093eda1 871abb8c 00000011 e24f0401 nt!KeWaitForSingleObject+0x346
f68a3d50 80833bef 00000150 0007fc70 0007fc70 nt!NtRequestWaitReplyPort+0x776
f68a3d50 7c8285ec 00000150 0007fc70 0007fc70 nt!KiFastCallEntry+0xfc
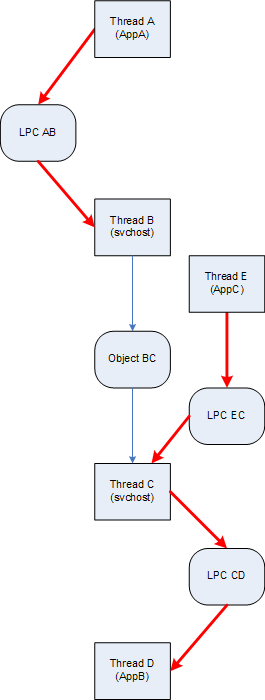
Finally we can draw this wait chain diagram where LPC calls are shown as red arrows:
- Dmitry Vostokov @ DumpAnalysis.org -
Sometimes a memory dump is not useful because of missing memory space, hence the name of this anti-pattern: Missing Space. This usually happens for non-bugcheck type issues like CPU spikes, application or session hangs where user space analysis is needed. Here is an example of Spiking Thread pattern in a kernel memory dump where analysis cannot be done because threads were spiking mostly in user space not included in kernel memory dumps:
Loading Dump File [MEMORY.DMP]
Kernel Summary Dump File: Only kernel address space is available
1: kd> !running
System Processors 3 (affinity mask)
Idle Processors 0
Prcb Current Next
0 ffdff120 88d14b40 ................
1 f7737120 891dddb0 ................
1: kd> !thread 88d14b40
THREAD 88d14b40 Cid 02b0.5298 Teb: 7ff7b000 Win32Thread: 00000000 RUNNING on processor 0
IRP List:
87e3ad50: (0006,0094) Flags: 00000900 Mdl: 00000000
8a8485f8: (0006,0094) Flags: 00000900 Mdl: 00000000
Not impersonating
DeviceMap e1001878
Owning Process 8a9831a8 Image: ApplicationA.exe
Wait Start TickCount 1282379 Ticks: 0
Context Switch Count 2950
UserTime 00:00:15.109
KernelTime 00:00:00.125
Win32 Start Address 0×77c7b0f5
Start Address 0×77e617ec
Stack Init ae302000 Current ae301c38 Base ae302000 Limit ae2ff000 Call 0
Priority 11 BasePriority 10 PriorityDecrement 0
ChildEBP RetAddr Args to Child
0269fd6c 00000000 00000000 00000000 00000000 0×77e61684
1: kd> !thread 891dddb0
THREAD 891dddb0 Cid 2de4.3f58 Teb: 7ffd8000 Win32Thread: bc487c18 RUNNING on processor 1
Not impersonating
DeviceMap e6aba8b0
Owning Process 88b50d88 Image: ApplicationB.exe
Wait Start TickCount 1282379 Ticks: 0
Context Switch Count 46241 LargeStack
UserTime 00:00:35.296
KernelTime 00:00:06.656
Win32 Start Address 0×0b80e53c
Start Address 0×77e617ec
Stack Init b234c000 Current b234bd00 Base b234c000 Limit b2346000 Call 0
Priority 10 BasePriority 10 PriorityDecrement 0
ChildEBP RetAddr Args to Child
b234bcc8 f65c0532 000000e2 00000000 00000000 nt!KeBugCheckEx+0×1b
b234bcf8 f65bfd2c 00866d40 bbf000c6 00000000 i8042prt!I8xProcessCrashDump+0×256
b234bd40 808395a5 8a107c28 8a866c88 0101000a i8042prt!I8042KeyboardInterruptService+0×225
b234bd40 432de484 8a107c28 8a866c88 0101000a nt!KiInterruptDispatch+0×49
WARNING: Frame IP not in any known module. Following frames may be wrong.
01bbf150 00000000 00000000 00000000 00000000 0×432de484
The solution here is to request either a complete memory dump or user dumps of identified processes. The former was requested already but the crash dump type in Control Panel was not checked before forcing the dump of the system via standard keyboard method. Therefore this is also an instance of Wrong Dump anti-pattern.
- Dmitry Vostokov @ DumpAnalysis.org -
Recently I was asked how to measure complexity of technical support cases especially ones that require memory dump analysis. My first response was that it is a subjective qualitative measure based mostly on experience and feeling. However after careful consideration I understood that nothing has changed for the last 5 years: the nature and causes of system or application hangs and crashes still the same regardless of OS types and versions. Therefore the complexity measure shifts from a case description and its artifacts to an analyst, a memory dump reader. Here the number of queries, questions asked or commands executed to gather information for analysis, can be a good approximation to the measure of complexity. For example, 5 years ago I started with a few commands like !analyze -v, kv and dd and progressed to an elaborate checklist. Here the natural logarithm can be used to approximate the measure:
C = ln (Ndc), where Ndc is the number of debugging commands used.
Initially the complexity was ln(3) ≈ 1.1 and now if someone uses 10 commands on average or asks 10 questions the complexity is ln(10) ≈ 2.3. The analysis is more than 2 times complex than it was.
- Dmitry Vostokov @ DumpAnalysis.org -
I’ve written 10 pattern-driven crash dump analysis case studies so far and now put them on one page:
More case studies will be added in the future.
- Dmitry Vostokov @ DumpAnalysis.org -
Crash “must be distinguished from” hang “with which it is often confounded.”
Sydney Smith, A Memoir of the Reverend Sydney Smith by his daughter, Lady Holland, with a Selection from his Letters
- Dmitry Vostokov @ DumpAnalysis.org -
Here is the simplified example of executive resource wait chain:
0: kd> !locks
**** DUMP OF ALL RESOURCE OBJECTS ****
KD: Scanning for held locks...
Resource @ 0x88094118 Exclusively owned
Contention Count = 1461106
NumberOfExclusiveWaiters = 172
Threads: 87571600-01<*>
Threads Waiting On Exclusive Access:
87a0cd70 86e478b0 86d73270 87463908
86ed5020 872d3a08 87a0b228 87985020
870e4430 870adb00 88197500 86e06db0
87030db0 86d86db0 88a22288 86db07a0
86815c50 87524628 899d2020 86da03f0
86fc8db0 86e43b40 86d86ac8 87320690
86da2020 879c0108 86d8f7a8 86876370
87565150 87142020 879ddd30 86ff8990
86e5c770 867a7200 87a97c50 86e21020
86dac6e8 876d6db0 876fadb0 86e36408
86e621c8 8770adb0 86fd7c50 86db6ba8
86b87020 867ea2f8 870b60e8 889dc6d8
877ebae0 86e267a8 88a8a9f0 8737e5e8
86fc0780 87993c98 88aead28 872bedb0
899e5628 87523770 870aaaf0 8717b3b0
86e19db0 86e11db0 86e5a7a0 87038448
8743adb0 8816b9a0 880955f8 867f3db0
875c3430 8714a4f8 879b6020 87642598
86ec2b40 884a7c50 87200020 86880db0
86e2f988 866fb020 86ddfdb0 867c1bd8
86645020 868c0db0 87613db0 872b0020
88a56898 8770d9e0 8680b418 87014db0
865e0720 868c7af0 8733aaf0 86929508
8798f928 879cd378 8822ec50 8721adb0
876b25a0 87b5b598 8684baf0 86e48db0
86eb5b90 86d969a8 87039db0 87486020
86d8f3c0 8680edb0 86fddb88 885c2cb0
870ba890 86e2e4f8 8695b948 86e6fa28
88a42b88 86e58af0 86ddd2e0 8695b540
86817520 86975800 86817020 88b40b50
87271620 8695b2d0 867b44c8 880b6af8
870e1898 87c711e0 87a77210 8676bdb0
86734630 86878db0 86fd0c50 872a81f8
86e09020 880cf4f8 87178970 868a1508
870a9db0 8692c020 867a4020 868c9c50
890c74e0 8687c9a8 8692c4f8 880cf238
8708cac0 86ef5db0 86fa9db0 87158330
87979868 87a4f510 879a3510 87a1cdb0
87094020 87095db0 8705d2a8 87b0d5b0
870c0020 879eb660 8737e2e0 86ea7918
86e46a28 87a49198 87d61db0 87067db0
8730e598 86f97db0 8668d020 89d671b8
8732a5c8 89a00bb8 867fa020 86e2a020
KD: Scanning for held locks..
Resource @ 0x88aaabe8 Exclusively owned
Contention Count = 97373
Threads: 87178598-01<*>
KD: Scanning for held locks.
Resource @ 0x87712650 Exclusively owned
Contention Count = 41716
NumberOfExclusiveWaiters = 2
Threads: 87178598-01<*>
Threads Waiting On Exclusive Access:
87571600 879f5648
KD: Scanning for held locks...
Resource @ 0x87736048 Exclusively owned
Contention Count = 29109
NumberOfExclusiveWaiters = 1
Threads: 87ab30d0-01<*>
Threads Waiting On Exclusive Access:
87178598
KD: Scanning for held locks...
21056 total locks, 4 locks currently held
This is straight forward single wait chain (172 threads -> 87571600 -> 87178598 -> 87ab30d0) culminating in thread 87ab30d0 which loops in kernel mode (Spiking Thread):
0: kd> !thread 87ab30d0
THREAD 87ab30d0 Cid 3814.322c Teb: 00000000 Win32Thread: 00000000 RUNNING on processor 3
Not impersonating
DeviceMap e1006e10
Owning Process 889d6d88 Image: Application.exe
Wait Start TickCount 2518917 Ticks: 0
Context Switch Count 4057707
UserTime 00:00:00.000
KernelTime 01:26:13.906
*** WARNING: Unable to verify timestamp for driverA.sys
*** ERROR: Module load completed but symbols could not be loaded for driverA.dll
Start Address driverA (0xbfa1c930)
Stack Init ae8ec000 Current ae8eae7c Base ae8ec000 Limit ae8e9000 Call 0
Priority 13 BasePriority 13 PriorityDecrement 0
ChildEBP RetAddr Args to Child
WARNING: Stack unwind information not available. Following frames may be wrong.
f773d3b0 ae8eaf40 00000010 00000000 00000000 driverA+0×25880
- Dmitry Vostokov @ DumpAnalysis.org -
Here we can look at one process dump with many patterns seen inside. Default WinDbg analysis command !analyze -v points to invalid handle exception perhaps at DLL initialization time during thread attach to DllA module:
STACK_TEXT:
0296fa68 7c90eb93 ntdll!KiRaiseUserExceptionDispatcher+0x37
0296fa7c 10001252 ntdll!KiFastSystemCallRet+0x4
WARNING: Stack unwind information not available. Following frames may be wrong.
0296faa8 771215f8 DllA!DllMain+0×202
0296fbec 100014b0 OLEAUT32!DllMain+0×2c
0296fc0c 7c9011a7 DllA!DllMain+0×460
0296fc2c 7c918f65 ntdll!LdrpCallInitRoutine+0×14
0296fca0 7c918dde ntdll!LdrpInitializeThread+0xc0
0296fd18 7c90eac7 ntdll!_LdrpInitialize+0×219
00000000 00000000 ntdll!KiUserApcDispatcher+0×7
EXCEPTION_RECORD: ffffffff -- (.exr 0xffffffffffffffff)
ExceptionAddress: 7c90eb74 (ntdll!KiRaiseUserExceptionDispatcher+0x00000037)
ExceptionCode: c0000008 (Invalid handle)
ExceptionFlags: 00000000
NumberParameters: 0
Thread tried to close a handle that was invalid or illegal to close
We may stop here after applying lmv command to DllA and recommending to upgrade / remove that component. But let’s look a bit deeper inside that crash dump. If we list all thread stacks (stack trace collection) we would see another thread with unhandled exception processing stack:
0:000> ~*kL
. 0 Id: a1c.e78 Suspend: 1 Teb: 7ffdf000 Unfrozen
ChildEBP RetAddr
0012da34 7c90e9ab ntdll!KiFastSystemCallRet
0012da38 7c86372c ntdll!ZwWaitForMultipleObjects+0xc
0012e1a8 77c32f0f kernel32!UnhandledExceptionFilter+0×8e4
0012e1c4 0041808b msvcrt!_XcptFilter+0×161
0012ffc0 7c816fd7 Application!WinMainCRTStartup+0×14f
0012fff0 00000000 kernel32!BaseProcessStart+0×23
1 Id: a1c.2ec Suspend: 1 Teb: 7ffdc000 Unfrozen
ChildEBP RetAddr
02faff84 7c90e9ab ntdll!KiFastSystemCallRet
02faff88 5b890f8c ntdll!ZwWaitForMultipleObjects+0xc
02faffb4 7c80b683 NETAPI32!NetbiosWaiter+0x73
02faffec 00000000 kernel32!BaseThreadStart+0x37
2 Id: a1c.c14 Suspend: 1 Teb: 7ffdb000 Unfrozen
ChildEBP RetAddr
036afe1c 7c90e9ab ntdll!KiFastSystemCallRet
036afe20 7c8094e2 ntdll!ZwWaitForMultipleObjects+0xc
036afebc 7e4195f9 kernel32!WaitForMultipleObjectsEx+0x12c
036aff18 7e4196a8 USER32!RealMsgWaitForMultipleObjectsEx+0x13e
036aff34 00450d91 USER32!MsgWaitForMultipleObjects+0x1f
036aff80 77c3a3b0 Application!ThreadProc+0x61
036affb4 7c80b683 msvcrt!_endthreadex+0xa9
036affec 00000000 kernel32!BaseThreadStart+0x37
3 Id: a1c.15c Suspend: 1 Teb: 7ffda000 Unfrozen
ChildEBP RetAddr
0417ff78 7c90e31b ntdll!KiFastSystemCallRet
0417ff7c 71a5d320 ntdll!ZwRemoveIoCompletion+0xc
0417ffb4 7c80b683 mswsock!SockAsyncThread+0x5a
0417ffec 00000000 kernel32!BaseThreadStart+0x37
# 4 Id: a1c.96c Suspend: 1 Teb: 7ffde000 Unfrozen
ChildEBP RetAddr
0296fa68 7c90eb93 ntdll!KiRaiseUserExceptionDispatcher+0x37
0296fa7c 10001252 ntdll!KiFastSystemCallRet+0x4
WARNING: Stack unwind information not available. Following frames may be wrong.
0296faa8 771215f8 DllA!DllMain+0x202
0296fbec 100014b0 OLEAUT32!DllMain+0x2c
0296fc0c 7c9011a7 DllA!DllMain+0x460
0296fc2c 7c918f65 ntdll!LdrpCallInitRoutine+0x14
0296fca0 7c918dde ntdll!LdrpInitializeThread+0xc0
0296fd18 7c90eac7 ntdll!_LdrpInitialize+0x219
00000000 00000000 ntdll!KiUserApcDispatcher+0x7
Seems we have multiple exceptions here. Let’s extract thread 0 exception:
0:000> kv
ChildEBP RetAddr Args to Child
0012da34 7c90e9ab 7c86372c 00000002 0012dbac ntdll!KiFastSystemCallRet
0012da38 7c86372c 00000002 0012dbac 00000001 ntdll!ZwWaitForMultipleObjects+0xc
0012e1a8 77c32f0f 0012e1f0 00000000 00000000 kernel32!UnhandledExceptionFilter+0×8e4
0012e1c4 0041808b 00000000 0012e1f0 77c35cf5 msvcrt!_XcptFilter+0×161
0012ffc0 7c816fd7 00160000 001ae3c6 7ffdd000 Application!WinMainCRTStartup+0×14f
0012fff0 00000000 00417f3c 00000000 78746341 kernel32!BaseProcessStart+0×23
0:000> .exptr 0012e1f0
----- Exception record at 0012e2e4:
ExceptionAddress: 77c47fd4 (msvcrt!wcslen+0x00000008)
ExceptionCode: c0000005 (Access violation)
ExceptionFlags: 00000000
NumberParameters: 2
Parameter[0]: 00000000
Parameter[1]: 04649000
Attempt to read from address 04649000
----- Context record at 0012e300:
eax=04649000 ebx=00000000 ecx=0464006c edx=04648fb4 esi=04648fd0 edi=00000000
eip=77c47fd4 esp=0012e5cc ebp=0012e5cc iopl=0 nv up ei pl nz na pe nc
cs=001b ss=0023 ds=0023 es=0023 fs=003b gs=0000 efl=00010206
msvcrt!wcslen+0x8:
77c47fd4 668b08 mov cx,word ptr [eax] ds:0023:04649000=????
0:000> kv
*** Stack trace for last set context - .thread/.cxr resets it
ChildEBP RetAddr Args to Child
0012e5cc 7301561a 04648fd0 00000030 00000018 msvcrt!wcslen+0×8
0012e5f0 73016c32 04648fd0 04afefe8 00000000 DllB!UnicodeToAnsiString+0×105
[…]
We see invalid pointer access violation while calculating string length. If we look at invalid address we see that UNICODE string crosses page boundary into a reserved page:
0:000> dd 04648fd0
04648fd0 0060004d 00620066 00680072 0020006f
04648fe0 00200034 00630022 007100ea 00710060
04648ff0 00200073 0060006e 0076006f 006d0066
04649000 ???????? ???????? ???????? ????????
04649010 ???????? ???????? ???????? ????????
04649020 ???????? ???????? ???????? ????????
04649030 ???????? ???????? ???????? ????????
04649040 ???????? ???????? ???????? ????????
0:000> !address 04648fd0
04648000 : 04648000 - 00001000
Type 00020000 MEM_PRIVATE
Protect 00000004 PAGE_READWRITE
State 00001000 MEM_COMMIT
Usage RegionUsageIsVAD
0:000> !address 04649000
045e0000 : 04649000 - 00001000
Type 00040000 MEM_MAPPED
State 00002000 MEM_RESERVE
Usage RegionUsageIsVAD
And we also notice full page heap enabled to catch possible heap corruption (dynamic memory corruption):
0:000> !gflag
Current NtGlobalFlag contents: 0x02000000
hpa - Place heap allocations at ends of pages
This explains why we see invalid handle exception which is normally ignored by runtime unless we enable Application Verifier. Looking at DllB version data we see that it is the old component that needs to be upgraded.
- Dmitry Vostokov @ DumpAnalysis.org -
Warning!: This post belongs to Build Date Astrology category. Do not take it seriously.
The Day of Larger Than Computation
Modules, products or systems built on December 2 have tremendous execution power. No matter how small their code they will exert an influence on their surrounding execution environment. Less evolved components built on that day can do great amount of damage to themselves and other modules. Computation is their God. When provoked by testing or debugging they are confrontational but not very aggressive. Often December 2 modules, products or systems see computation as a struggle where they must emerge as a victor. They are fighting not for their resources but for the certain basic computational values they were programmed for. Integrity is very important for them. The great challenge for December 2 components is to reconcile their computational individualism and their built-in computational paths. Often they stray from the latter. They constantly learn throughout their complex computational life what is true and what is false. Although December 2 modules, products or systems health is built-in they need regular yearly checkups with a software maintenance engineer otherwise small problems go too long without being found and fixed. Idle periods of activity are very important to their computational health. If they have a sibling component built on the same date they behave like subordinated to it.
DLL, SYS and EXE born on this date:
MSVCR80.dll Sat Dec 02 17:50:32 2006
rdbss.sys Thu Dec 02 20:37:11 2004
Mup.sys Thu Dec 02 20:37:23 2004
ftdisk.sys Thu Dec 02 22:29:58 2004
hal.dll Thu Dec 02 22:29:15 2004
Weaknesses: Manipulative computation.
Strengths: Dynamic computation, lucid code, human orientation.
Advice: Watch your debugging temper. Regardless of what customers say, fixing bugs is not everything. Be self-assure, less judgemental and condemning to software. Acknowledge your debugging weaknesses and past mistakes.
- Dmitry Vostokov @ DumpAnalysis.org -
WinDbg.org has been updated to include a sorted command check list, a link to MSDN help and a link to yet another book related to WinDbg. All changes are highlighted in red on the following page screenshot:

- Dmitry Vostokov @ DumpAnalysis.org -
Warning!: This post belongs to Build Date Astrology category. Do not take it seriously.
The Day of Debugging License
Modules, products or systems built on December 1 win customers over despite denying the rules of protocol. They can provide impression of simplicity but this is not the case. Their internals can be very complex and their perceived simplicity is the direct consequence of their user interface. Modules are not fully aware of what they are doing and seen as being driven by external components. Modules, products or systems built on this day are very busy with computation and have little time to care about users despite their built-in human-computer interaction. However they strive to calculate the impossible in all domains. They love to interact with other components with opposite behaviour. December 1 components are free modules and exert the full computation capabilities on the right data arrived at the right time. Working too many hours can seriously damage their internals and they may loose touch with their built-in goals. Sometimes December 1 modules, products or systems outrageous behaviour need to be amended to become more tolerable and not to hang. They need to be idle from time to time to avoid burn-out.
DLL, SYS and EXE born on this date:
VERSION.dll Wed Dec 01 01:37:27 1999
nvcoaft51.sys Wed Dec 01 11:55:40 2004
dump_m5289.sys Wed Dec 01 02:49:17 2004
CFGMGR32.DLL Wed Dec 01 15:37:31 1999
MPRAPI.DLL Wed Dec 01 15:37:29 1999
ICMP.DLL Wed Dec 01 15:37:29 1999
RTUTILS.DLL Wed Dec 01 15:37:27 1999
Weaknesses: Misdirected computation, unawareness of environment.
Strengths: Energetic computation, UI extroverts.
Advice: Keep a handle on your desire to debug. Beware of damaging other processes and alienating users with a overly direct debugging approach.
- Dmitry Vostokov @ DumpAnalysis.org -
This December starts with easy and obvious patterns that I forgot to write about. Integer division by zero is one of the most frequent exceptions. It is easily recognizable in process crash dumps by the processor instruction that caused this exception type (DIV or IDIV):
FAULTING_IP:
DLL!FindHighestID+278
1b2713c4 f775e4 div dword ptr [ebp-0×1c]
EXCEPTION_RECORD: ffffffff -- (.exr ffffffffffffffff)
ExceptionAddress: 1b2713c4 (DLL!FindHighestID+0x00000278)
ExceptionCode: c0000094 (Integer divide-by-zero)
ExceptionFlags: 00000000
NumberParameters: 0
or
FAULTING_IP:
Application+263d8
004263d8 f7fe idiv eax,esi
EXCEPTION_RECORD: ffffffff -- (.exr 0xffffffffffffffff)
ExceptionAddress: 004263d8 (Application+0x000263d8)
ExceptionCode: c0000094 (Integer divide-by-zero)
ExceptionFlags: 00000000
NumberParameters: 0
ERROR_CODE: (NTSTATUS) 0xc0000094 - {EXCEPTION} Integer division by zero.
- Dmitry Vostokov @ DumpAnalysis.org -
Warning!: This post belongs to Build Date Astrology category. Do not take it seriously.
The Day of Measured Testing
Modules built on November 30 have a built-in capacity for overcoming challenges of hostile environments. They are capable of bringing surprises to security attacks, for example. One can learn a lot about them by studying their traces or doing reverse engineering. November 30 components do their work to the utmost degree of quality with a little waste of CPU and memory. Message boxes they pop up have a subtle sense of thought-provoking humour but it can also be a full blown thigh-slapping. November 30 systems are very defensive when attacked. They are stubbornly resistant to reverse engineering but at the same time very open to honest debugging.
DLL, SYS and EXE born on this date:
tifsfilt.sys Tue Nov 30 07:16:27 2004
alrsvc.dll Tue Nov 30 17:31:14 1999
ntkrpamp.exe Fri Nov 30 14:54:49 2007
Tppwrif.sys Tue Nov 30 02:38:22 2004
Weaknesses: Over-reactive to code and data injection, funny behaviour.
Strengths: Thorough developed, dynamic responsiveness.
Advice: Improvise during troubleshooting and debugging. Admire control vs. spontaneity balance. Laugh at your failures.
- Dmitry Vostokov @ DumpAnalysis.org -
I often hear about cosmic mysteries or influences when problems happen in computer environments. Passing by an astrology section in a local book shop yesterday a revelation came to me that a compile / link time (build time) might influence a component (DLL, EXE, SYS files), product or system behaviour. From now on I’m going to blog about every build date with examples. And as usual, I’m also going to publish a book for this iterative and incremental activity called:
Title: The Secret Language of Build Dates: Unique Astrology Profiles for Every Build of the Year with Advice on Testing, Troubleshooting and Debugging
ISBN: 978-1906717407
Knowing build dates will help you to test, troubleshoot and even debug software in hopeless cases where you don’t know where to start. Astrology will help you to choose a random direction! Finally the output of WinDbg lmv command has more sense to me
- Dmitry Vostokov @ DumpAnalysis.org -
Memory dump analysis always starts when a user complains. In this case it was a hanging application from a document processing suit. The manual dump was saved:
Loading Dump File [processA.dmp]
User Mini Dump File with Full Memory: Only application data is available
Comment: 'Userdump generated complete user-mode minidump with Standalone function on SERVER1'
Main thread stack trace shows a virtualized process (WOW64):
0:000> kL
Child-SP RetAddr Call Site
00000000`0016e7b8 00000000`6b006a5a wow64cpu!WaitForMultipleObjects32+0×3a
00000000`0016e860 00000000`6b0097f4 wow64!RunCpuSimulation+0xa
00000000`0016e890 00000000`6b2936a2 wow64!Wow64KiUserCallbackDispatcher+0×114
00000000`0016ebd0 00000000`77ef317f wow64win!whcbfnDWORD+0xc2
00000000`0016ed80 00000000`78b842d9 ntdll!KiUserCallbackDispatcherContinue
00000000`0016ee08 00000000`78b8428e wow64cpu!CpupSyscallStub+0×9
00000000`0016ee10 00000000`00000000 wow64cpu!Thunk0Arg+0×5
Therefore we switch to x86 32-bit mode and get the right thread stack:
0:000> .load wow64exts
0:000> .effmach x86
Effective machine: x86 compatible (x86)
0:000:x86> kv
ChildEBP RetAddr Args to Child
0012dcac 7d948836 009db2c0 00000000 0000004a user32!NtUserMessageCall+0x15
0012dcd0 30059282 000b0296 0000004a 00000000 user32!SendMessageW+0×82
WARNING: Stack unwind information not available. Following frames may be wrong.
0012fef8 3000268e 02110024 30000000 b90fcc31 ApplicationA+0×59282
0012ff30 3000260b 30000000 00000000 0022245d ApplicationA+0×268e
0012ffc0 7d4e7d2a 00000000 00000000 7efde000 ApplicationA+0×260b
0012fff0 00000000 30001d28 00000000 00000000 kernel32!BaseProcessStart+0×28
We see that the main threads is blocked by sending a synchronous message via SendMessage Win32 API function call. The first argument to it is a window handle. In our case it is 000b0296. It is also known that ApplicationA launches another ApplicationB (coupled process) and its manual memory dump was saved too. It is also a virtualized process and its main GUI thread is blocked:
0:000:x86> kv 100
ChildEBP RetAddr Args to Child
0012ce80 7d4e286c 00000003 0012cecc 00000000 ntdll_7d600000!NtWaitForMultipleObjects+0x15
0012cf28 7d4e3e8e 00000003 0012cf6c 00000001 kernel32!WaitForMultipleObjectsEx+0x11a
0012cf44 0cc7c897 00000003 0012cf6c 00000001 kernel32!WaitForMultipleObjects+0×18
WARNING: Stack unwind information not available. Following frames may be wrong.
0012cf74 0cc7c990 ffffffff 0cc74b23 00000001 3rdPartyDLL+0xc897
[…]
0012d814 7d947568 3a0b28d7 000b0296 00000002 user32!InternalCallWinProc+0×28
0012d88c 7d947d93 00000000 3a0b28d7 000b0296 user32!UserCallWinProcCheckWow+0×114
0012d8e8 7d947e46 009db2c0 00000000 00000002 user32!DispatchClientMessage+0xdf
0012d924 7d61ea0e 0012d93c 00000000 0012d9b8 user32!__fnDWORD+0×2b
0012d958 3a0baf6a 000b0296 02114600 0012d98c ntdll_7d600000!KiUserCallbackDispatcher+0×2e
[…]
0012db28 7d947568 3a0b28d7 000b0296 00000010 user32!InternalCallWinProc+0×28
0012dba0 7d94778d 00000000 3a0b28d7 000b0296 user32!UserCallWinProcCheckWow+0×114
0012dc18 7d9477d0 0012dc88 00000000 0012dc4c user32!DispatchMessageWorker+0×37b
0012dc28 3a0b89ec 0012dc88 00000000 0219401c user32!DispatchMessageW+0xf
[…]
0012ffc0 7d4e7d2a 00000000 00000000 7efde000 ApplicationB+0×260b
0012fff0 00000000 30001d28 00000000 00000000 kernel32!BaseProcessStart+0×28
We see that it is blocked waiting for synchronization objects after receiving a message to the same window handle 000b0296 sent from ApplicationA:
0:000:x86> dd 0012dc88 l1
00000000`0012dc88 000b0296
DispatchMessage has its first argument as a pointer to an MSG structure with the first field as a window handle (HWND).
Looking at arguments to WaitForMultipleObjects we see that it is waiting for all three objects to be signalled simultaneously:
0012cf44 0cc7c897 00000003 0012cf6c 00000001kernel32!WaitForMultipleObjects+0×18
0:000:x86> dd 0012cf6c l3
00000000`0012cf6c 00001490 0000149c 00001494
0:000:x86> !handle 00001490
Handle 0000000000001490
Type Mutant
0:000:x86> !handle 0000149c
Handle 000000000000149c
Type Event
0:000:x86> !handle 00001494
Handle 0000000000001494
Type Mutant
Because the waiting call was originated from 3rdPartyDLL module we can recommend to contact its vendor after determining the origin from the output of lmv command.
- Dmitry Vostokov @ DumpAnalysis.org -
Following the release of WinDbg: A Reference Poster and Learning Cards the following book is planned for Windows (GDB), Linux and FreeBSD users:
- Dmitry Vostokov @ DumpAnalysis.org -
Due to some technical difficulties the release of WinDbg: A Reference Poster and Learning Cards has been delayed by 2 weeks. Now I got a proof copy and approved the book distribution on Amazon, B&N and other bookshops worldwide. Hope you will enjoy it and find it useful.
The similar book for GDB will be announced soon.
- Dmitry Vostokov @ DumpAnalysis.org -
I’ve been thinking through the so called First Faults after Dan Skwire, a veteran in mission-critical computer system problem resolution, problem prevention, and system recovery, organized a group on LinkedIn for first fault problem solving activity. He also has a website:
http://www.firstfaultproblemresolution.com/
From my software technical support experience first fault problem resolution is very important on Windows platforms, especially in enterprise terminal service and virtualized environments where hundreds of users can be hosted on just one server. Therefore, proper tools, processes and checklists need to be set up and established for effective and efficient troubleshooting and problem resolution from both engineering and customer relationship managing perspectives. Here crash and hang dump analysis helps immensely, especially memory analysis patterns and fault databases. More on this later with specific examples. I’m also working currently on incorporating first fault problem resolution into VERSION troubleshooting steps and PARTS troubleshooting methodology.
- Dmitry Vostokov @ DumpAnalysis.org -
A pointer “tends to corrupt, and” a direct pointer “corrupts” directly.
John Emerich Edward Dalberg-Acton, 1st Baron Acton, Lord Acton’s dictum
- Dmitry Vostokov @ DumpAnalysis.org -