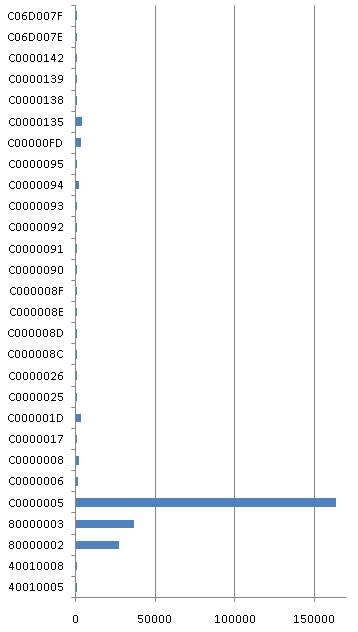
Win32 Exception Frequencies
Sponsored link: Memory Dump Analysis Services
Debugging Experts Magazine Online
After Bug Check Frequencies post I was curious enough to do the same Google counting procedure for exceptions. Here are my results for exceptions listed in Visual C++ Debug \ Exceptions dialog:
|
Control-C |
40010005 |
43 |
|
Control-Break |
40010008 |
7 |
|
Datatype misalignment |
80000002 |
27300 |
|
Breakpoint |
80000003 |
36400 |
|
Access violation |
C0000005 |
164000 |
|
In page error |
C0000006 |
1210 |
|
Invalid handle |
C0000008 |
1670 |
|
Not enough quota |
C0000017 |
176 |
|
Illigal instruction |
C000001D |
3400 |
|
Cannot continue |
C0000025 |
804 |
|
Invalid exception disposition |
C0000026 |
121 |
|
Array bounds exceeded |
C000008C |
100 |
|
Floating-point denormal operand |
C000008D |
84 |
|
Floating-point division by zero |
C000008E |
523 |
|
Floating-point inexact result |
C000008F |
401 |
|
Floating-point invalid operation |
C0000090 |
509 |
|
Floating-point overflow |
C0000091 |
121 |
|
Floating-point stack check |
C0000092 |
102 |
|
Floating-point underflow |
C0000093 |
138 |
|
Integer division by zero |
C0000094 |
1610 |
|
Integer overflow |
C0000095 |
99 |
|
Stack overflow |
C00000FD |
3110 |
|
Unable to locate component |
C0000135 |
3970 |
|
Ordinal not found |
C0000138 |
43 |
|
Entry point not found |
C0000139 |
724 |
|
DLL initialization failed |
C0000142 |
918 |
|
Module not found |
C06D007E |
171 |
|
Procedure not found |
C06D007F |
248 |
The corresponding graph:

- Dmitry Vostokov @ DumpAnalysis.org -
_1125.png)
Museum of Debugging and Memory Dumps
7/7/2010 - 8/8/2010 Annual Competition: Tell Your Windows Debugging Story
Crash and Hang Analysis Audit Service
CARE: Crash Analysis Report Environment
Crash Dump and Software Trace Analysis Training and Seminars
Access OpenTask Titles on Safari Books Online
DATA (Dump Analysis + Trace Analysis) Facebook group
Please join the community of memory (dump) and trace analysis engineers. This group promotes scientific methods and memory dump-based worldview.
Twitter @ DumpAnalysis You can now follow portal and blog news at DumpAnalysis on Twitter
LinkedIn Group Dr. Watson Enthusiasts All about Dr. Watson errors and more. Get news, excerpts and progress reports about the forthcoming book The Science of Dr. Watson: An Illustrated History of Debugging (ISBN 978-1906717070)
2010 (0x7DA) - The Year of Dump Analysis 2011 (0x7DB) - 2020 (0x7E4) The Debugging Decade
International Memory Analysts and Debuggers Day: 07.07 and/or 08.08 starting from The Year of Dump Analysis, 2010, 7DA
AnnouncementsComing Soon:
Management Bits: An Anthology from Reductionist Manager
Debugging Notebook: Essential Concepts, WinDbg Commands and Tools
Crash Dump Analysis for System Administrators and Support Engineers
New Magazines:
Debugged! MZ/PE: MagaZine for/from Practicing Engineers
New Books:
Memory Dump Analysis Anthology: Color Supplement for Volumes 1-3
Memory Dump Analysis Anthology, Volume 3
First Fault Software Problem Solving: A Guide for Engineers, Managers and Users
x64 Windows Debugging: Practical Foundations
Also available:
Windows Debugging: Practical Foundations
DLL List Landscape: The Art from Computer Memory Space
Dumps, Bugs and Debugging Forensics: The Adventures of Dr. Debugalov
WinDbg: A Reference Poster and Learning Cards
Memory Dump Analysis Anthology, Volume 2
Memory Dump Analysis Anthology, Volume 1
New Children's Book:


December 1st, 2008 at 5:37 pm
[…] with easy and obvious patterns that I forgot to write about. Integer division by zero is one of the most frequent exceptions. It is easily recognizable in process crash dumps by the processor instruction that caused this […]