Bugtation No.70
Thursday, November 27th, 2008A pointer “tends to corrupt, and” a direct pointer “corrupts” directly.
John Emerich Edward Dalberg-Acton, 1st Baron Acton, Lord Acton’s dictum
- Dmitry Vostokov @ DumpAnalysis.org -
A pointer “tends to corrupt, and” a direct pointer “corrupts” directly.
John Emerich Edward Dalberg-Acton, 1st Baron Acton, Lord Acton’s dictum
- Dmitry Vostokov @ DumpAnalysis.org -
If you have an article idea or if you’d like to write an article for Debugged! MZ/PE please use the following contact form:
http://www.dumpanalysis.org/contact
Author’s guidelines will be published soon.
- Dmitry Vostokov @ DumpAnalysis.org -
As one of the new initiatives for the Year of Debugging DumpAnalysis Portal will publish bimonthly full color 16 page publication called:
Debugged! MZ/PE: MagaZine for/from Practicing Engineers
The only serial publication dedicated entirely to Windows® debugging
The first issue is planned for March, 2009 and will have ISBN-13: 978-1-906717-38-4. If it goes well I’m planning to have ISSN number assigned to it too. More details will be announced soon.
- Dmitry Vostokov @ DumpAnalysis.org -
I’m pleased to announce that OpenTask has submitted the book Dumps, Bugs and Debugging Forensics: The Adventures of Dr. Debugalov for printing and here is the link to TOC:
- Dmitry Vostokov @ DumpAnalysis.org -
I was thinking about the universal character of debugging for quite some time and finally the following bugtation provided an inspiration for a new book title to be published during the Year of Debugging:
Title: Breaking the Bug: Debugging as a Natural Phenomenon
ISBN-13: 978-1906717377
More product details will be announced later.
Actually I believe in the mystical nature of various debugging numbers and sequences. For example, the ISBN number of this book ends in 377 which is the octal base equivalent of 0n255 or 0xFF.
- Dmitry Vostokov @ DumpAnalysis.org -
“Diamonds are forever but bugs are an error.”
Narasimha Vedala, Dumps, Bugs and Debugging Forensics: The Adventures of Dr. Debugalov

- Dmitry Vostokov @ DumpAnalysis.org -
Thanks to shellexecute I got the news of this release. Remember, you can always access quick download links from www.windbg.org.
Dmitry Vostokov @ DumpAnalysis.org -
DLL is also a recursive acronym for DLL List Landscape. OpenTask is going to publish soon the new full color book:
Title: DLL List Landscape: The Art from Computer Memory Space
ISBN-13: 978-1-906717-36-0
More details will be announced tomorrow.
- Dmitry Vostokov @ DumpAnalysis.org -
Below is the list of patterns related to process heap corruption:
and two case studies involving heap corruption:
- Dmitry Vostokov @ DumpAnalysis.org -
This is a common pattern cooperation in user dumps coming from x64 environments. Its characteristic feature is stack trace collection that appears to be damaged or corrupt with lots of zeroed call sites and sometimes having UNICODE values in saved RSP:
0:001> ~*kL
   0  Id: 668.684 Suspend: 1 Teb: 000007ff`fffde000 Unfrozen

Child-SP          RetAddr           Call Site

00000000`000afcb8 000007ff`7f1ee614 USER32!NtUserWaitMessage+0xa

00000000`000afcc0 000007ff`7f1adf7a SHELL32!CDesktopBrowser::_MessageLoop+0x287

00000000`000afd50 00000001`0001a46c SHELL32!SHDesktopMessageLoop+0x5c

00000000`000afd80 00000001`000231ba Explorer!ExplorerWinMain+0x6f1

00000000`000afec0 00000000`77d5964c Explorer!ModuleEntry+0x1c6

00000000`000aff80 00000000`00000000 kernel32!BaseProcessStart+0x29
   1  Id: 668.20c Suspend: 1 Teb: 000007ff`fffdc000 Unfrozen

Child-SP          RetAddr           Call Site

00000000`00000000 00000000`00000000 0×0
   2  Id: 668.298 Suspend: 1 Teb: 000007ff`fffd9000 Unfrozen

Child-SP          RetAddr           Call Site

00000000`00000000 00000000`00000000 0×0
   3  Id: 668.f34 Suspend: 1 Teb: 000007ff`fffd7000 Unfrozen

Child-SP          RetAddr           Call Site

00000000`00000000 00000000`00000000 0×0
   4  Id: 668.824 Suspend: 1 Teb: 000007ff`fffd5000 Unfrozen

Child-SP          RetAddr           Call Site

00000000`00000000 00000000`00000000 0×0
   5  Id: 668.820 Suspend: 1 Teb: 000007ff`fffae000 Unfrozen

Child-SP          RetAddr           Call Site

00000000`00000000 00000000`00000000 0×0
   6  Id: 668.914 Suspend: 1 Teb: 000007ff`fffac000 Unfrozen

Child-SP          RetAddr           Call Site

00000000`0342fb98 000007ff`7fd6ff61 ntdll!ZwReplyWaitReceivePortEx+0xa

00000000`0342fba0 000007ff`7fd45369 RPCRT4!LRPC_ADDRESS::ReceiveLotsaCalls+0x2a5

00000000`0342feb0 000007ff`7fd65996 RPCRT4!RecvLotsaCallsWrapper+0x9

00000000`0342fee0 000007ff`7fd65d51 RPCRT4!BaseCachedThreadRoutine+0xde

00000000`0342ff50 00000000`77d6b6da RPCRT4!ThreadStartRoutine+0x21

00000000`0342ff80 00000000`00000000 kernel32!BaseThreadStart+0x3a
   7  Id: 668.8cc Suspend: 1 Teb: 000007ff`fffaa000 Unfrozen

Child-SP          RetAddr           Call Site

00000000`00000000 00000000`00000000 0x7
   8  Id: 668.1078 Suspend: 1 Teb: 000007ff`fffa8000 Unfrozen

Child-SP          RetAddr           Call Site

00000000`00000000 00000000`00000000 0×0
#  9  Id: 668.1118 Suspend: 1 Teb: 000007ff`fffa4000 Unfrozen

Child-SP          RetAddr           Call Site

00000000`00000000 00000000`00000000 0×0
  10  Id: 668.574 Suspend: 1 Teb: 000007ff`fffa2000 Unfrozen

Child-SP          RetAddr           Call Site

00000000`00000020 00000000`00000000 0×0
  11  Id: 668.a54 Suspend: 1 Teb: 000007ff`fffa0000 Unfrozen

Child-SP          RetAddr           Call Site

90000000`0000679f 00000000`00000000 0x72505c74`6e656d65
  12  Id: 668.163c Suspend: 1 Teb: 000007ff`fffa6000 Unfrozen

Child-SP          RetAddr           Call Site

0000001e`00057000 00000000`00000000 0x575c3a43`00000075
  13  Id: 668.5b0 Suspend: 1 Teb: 000007ff`fff9e000 Unfrozen

Child-SP          RetAddr           Call Site

49575c3a`43000000 00000000`00000000 0x4e49575c`3a430000
  14  Id: 668.4c0 Suspend: 1 Teb: 000007ff`fff9c000 Unfrozen

Child-SP          RetAddr           Call Site

3a430000`00200004 00000000`00000000 0x43000000`1f0001c0
  15  Id: 668.774 Suspend: 1 Teb: 000007ff`fff9a000 Unfrozen

Child-SP          RetAddr           Call Site

00410044`00500050 00000000`00000000 0×6e006f`00690074
  16  Id: 668.17c0 Suspend: 1 Teb: 000007ff`fff98000 Unfrozen

Child-SP          RetAddr           Call Site

005c0029`00360038 00000000`00000000 0×500048`005c0029
However we notice ‘#’ in front of thread 9:
#  9  Id: 668.1118 Suspend: 1 Teb: 000007ff`fffa4000 Unfrozen

Child-SP          RetAddr           Call Site

00000000`00000000 00000000`00000000 0×0
This marks the thread that caught the exception. We can either switch to it by ~9s or using ~#s command:
0:010> ~#s

00000000`00000000 ??              ???
Now we look at thread raw stack data to search for any hidden exceptions and we find one indeed:
0:009> !teb

TEB at 000007fffffa4000

    ExceptionList:        0000000000000000

    StackBase:            0000000003000000

    StackLimit:           0000000002ff2000

    SubSystemTib:         0000000000000000

    FiberData:            0000000000001e00

    ArbitraryUserPointer: 0000000000000000

    Self:                 000007fffffa4000

    EnvironmentPointer:   0000000000000000

    ClientId:             0000000000000668 . 0000000000001118

    RpcHandle:            0000000000000000

    Tls Storage:          0000000000000000

    PEB Address:          000007fffffdb000

    LastErrorValue:       0

    LastStatusValue:      0

    Count Owned Locks:    0

    HardErrorMode:        0
0:010> dqs 0000000003232000  0000000003240000

00000000`03232000  00000000`00000000

00000000`03232008  00000000`00000000

00000000`03232010  00000000`00000000

[…]

00000000`02ffc8c8  00000000`77ef3202 ntdll!KiUserExceptionDispatcher+0×52

00000000`02ffc8d0  fffffa80`07186100

00000000`02ffc8d8  00000000`02ffc8d0

00000000`02ffc8e0  00000000`00000000

[…]
0:009> .cxr 00000000`02ffc8d0

rax=0000000000000000 rbx=0000000000000000 rcx=00000000671b4610

rdx=ffffffff9be48728 rsi=0000000000000000 rdi=0000000000000000

rip=0000000000000000 rsp=0000000002ffce68 rbp=00000000671b4610

 r8=0000000002ffccc0  r9=0000000000000000 r10=000068aa62010001

r11=00000000671b4610 r12=0000000000000000 r13=00000000000006a5

r14=00000000671b45d0 r15=7ffffffffffffffd

iopl=0         nv up ei pl zr na po nc

cs=0033  ss=002b  ds=002b  es=002b  fs=0053  gs=002b             efl=00010246

00000000`00000000 ??              ???
0:009> kL

  *** Stack trace for last set context - .thread/.cxr resets it

Child-SP          RetAddr           Call Site

00000000`02ffce68 00000000`67199841 0×0

00000000`02ffce70 00000000`67193188 DllA!DllUnregisterServer+0×8401

00000000`02ffd230 00000000`67194f93 DllA!DllUnregisterServer+0×1d48

00000000`02ffd350 000007ff`7ca9cae4 DllA!DllUnregisterServer+0×3b53

00000000`02ffd3f0 000007ff`7ca9d867 NETSHELL!GetPrimaryIPv6AddressForAdapter+0×64

00000000`02ffd720 000007ff`7ca1eb4f NETSHELL!CConnectionFolder::GetDetailsOf+0×62a

00000000`02ffdd20 000007ff`7f27f57f NETSHELL!CConnectionFolder::GetDetailsEx+0×21d

00000000`02ffe870 000007ff`7f27eea6 SHELL32!CNameSpaceItemUIProperty::GetPropertyDisplayValue+0xaf

00000000`02ffe910 000007ff`7f1e7bd4 SHELL32!CDetailsSectionInfoTask::RunInitRT+0×213

00000000`02fffc60 000007ff`7cec9c26 SHELL32!CRunnableTask::Run+0×52

00000000`02fffc90 000007ff`7ef773d8 BROWSEUI!CShellTaskScheduler_ThreadProc+0×1be

00000000`02fffd60 00000000`77eea78a SHLWAPI!ExecuteWorkItem+0×28

00000000`02fffd90 00000000`77eea99f ntdll!RtlpWorkerCallout+0×183

00000000`02fffec0 00000000`77eeac75 ntdll!RtlpExecuteWorkerRequest+0×63

00000000`02ffff00 00000000`77d6b6da ntdll!RtlpWorkerThread+0×71

00000000`02ffff80 00000000`00000000 kernel32!BaseThreadStart+0×3a
Checking disassembly we see that DllA module code dereferenced a NULL code pointer:
0:009> ub DllA!DllUnregisterServer+0×8401

DllA!DllUnregisterServer+0×83e4:

00000000`67199824 0100            add     dword ptr [rax],eax

00000000`67199826 00488b          add     byte ptr [rax-75h],cl

00000000`67199829 cdff            int     0FFh

00000000`6719982b 1568ad0100      adc     eax,1AD68h

00000000`67199830 85c0            test    eax,eax

00000000`67199832 0f85d8000000    jne     DllA!DllUnregisterServer+0×84d0 (00000000`67199910)

00000000`67199838 488bcd          mov     rcx,rbp

00000000`6719983b ff1547ad0100    call    qword ptr [DllA!DllUnregisterServer+0×23148 (00000000`671b4588)]
0:009> dq 00000000`671b4588

00000000`671b4588  00000000`00000000 00000000`00000000

00000000`671b4598  000007ff`77317e40 00000000`00000000

00000000`671b45a8  00000000`00000000 00000000`00000000

00000000`671b45b8  00000000`00000000 00000000`00000000

00000000`671b45c8  00000000`00000000 00000000`00000000

00000000`671b45d8  000007ff`77310000 00000000`01b81240

00000000`671b45e8  00000000`00000001 00000000`020c09c0

00000000`671b45f8  00000000`00000001 00000001`00000001
- Dmitry Vostokov @ DumpAnalysis.org -
Easy to remember 67th bugtation: 6 days and 7 nights and especially
“Seven” debugging “nights.”
- Dmitry Vostokov @ DumpAnalysis.org -
DumpAnalysis.org jointly with OpenTask publisher announces forthcoming 2009 as
The Year of Debugging
More plans and projects will be announced soon with the new updated publishing roadmap! Stay tuned.
- Dmitry Vostokov @ DumpAnalysis.org -
Got this book yesterday in the post and started reading. Table of contents is amazing for its practical depth and breadth. If you want me to provide a review in a language of concurrency (I’m reading many books in parallel) I would simply say one word:
Priority!
It simply means priority reading for any Windows software developer and maintainer. Invaluable for any engineer debugging complex software problems and analyzing Windows crash dumps. Simply because Microsoft OS and CLR developers use all this concurrent stuff and best practices described in the book so it is vital to be able recognize them in memory dumps. After reading this book you also get priority boost in your understanding of process and thread dynamics and your ability to plan, architect, design and implement concurrent applications and services.
Concurrent Programming on Windows (Microsoft .NET Development Series)
- Dmitry Vostokov @ DumpAnalysis.org -
“The” computer “is the only place where” a crash “comes before” hang.
Anonymous American Saying
- Dmitry Vostokov @ DumpAnalysis.org -
“… the” debugger “(my almighty” application ”) …”
Thomas Jefferson, TO JAMES MONROE, Paris Mar. 18. 1785
- Dmitry Vostokov @ DumpAnalysis.org -
“How can you say my” computation “is not a success?” Has it “not for more than sixty” days “got enough to” process “and escaped being” crashed?
Logan Pearsall Smith, Last Words
- Dmitry Vostokov @ DumpAnalysis.org -
Recently I got another manual complete memory dump from a hang workstation where default analysis pointed to a possibility for a Spiking Thread pattern:
0: kd> !analyze -v

[...]

MANUALLY_INITIATED_CRASH (e2)

The user manually initiated this crash dump.

Arguments:

Arg1: 00000000

Arg2: 00000000

Arg3: 00000000

Arg4: 00000000

[...]

GetContextState failed, 0x80070026

Unable to read selector for PCR for processor 1

GetContextState failed, 0x80070026

Unable to read selector for PCR for processor 1
PROCESS_NAME: AppA.exe
CURRENT_IRQL: 0
LAST_CONTROL_TRANSFER: from 808b73a4 to 808b72cb
STACK_TEXT:

f46f5b44 808b73a4 e1a36008 00000004 00000018 nt!HvpFindFreeCellInThisViewWindow+0xd7

f46f5b6c 808bd07b e1a36008 00000002 00000018 nt!HvpFindFreeCell+0x98

f46f5b98 808bd588 e1a36008 e1a362fc 00000000 nt!HvpDoAllocateCell+0x69

f46f5bbc 808d0b22 e1a36008 009214a0 c94e24a4 nt!HvReallocateCell+0x9a

f46f5bdc 808c1028 e1a36008 051fa3e8 00000003 nt!CmpAddValueToList+0x46

f46f5c28 808c406a e1a36008 cddb7ccc f46f5d0c nt!CmpSetValueKeyNew+0xfa

f46f5cb4 808b7e2f e45872e0 f46f5d0c 00000004 nt!CmSetValueKey+0x426

f46f5d44 8088978c 00000438 0012fad0 00000000 nt!NtSetValueKey+0x241

f46f5d44 7c8285ec 00000438 0012fad0 00000000 nt!KiFastCallEntry+0xfc

0012fa58 7c827b7b 77f77703 00000438 0012fad0 ntdll!KiFastSystemCallRet

0012fa5c 77f77703 00000438 0012fad0 00000000 ntdll!ZwSetValueKey+0xc

0012faa0 77f5ec90 00000438 0012fad0 00000004 ADVAPI32!LocalBaseRegSetValue+0x12c

0012fb04 60072e40 00000438 6290c0c4 00000000 ADVAPI32!RegSetValueExA+0x160

WARNING: Stack unwind information not available. Following frames may be wrong.

0012fbf4 628e2d57 60062e70 60062b40 80000001 DLLA!GetObjectId+0×9600

[…]
FOLLOWUP_IP:

nt!HvpFindFreeCellInThisViewWindow+d7

808b72cb 034508          add     eax,dword ptr [ebp+8]
Looking at this thread information we see it RUNNING (this is also evident from its call stack):
0: kd> !thread

THREAD 8a0b2890  Cid 0814.10e8  Teb: 7ffdf000 Win32Thread: bc217c68 RUNNING on processor 0

Not impersonating

DeviceMap                 e440acc0

Owning Process            8a0d85f8       Image:         AppA.exe

Wait Start TickCount      153974         Ticks: 0

Context Switch Count      16905                 LargeStack

UserTime                  00:00:03.109

KernelTime                00:00:17.500

[…]
We also see that the thread accumulated 17 seconds as time spent in kernel. Switching to AppA process context and looking at its Image version we see that it is 5.80.x:
0: kd> lmv m AppA

start    end        module name

00400000 0049c000   AppA   (deferred)

    Image path: C:\PROGRA~1\AppA\AppA.exe

    Image name: AppA.exe

    Timestamp:        Thu Jun 05 14:51:52 2008 (4847EF78)

    CheckSum:         0009D068

    ImageSize:        0009C000

    File version:     5.80.5.1764

    Product version:  5.80.0.0
However from Google search we can find that there is newer version available (variant of Not My Version pattern) and even some indication on various forums that the older ones had problems with CPU resource utilization. We may stop here but I usually scan all threads for any suspicious signs and we can see another running thread on the second CPU:
THREAD 8a2ed5d0  Cid 11b4.1100  Teb: 7ffdf000 Win32Thread: bc342b80 RUNNING on processor 1

Not impersonating

DeviceMap                 e44fc100

Owning Process            8a1efcb0       Image:         calc.exe

Wait Start TickCount      153973         Ticks: 1 (0:00:00:00.015)

Context Switch Count      50736                 LargeStack

UserTime                  00:01:04.515

KernelTime                00:00:00.015

Win32 Start Address calc (0×0101e23a)

Start Address kernel32!BaseProcessStartThunk (0×77e617f8)

Stack Init f4cd6000 Current f4cd5d00 Base f4cd6000 Limit f4cd1000 Call 0

Priority 6 BasePriority 6 PriorityDecrement 0

Unable to get context for thread running on processor 1, Win32 error 0n38
We also see that this thread spent more than a minute in user mode. Unfortunately we cannot see its thread stack because the dump shows signs of Truncated Dump pattern:
Loading Dump File [MEMORY.DMP]

Kernel Complete Dump File: Full address space is available
************************************************************

WARNING: Dump file has been truncated.  Data may be missing.

************************************************************

[…]
0: kd> ~1

GetContextState failed, 0×80070026

Unable to read selector for PCR for processor 1

WARNING: Unable to reset page directories

GetContextState failed, 0×80070026

GetContextState failed, 0×80070026

GetContextState failed, 0×80070026

Unable to get program counter

GetContextState failed, 0×80070026

Unable to get current machine context, Win32 error 0n38

GetContextState failed, 0×80070026

GetContextState failed, 0×80070026

GetContextState failed, 0×80070026

GetContextState failed, 0×80070026

GetContextState failed, 0×80070026

GetContextState failed, 0×80070026

GetContextState failed, 0×80070026

GetContextState failed, 0×80070026

GetContextState failed, 0×80070026
The dump file size 4,177,920 Kb is less than amount of physical memory 4,192,948 Kb:
1: kd> !vm

GetContextState failed, 0x80070026

GetContextState failed, 0x80070026

GetContextState failed, 0x80070026

Unable to get program counter
*** Virtual Memory Usage ***

 Physical Memory:     1048237 (   4192948 Kb)

 Page File: \??\R:\pagefile.sys

   Current:   4177920 Kb  Free Space:   4154440 Kb

   Minimum:   4177920 Kb  Maximum:      4194304 Kb
We can stop here and still recommend to upgrade AppA product seen from the thread running on the first processor but the fact that the second thread belongs to innocent calc.exe demands some attention. Was it calculating incessantly some financial figures following button clicks from a financial genius? Taking advantage of a complete memory dump and the fact that this process spent most of the time in user space we can check for Hooked Functions pattern:
1: kd> .process /r /p 8a1efcb0

Implicit process is now 8a1efcb0

Loading User Symbols

..........................

GetContextState failed, 0x80070026

GetContextState failed, 0x80070026

GetContextState failed, 0x80070026

GetContextState failed, 0x80070026

GetContextState failed, 0x80070026

GetContextState failed, 0x80070026

GetContextState failed, 0x80070026

GetContextState failed, 0x80070026

GetContextState failed, 0x80070026

GetContextState failed, 0x80070026

GetContextState failed, 0x80070026

GetContextState failed, 0x80070026
1: kd> !chkimg -lo 50 -d !user32 -v

GetContextState failed, 0x80070026

GetContextState failed, 0x80070026

GetContextState failed, 0x80070026

Unable to get program counter

Searching for module with expression: !user32

Will apply relocation fixups to file used for comparison

Will ignore NOP/LOCK errors

Will ignore patched instructions

Image specific ignores will be applied

Comparison image path: c:\mss\USER32.dll\45D70AC791000\USER32.dll

No range specified
Scanning section:    .text

Size: 392891

Range to scan: 77381000-773e0ebb

    7738c341-7738c345  5 bytes - USER32!CreateWindowExA

 [ 8b ff 55 8b ec:e9 ba 3c 00 c0 ]

[…]

Total bytes compared: 73728(18%)

Number of errors: 75

75 errors : !user32 (7738c341-773a154d)

GetContextState failed, 0×80070026

GetContextState failed, 0×80070026

GetContextState failed, 0×80070026

GetContextState failed, 0×80070026

GetContextState failed, 0×80070026

GetContextState failed, 0×80070026
1: kd> u 7738c341

USER32!CreateWindowExA:

7738c341 e9ba3c00c0      jmp     37390000

7738c346 6801000040      push    40000001h

7738c34b ff7534          push    dword ptr [ebp+34h]

7738c34e ff7530          push    dword ptr [ebp+30h]

7738c351 ff752c          push    dword ptr [ebp+2Ch]

7738c354 ff7528          push    dword ptr [ebp+28h]

7738c357 ff7524          push    dword ptr [ebp+24h]

7738c35a ff7520          push    dword ptr [ebp+20h]

GetContextState failed, 0×80070026

GetContextState failed, 0×80070026

GetContextState failed, 0×80070026
1: kd> u 37390000

37390000 e96b91562e      jmp     HookA!CreateWindowExA (658f9170)

37390005 8bff            mov     edi,edi

37390007 55              push    ebp

37390008 8bec            mov     ebp,esp

3739000a e937c3ff3f      jmp     USER32!CreateWindowExA+0×5 (7738c346)

3739000f 0000            add     byte ptr [eax],al

37390011 0000            add     byte ptr [eax],al

37390013 0000            add     byte ptr [eax],al

GetContextState failed, 0×80070026

GetContextState failed, 0×80070026

GetContextState failed, 0×80070026

GetContextState failed, 0×80070026

GetContextState failed, 0×80070026

GetContextState failed, 0×80070026
Indeed we see that HookA module is involved and we can recommend to test the stability of the system without the product that uses it or upgrading or disabling this component.
- Dmitry Vostokov @ DumpAnalysis.org -
While working on WinDbg command cards and even before that when compiling a comparison table for both WinDbg and GDB I came to an idea of abstract debugging commands that correspond to common debugging tasks, have clear syntax and semantics and serve metaphorically as a basis for conversion of analog thinking to digital debugger assistance (see analog-to-digital conversion for ADC abbreviation). Here a WinDbg extension can help but now I think about using a tree-based approach similar to CMDTREE.TXT for CDA Checklist. More on this later. Any comments or suggestions are greatly appreciated.
- Dmitry Vostokov @ DumpAnalysis.org -
Suddenly the course of my publishing activities bended a little to produce a DIY poster and learning cards to be published soon. Here are the product details:
Annotation:
WinDbg is a powerful debugger from Microsoft Debugging Tools for Windows. It has more than 350 commands that can be used in different debugging scenarios. The cover of this book is a poster featuring crash dump analysis checklist and common patterns seen in memory dumps and live debugging sessions. Inside the book you can find ready to cut learning cards with commands and their descriptions coloured according to their use for crash dump or live debugging sessions and user, kernel or complete memory dumps. Tossing cards can create unexpected connections between commands and help to learn them more quickly. Uncut pages can also serve as birds eye view to WinDbg debugging capabilities. More than 350 WinDbg commands including meta-commands and extensions are included.
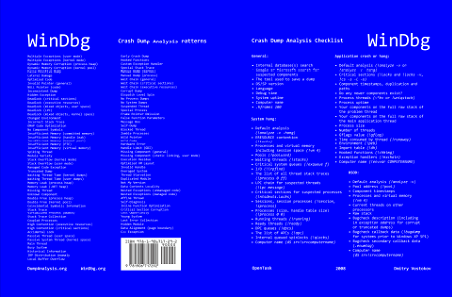
Front cover:
Back cover:
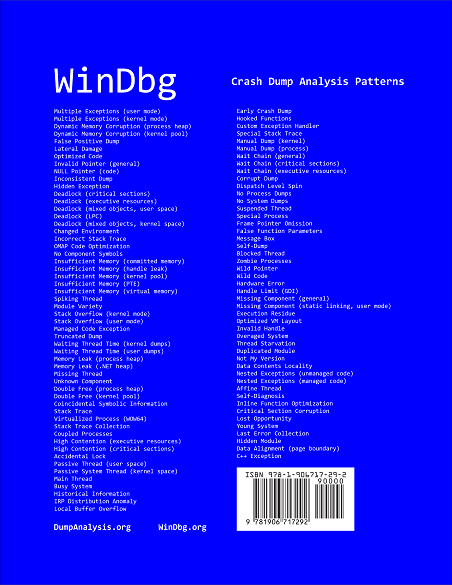
After you take inside pages out you are left with a cover that you can use as a crash dump analysis checklist and patterns poster:
I also plan to update this book on a yearly basis.
- Dmitry Vostokov @ DumpAnalysis.org -
Another example of Wait Chain pattern for objects with ownership semantics is seen in kernel and complete memory dumps where threads are waiting for thread objects. A thread object is a synchronization object whose owner is a thread so they can be easily identified. For example, the main application thread is waiting for an object:
1: kd> !thread 8818e660 16

THREAD 8818e660  Cid 1890.1c50  Teb: 7ffdf000 Win32Thread: b8411008 WAIT: (Unknown) UserMode Non-Alertable

    87d569d8  Thread

    8818e6d8  NotificationTimer

Not impersonating

DeviceMap                 e10008d8

Owning Process            87db5d88       Image:         App.exe

Wait Start TickCount      299006         Ticks: 255 (0:00:00:03.984)

Context Switch Count      1208                 LargeStack

UserTime                  00:00:00.203

KernelTime                00:00:00.203

Start Address kernel32!BaseThreadStartThunk (0×77e617ec)

Stack Init b42c3000 Current b42c2c60 Base b42c3000 Limit b42be000 Call 0

Priority 15 BasePriority 15 PriorityDecrement 0

ChildEBP RetAddr  Args to Child

b42c2c78 80833e8d 8818e660 8818e708 00000003 nt!KiSwapContext+0×26

b42c2ca4 80829b74 00000000 b42c2d14 00000000 nt!KiSwapThread+0×2e5

b42c2cec 8093b034 87d569d8 00000006 00804c01 nt!KeWaitForSingleObject+0×346

b42c2d50 8088ac4c 000001ec 00000000 b42c2d14 nt!NtWaitForSingleObject+0×9a

b42c2d50 7c8285ec 000001ec 00000000 b42c2d14 nt!KiFastCallEntry+0xfc

0006fde4 7c827d0b 77e61d1e 000001ec 00000000 ntdll!KiFastSystemCallRet

0006fde8 77e61d1e 000001ec 00000000 0006fe2c ntdll!NtWaitForSingleObject+0xc

0006fe58 77e61c8d 000001ec 00001388 00000000 kernel32!WaitForSingleObjectEx+0xac

0006fe6c 01039308 000001ec 00001388 00000000 kernel32!WaitForSingleObject+0×12

0006fe94 010204ac 0007cc00 00000001 00000002 App!WaitForNotifyList+0xf2

[…]
However that object is a thread too:
THREAD 87d569d8  Cid 1890.1ec0  Teb: 7ffd9000 Win32Thread: b869ba48 WAIT: (Unknown) UserMode Non-Alertable

    8a1f8870  Thread
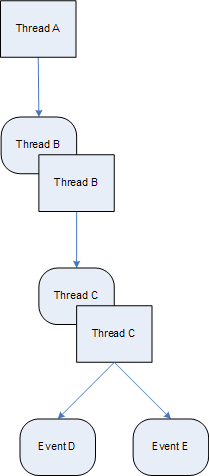
Therefore, we see that thread 8818e660 is waiting for another thread 87d569d8 which belongs to the same process with PID 1890 and thread 87d569d8 itself is waiting for thread 8a1f8870 which has the following stack trace:
1: kd> !thread 8a1f8870 16

THREAD 8a1f8870  Cid 1890.07d8  Teb: 7ff95000 Win32Thread: 00000000 WAIT: (Unknown) UserMode Non-Alertable

    8a0ce4c0  NotificationEvent

    886f1870  NotificationEvent

Not impersonating

DeviceMap                 e10008d8

Owning Process            87db5d88       Image:         App.exe

Wait Start TickCount      292599         Ticks: 6662 (0:00:01:44.093)

Context Switch Count      17

UserTime                  00:00:00.000

KernelTime                00:00:00.000

Win32 Start Address Dll!StartMonitoring (0×758217b8)

Start Address kernel32!BaseThreadStartThunk (0×77e617ec)

Stack Init b6d4f000 Current b6d4e900 Base b6d4f000 Limit b6d4c000 Call 0

Priority 14 BasePriority 13 PriorityDecrement 0

ChildEBP RetAddr  Args to Child

b6d4e918 80833e8d 8a1f8870 00000002 00140000 nt!KiSwapContext+0×26

b6d4e944 808295ab 8a1f8870 00000002 00000000 nt!KiSwapThread+0×2e5

b6d4e978 8093b290 00000002 b6d4eaac 00000001 nt!KeWaitForMultipleObjects+0×3d7

b6d4ebf4 8093b3f2 00000002 b6d4ec1c 00000001 nt!ObpWaitForMultipleObjects+0×202

b6d4ed48 8088ac4c 00000002 026bfc08 00000001 nt!NtWaitForMultipleObjects+0xc8

b6d4ed48 7c8285ec 00000002 026bfc08 00000001 nt!KiFastCallEntry+0xfc

026bfbb8 7c827cfb 77e6202c 00000002 026bfc08 ntdll!KiFastSystemCallRet

026bfbbc 77e6202c 00000002 026bfc08 00000001 ntdll!NtWaitForMultipleObjects+0xc

026bfc64 77e62fbe 00000002 026bfca4 00000000 kernel32!WaitForMultipleObjectsEx+0×11a

026bfc80 6554a01f 00000002 026bfca4 00000000 kernel32!WaitForMultipleObjects+0×18

026bfcfc 758237a3 cd050002 ffffffff 026bfd4c Dll!GetStatusChange+0×7bf

026bffb8 77e64829 75833120 00000000 00000000 Dll!StartMonitoring+0×14b

026bffec 00000000 758217b8 75833120 00000000 kernel32!BaseThreadStart+0×34
Thread 8a1f8870 is waiting for two notification events disjointly which is confirmed by dumping WaitForMultipleObjects arguments. Neither of them is in signaled state and one is a named event “MyEventObject”:
1: kd> dd 026bfc08 l2

026bfc08  0000008c 00000084
1: kd> !handle 0000008c

processor number 1, process 87db5d88

PROCESS 87db5d88  SessionId: 4  Cid: 1890    Peb: 7ffdc000  ParentCid: 01d0

    DirBase: cfe438e0  ObjectTable: e178c228  HandleCount: 439.

    Image: App.exe
Handle table at e50d2000 with 439 Entries in use

008c: Object: 8a0ce4c0  GrantedAccess: 001f0003 Entry: e50d2118

Object: 8a0ce4c0  Type: (8b26ec00) Event

    ObjectHeader: 8a0ce4a8 (old version)

        HandleCount: 1  PointerCount: 3
1: kd> !handle 00000084

processor number 1, process 87db5d88

PROCESS 87db5d88  SessionId: 4  Cid: 1890    Peb: 7ffdc000  ParentCid: 01d0

    DirBase: cfe438e0  ObjectTable: e178c228  HandleCount: 439.

    Image: App.exe
Handle table at e50d2000 with 439 Entries in use

0084: Object: 886f1870  GrantedAccess: 001f0003 (Inherit) Entry: e50d2108

Object: 886f1870  Type: (8b26ec00) Event

    ObjectHeader: 886f1858 (old version)

        HandleCount: 1  PointerCount: 4

        Directory Object: e43ee320  Name: MyEventObject
1: kd> dt _DISPATCHER_HEADER 8a0ce4c0

cutildll!_DISPATCHER_HEADER

   +0×000 Type             : 0 ”

   +0×001 Absolute         : 0 ”

   +0×002 Size             : 0×4 ”

   +0×003 Inserted         : 0 ”

   +0×003 DebugActive      : 0 ”

   +0×000 Lock             : 262144

   +0×004 SignalState      : 0

   +0×008 WaitListHead     : _LIST_ENTRY [ 0×88519d18 - 0×8a1f8918 ]
1: kd> dt _DISPATCHER_HEADER 886f1870

cutildll!_DISPATCHER_HEADER

   +0×000 Type             : 0 ”

   +0×001 Absolute         : 0 ”

   +0×002 Size             : 0×4 ”

   +0×003 Inserted         : 0 ”

   +0×003 DebugActive      : 0 ”

   +0×000 Lock             : 262144

   +0×004 SignalState      : 0

   +0×008 WaitListHead     : _LIST_ENTRY [ 0×88519d30 - 0×8a1f8930 ]
Here is a diagram showing this wait chain:
- Dmitry Vostokov @ DumpAnalysis.org -