Archive for the ‘Debugging Methodology’ Category
Thursday, March 10th, 2011
Because the number of software trace patterns is growing I’m starting another checklist in addition to memory dump analysis checklist. The goal is to help experienced engineers not to miss any important information. The checklist doesn’t prescribe any specific steps, just lists all possible points to double check when looking at a software trace. Of course, it is not complete at the moment and any suggestions are welcome. This post will be modified on the ongoing basis.
General:
• Check overall trace time delta
• Check no trace metafile message density
• Check whether a trace is a multi-part or a circular
• Check for basic facts and the story (software narrative)
• Check for any exceptions, non-false positive errors and periodic errors
• Check for significant events
• Check for discontinuities in the time domain
• Check for message current and acceleration in the frequency domain
- Dmitry Vostokov @ DumpAnalysis.org + TraceAnalysis.org -
Posted in CDF Analysis Tips and Tricks, Debugging, Debugging Methodology, Escalation Engineering, Software Technical Support, Software Trace Analysis, Software Trace Reading, Trace Analysis Patterns, Troubleshooting Methodology | No Comments »
Monday, March 7th, 2011

The first Webinar to start an in-depth discussion of pattern-driven software troubleshooting, debugging and maintenance:
Date: 25th of March 2011
Time: 18:30 (GMT) 14:30 (EST) 11:30 (PST)
Duration: 60 minutes
Space is limited.
Reserve your Webinar seat now at:
https://www3.gotomeeting.com/register/448268158
Topics include:
- A Short History of DumpAnalysis.org
- Memory Dump Analysis Patterns
- Troubleshooting and Debugging Tools (Debugware) Patterns
- Software Trace Analysis Patterns
- From Software Defects to Software Behavior
- Workaround Patterns
- Structural Memory Patterns
- Memory Analysis Domain Pattern Hierarchy
- New Directions
Prerequisites: experience in software troubleshooting and/or debugging.
- Dmitry Vostokov @ DumpAnalysis.org + TraceAnalysis.org -
Posted in .NET Debugging, Analysis Notation, Announcements, AntiPatterns, Best Practices, CDA Pattern Classification, Crash Dump Analysis, Crash Dump Patterns, DebugWare Patterns, Debugging, Debugging Methodology, Debugging Trends, Escalation Engineering, Java Debugging, Linux Crash Corner, Mac Crash Corner, Malware Analysis, Malware Patterns, Memory Analysis Forensics and Intelligence, Memory Dump Analysis Services, Pattern Models, Pattern Prediction, Presentations, Software Behavior Patterns, Software Chorology, Software Engineering, Software Narratology, Software Technical Support, Software Trace Analysis, Software Trace Reading, Software Tracing Implementation Patterns, Software Troubleshooting Patterns, Structural Memory Patterns, Structural Trace Patterns, Systems Thinking, Testing, Trace Analysis Patterns, Training and Seminars, Troubleshooting Methodology, Unified Debugging Patterns, Webinars, Workaround Patterns | No Comments »
Tuesday, January 18th, 2011
Memory Dump Analysis Services announces the launch of CollaborativeA3System for its new and existing customers:
“… is a way to report and discuss memory dump analysis using using well-known and time-proven iterative and incremental processes. Several corporate users can view, comment on and learn various aspects of an analysis report gradually improving initial preliminary analysis to its final deliverable form.”
Source: http://www.dumpanalysis.com/collaborative-analysis-audit-access-system
- Dmitry Vostokov @ DumpAnalysis.org + TraceAnalysis.org -
Posted in Announcements, Crash Dump Analysis, Debugging, Debugging Methodology, Memory Dump Analysis Services, Training and Seminars | No Comments »
Sunday, January 2nd, 2011
Working for more than 7 years in technical support environment I found that many support incidents were resolved more easily by abductive reasoning than by induction and deduction practiced by Sherlock Holmes and observed by Dr. Watson. Abduction as a way to build an incident theory to advance in problem resolution was practiced by a USA colleague of Holmes: Philip Marlowe. Because technical support is less detached from customers (”the world”) when compared to software engineering departments I see the way of Marlowe as more natural. Of course, from time to time the way of Holmes is also appropriate. All depends on a support case. I found that abductive reasoning is also appropriate for memory dump and software trace analysis where “leaps of faith” are necessary because of insufficient information. Such leaps of abduction actually happen all the time when analysts give troubleshooting advice based on patterns.
I plan to write more about the 3rd way of reasoning after I finish reading two Raymond Chandler’s novels and a few other inference, causality and explanation books I mention later: The Big Sleep & Farewell, My Lovely (Modern Library) .
.

I’m grateful for Clive Gamble for pointing this way out in his book Archaeology: The Basics

- Dmitry Vostokov @ DumpAnalysis.org + TraceAnalysis.org -
Posted in Archaeology of Computer Memory, Books, Crash Dump Analysis, Debugging, Debugging Methodology, Dr. Watson, Escalation Engineering, Logic, New Debugging School, Software Technical Support, Software Trace Analysis, The Way of Philip Marlowe, Troubleshooting Methodology | No Comments »
Saturday, January 1st, 2011
With the new year starts the new initiative to integrate traditional multidisciplinary debugging approaches and methodologies with multiplatform pattern-driven software problem solving, unified debugging patterns, best practices in memory dump analysis and software tracing, computer security, economics, and the new emerging trends I’m going to write about during this year.
- Dmitry Vostokov @ DumpAnalysis.org + TraceAnalysis.org -
Posted in Announcements, Best Practices, Computer Forensics, Computer Science, Countefactual Debugging, Crash Analysis Report Environment (CARE), Crash Dump Analysis, Crash Dump Patterns, DebugWare Patterns, Debugging, Debugging Industry, Debugging Methodology, Debugging Trends, Dublin School of Security, Economics, Education and Research, Escalation Engineering, First Fault Problem Solving, Malware Analysis, Malware Patterns, Mathematics of Debugging, Memiotics (Memory Semiotics), Memoretics, Memory Analysis Forensics and Intelligence, Memory Analysis Report System, Memory Dump Analysis Services, Memory Systems Language, Memory Visualization, New Debugging School, Science of Memory Dump Analysis, Science of Software Tracing, Security, Software Behavior Patterns, Software Defect Construction, Software Engineering, Software Generalist, Software Maintenance Institute, Software Narratology, Software Trace Analysis, Software Trace Visualization, Software Tracing Implementation Patterns, Software Troubleshooting Patterns, Structural Memory Patterns, Structural Trace Patterns, Systems Thinking, Testing, Tool Objects, Tools, Trace Analysis Patterns, Training and Seminars, Troubleshooting Methodology, Unified Debugging Patterns, Victimware, Visual Dump Analysis, Webinars, Workaround Patterns | No Comments »
Wednesday, December 29th, 2010
Easy to remember abbreviation SCP (Software Crash Patterns) consists of 3 practices:
- Scripts
- Checklists
- Patterns
- Dmitry Vostokov @ DumpAnalysis.org + TraceAnalysis.org -
Posted in Best Practices, Crash Dump Analysis, Crash Dump Patterns, Debugging, Debugging Methodology | No Comments »
Wednesday, December 29th, 2010
In these post series we are going to discuss the best practices for software tracing implementation including appropriate patterns and their links to software trace analysis patterns. The first one is called Period Timestamp where the start and the end time (and the date if necessary) are recorded in the trace file. This helps in Inter-Correlation and News Value analysis between several different trace types. For example, in one scenario, we had WindowHistory and MessageHistory logs. We identified a problem in the former log as happening at this time:
Handle: 00010196 Class: "ClassA" Title: "TitleA"

   Captured at: 13:36:30:533

[…]
However, when we looked at the latter trace to search for specific window messages posted or sent before that time we saw that the recording started later than the former event:
Start time: 13:36:35:830
Period timestamps are necessary to distinguish Incomplete History from Truncated Trace where in the former case the absence of expected trace message is due to some problem.
From a unified debugging patterns perspective we have this sequence fragment:
Implementation Patterns: Period Timestamp
Usage Patterns: Trace Simultaneously
- Dmitry Vostokov @ DumpAnalysis.org + TraceAnalysis.org -
Posted in Best Practices, Debugging, Debugging Methodology, Software Architecture, Software Engineering, Software Narratology, Software Technical Support, Software Trace Analysis, Software Trace Reading, Software Tracing Implementation Patterns, Trace Analysis Patterns, Troubleshooting Methodology, Unified Debugging Patterns | No Comments »
Friday, December 17th, 2010
As the new decade is approaching (2011-2020) we would like to make a few previews and predictions:
- Increased complexity of software will bring more methods from biological, social sciences and humanities in addition to existing methods of automated debugging and computer science techniques
- Focus on first fault software problem solving (when aspect)
- Focus on pattern-driven software problem solving (how aspect)
- Fusion of debugging and malware analysis into a unified structural and behavioral pattern framework
- Visual debugging, memory and software trace visualization techniques
- Software maintenance certification
- Focus on domain-driven troubleshooting and debugging tools as a service (debugware TaaS)
- Focus on security issues related to memory dumps and software traces
- New scripting languages and programming language extensions for debugging
- The maturation of the science of memory snapshots and software traces (memoretics)
Imagining is not not limited to the above and more to come and explain in the forthcoming parts.
- Dmitry Vostokov @ DumpAnalysis.org + TraceAnalysis.org -
Posted in Announcements, Anthropology, Archaeology of Computer Memory, Biology, Certification, Computer Science, Countefactual Debugging, Crash Analysis Report Environment (CARE), Crash Dump Analysis, Crash Dump Patterns, DebugWare Patterns, Debugging, Debugging Industry, Debugging Methodology, Debugging Trends, Dublin School of Security, EasyDbg, Economics, Escalation Engineering, Evolution, First Fault Problem Solving, Futuristic Memory Dump Analysis, General Memory Analysis, General Science, Geography, Hardware, Hermeneutics of Memory Dumps and Traces, History, Humanities, Language, Laws of Troubleshooting and Debugging, Logic, Malware Analysis, Malware Patterns, Mathematics of Debugging, Memiotics (Memory Semiotics), Memoretics, Memory Analysis Forensics and Intelligence, Memory Analysis Report System, Memory Dump Analysis and History, Memory Systems Language, Memory Visualization, Paleo-debugging, Pattern Models, Pattern Prediction, Physics, Psychology, Publishing, Science of Memory Dump Analysis, Science of Software Tracing, Security, Social Media, Social Sciences, Software Architecture, Software Behavior Patterns, Software Chorography, Software Chorology, Software Defect Construction, Software Engineering, Software Generalist, Software Maintenance Institute, Software Narrative Fiction, Software Narratology, Software Technical Support, Software Trace Analysis, Software Trace Analysis and History, Software Trace Deconstruction, Software Trace Linguistics, Software Trace Visualization, Software Troubleshooting Patterns, Software Victimology, Statistics, Structural Memory Analysis and Social Sciences, Structural Memory Patterns, Structural Trace Patterns, Systems Thinking, Testing, Tools, Trace Analysis Patterns, Troubleshooting Methodology, Unified Debugging Patterns, Uses of UML, Victimware, Virtualization, Visual Dump Analysis, Windows System Administration, Workaround Patterns | No Comments »
Friday, November 12th, 2010
Five volumes of cross-disciplinary Anthology (dubbed by the author “The Summa Memorianica”) lay the foundation of the scientific discipline of Memoretics (study of computer memory snapshots and their evolution in time) that is also called Memory Dump and Software Trace Analysis.ca
The 5th volume contains revised, edited, cross-referenced, and thematically organized selected DumpAnalysis.org blog posts about crash dump, software trace analysis and debugging written in February 2010 - October 2010 for software engineers developing and maintaining products on Windows platforms, quality assurance engineers testing software on Windows platforms, technical support and escalation engineers dealing with complex software issues, and security researchers, malware analysts and reverse engineers. The fifth volume features:
- 25 new crash dump analysis patterns
- 11 new pattern interaction case studies (including software tracing)
- 16 new trace analysis patterns
- 7 structural memory patterns
- 4 modeling case studies for memory dump analysis patterns
- Discussion of 3 common analysis mistakes
- Malware analysis case study
- Computer independent architecture of crash analysis report service
- Expanded coverage of software narratology
- Metaphysical and theological implications of memory dump worldview
- More pictures of memory space and physicalist art
- Classification of memory visualization tools
- Memory visualization case studies
- Close reading of the stories of Sherlock Holmes: Dr. Watson’s observational patterns
- Fully cross-referenced with Volume 1, Volume 2, Volume 3, and Volume 4
Product information:
- Title: Memory Dump Analysis Anthology, Volume 5
- Author: Dmitry Vostokov
- Language: English
- Product Dimensions: 22.86 x 15.24
- Paperback: 400 pages
- Publisher: Opentask (10 December 2010)
- ISBN-13: 978-1-906717-96-4
- Hardcover: 400 pages
- Publisher: Opentask (10 December 2010)
- ISBN-13: 978-1-906717-97-1

Back cover features memory space art image Hot Computation: Memory on Fire.
- Dmitry Vostokov @ DumpAnalysis.org + TraceAnalysis.org -
Posted in Aesthetics of Memory Dumps, Announcements, Archaeology of Computer Memory, Art, Assembly Language, Books, C and C++, CDF Analysis Tips and Tricks, Categorical Debugging, Common Mistakes, Complete Memory Dump Analysis, Computer Science, Crash Analysis Report Environment (CARE), Crash Dump Analysis, Crash Dump De-analysis, Crash Dump Patterns, Debugging, Debugging Methodology, Debugging Slang, Deep Down C++, Dr. Watson, Dublin School of Security, Education and Research, Escalation Engineering, Fun with Crash Dumps, Fun with Debugging, Fun with Software Traces, General Memory Analysis, Hermeneutics of Memory Dumps and Traces, Images of Computer Memory, Kernel Development, Malware Analysis, Malware Patterns, Mathematics of Debugging, Memiotics (Memory Semiotics), Memoidealism, Memoretics, Memory Analysis Culture, Memory Analysis Forensics and Intelligence, Memory Analysis Report System, Memory Diagrams, Memory Dreams, Memory Dump Analysis Jobs, Memory Dump Analysis Services, Memory Dump Analysis and History, Memory Dumps in Movies, Memory Dumps in Myths, Memory Religion (Memorianity), Memory Space Art, Memory Systems Language, Memory Visualization, Memory and Glitches, Memuonics, Metaphysical Society of Ireland, Minidump Analysis, Movies and Debugging, Multithreading, Museum of Debugging, Music for Debugging, Music of Computation, New Acronyms, New Words, Paleo-debugging, Pattern Models, Pattern Prediction, Philosophy, Physicalist Art, Psychoanalysis of Software Maintenance and Support, Publishing, Science of Memory Dump Analysis, Science of Software Tracing, Security, Software Architecture, Software Behavior Patterns, Software Chorography, Software Chorology, Software Defect Construction, Software Engineering, Software Generalist, Software Maintenance Institute, Software Narratology, Software Technical Support, Software Trace Analysis, Software Trace Analysis and History, Software Trace Deconstruction, Software Trace Reading, Software Trace Visualization, Software Tracing for Dummies, Software Troubleshooting Patterns, Software Victimology, Stack Trace Collection, Structural Memory Analysis and Social Sciences, Structural Memory Patterns, Structural Trace Patterns, Systems Thinking, Testing, Theology, Tool Objects, Tools, Trace Analysis Patterns, Training and Seminars, Troubleshooting Methodology, Uses of UML, Victimware, Virtualization, Vista, Visual Dump Analysis, Webinars, WinDbg Scripts, WinDbg Tips and Tricks, WinDbg for GDB Users, Windows 7, Windows Server 2008, Windows System Administration, Workaround Patterns, x64 Windows | No Comments »
Friday, October 8th, 2010
I aim to release a beta version of that unified troubleshooting system together with EasyDbg (as WinDbg add-on) in a few months after finishing porting it to x64 platform. The system is very customizable and similar buttons can be created to launch troubleshooting tools and execute troubleshooting units of work for any client and server applications. It will also be covered in the forthcoming Software Troubleshooting and Debugging Tools presentation.
- Dmitry Vostokov @ DumpAnalysis.org + TraceAnalysis.org -
Posted in Announcements, Debugging, Debugging Methodology, EasyDbg, Escalation Engineering, Memory Dump Analysis Services, Software Technical Support, Tool Objects, Tools, Troubleshooting Methodology | No Comments »
Tuesday, October 5th, 2010
The choice of webinars below mostly reflects my personal preferences and long time desire to speak on topics like systems thinking, troubleshooting tool design and development. The other topic about BSOD minidump analysis was requested by participants in an ongoing survey. There will be more topics in 2011. All forthcoming webinars will be hosted by Memory Dump Analysis Services. The planning list includes:
Systems Thinking in Memory Dump and Software Trace Analysis
Software Troubleshooting and Debugging Tools: Objects, Components, Patterns and Frameworks with UML
- UML basics
- DebugWare patterns
- Unified Troubleshooting Framework
- RADII software development process
- Hands-on exercise: designing and building a tool
Blue Screen Of Death Analysis Done Right: Minidump Investigation for System Administrators
- Making sense of !analyze –v output
- Get extra troubleshooting information with additional WinDbg commands
- Guessing culprits with raw stack analysis
- Who’s responsible: hardware or software?
- Checklist and patterns
- Including hands-on exercises: send your own minidumps
More detailed information will be available soon.
- Dmitry Vostokov @ DumpAnalysis.org + TraceAnalysis.org -
Posted in Announcements, CDF Analysis Tips and Tricks, Common Mistakes, Common Questions, Crash Analysis Report Environment (CARE), Crash Dump Analysis, Crash Dump De-analysis, Crash Dump Patterns, Crash Dumps for Dummies, DebugWare Patterns, Debugging, Debugging Industry, Debugging Methodology, Escalation Engineering, General Memory Analysis, Hermeneutics of Memory Dumps and Traces, Memory Systems Language, Minidump Analysis, Software Architecture, Software Behavior Patterns, Software Engineering, Software Technical Support, Software Trace Analysis, Software Tracing for Dummies, Structural Memory Patterns, Systems Thinking, Tools, Trace Analysis Patterns, Training and Seminars, Troubleshooting Methodology, Vista, Webinars, WinDbg Tips and Tricks, Windows 7, Windows Server 2008, Windows System Administration, x64 Windows | No Comments »
Monday, September 27th, 2010
You are probably aware of Application and Driver Verifiers (including gflags.exe tool from Debugging Tools for Windows). These tools set flags that modify the behaviour of the system that is reflected in additional information being collected such as memory allocation history and in WinDbg output changes such as stack traces. These tools belong to a broad class of instrumentation tools and I call the analysis pattern Instrumentation Information. To check in a minidump, kernel and complete memory dumps whether Driver Verifier was enabled we use !verifier WinDbg command:
1: kd> !verifier
Verify Level 0 ... enabled options are:
Summary of All Verifier Statistics
RaiseIrqls                             0x0

AcquireSpinLocks                       0x0

Synch Executions                       0x0

Trims                                  0x0
Pool Allocations Attempted             0x0

Pool Allocations Succeeded             0x0

Pool Allocations Succeeded SpecialPool 0x0

Pool Allocations With NO TAG           0x0

Pool Allocations Failed                0x0

Resource Allocations Failed Deliberately   0x0
Current paged pool allocations         0x0 for 00000000 bytes

Peak paged pool allocations            0x0 for 00000000 bytes

Current nonpaged pool allocations      0x0 for 00000000 bytes

Peak nonpaged pool allocations         0x0 for 00000000 bytes
0: kd> !verifier
Verify Level 3 ... enabled options are:

       Special pool

       Special irql
Summary of All Verifier Statistics
RaiseIrqls                             0xdea5

AcquireSpinLocks                       0x87b5c

Synch Executions                       0x17b5

Trims                                  0xab36
Pool Allocations Attempted             0x8990e

Pool Allocations Succeeded             0x8990e

Pool Allocations Succeeded SpecialPool 0x29c0

Pool Allocations With NO TAG           0x1

Pool Allocations Failed                0x0

Resource Allocations Failed Deliberately   0x0
Current paged pool allocations         0x0 for 00000000 bytes

Peak paged pool allocations            0x0 for 00000000 bytes

Current nonpaged pool allocations      0x0 for 00000000 bytes

Peak nonpaged pool allocations         0x0 for 00000000 bytes
To check in a process user dump that Application Verifier (and gflags) was enabled use !avrf and !gflags WinDbg extension commands:
0:001> !avrf

Application verifier is not enabled for this process.

Page heap has been enabled separately.
0:001> !gflag

Current NtGlobalFlag contents: 0x02000000

    hpa - Place heap allocations at ends of pages
Here is an example of an instrumented stack trace:
68546e88 verifier!AVrfpDphFindBusyMemoryNoCheck+0xb8

68546f95 verifier!AVrfpDphFindBusyMemory+0×15

68547240 verifier!AVrfpDphFindBusyMemoryAndRemoveFromBusyList+0×20

68549080 verifier!AVrfDebugPageHeapFree+0×90

77190aac ntdll!RtlDebugFreeHeap+0×2f

7714a8ff ntdll!RtlpFreeHeap+0×5d

770f2a32 ntdll!RtlFreeHeap+0×142

75fb14d1 kernel32!HeapFree+0×14

748d4c39 msvcr80!free+0xcd

[…]

00a02bb2 ServiceA!ServiceMain+0×302

767175a8 sechost!ScSvcctrlThreadA+0×21

75fb3677 kernel32!BaseThreadInitThunk+0xe

770f9d42 ntdll!__RtlUserThreadStart+0×70

770f9d15 ntdll!_RtlUserThreadStart+0×1b
Another example that shows instrumentation difference. We run double free fault modeling application and see its stack trace from a crash dump:
0:000> !gflag

Current NtGlobalFlag contents: 0x00000000
0:000> kL 100

Child-SP          RetAddr           Call Site

00000000`002dec38 00000000`77735ce2 ntdll!NtWaitForSingleObject+0xa

00000000`002dec40 00000000`77735e85 ntdll!RtlReportExceptionEx+0x1d2

00000000`002ded30 00000000`77735eea ntdll!RtlReportException+0xb5

00000000`002dedb0 00000000`77736d25 ntdll!RtlpTerminateFailureFilter+0x1a

00000000`002dede0 00000000`77685148 ntdll!RtlReportCriticalFailure+0x96

00000000`002dee10 00000000`776a554d ntdll!_C_specific_handler+0x8c

00000000`002dee80 00000000`77685d1c ntdll!RtlpExecuteHandlerForException+0xd

00000000`002deeb0 00000000`776862ee ntdll!RtlDispatchException+0x3cb

00000000`002df590 00000000`77736cd2 ntdll!RtlRaiseException+0x221

00000000`002dfbd0 00000000`77737396 ntdll!RtlReportCriticalFailure+0x62

00000000`002dfca0 00000000`777386c2 ntdll!RtlpReportHeapFailure+0x26

00000000`002dfcd0 00000000`7773a0c4 ntdll!RtlpHeapHandleError+0x12

00000000`002dfd00 00000000`776dd1cd ntdll!RtlpLogHeapFailure+0xa4

00000000`002dfd30 00000000`77472c7a ntdll! ?? ::FNODOBFM::`string'+0x123b4

00000000`002dfdb0 00000000`6243c7bc kernel32!HeapFree+0xa

00000000`002dfde0 00000001`3f8f1033 msvcr90!free+0x1c

00000000`002dfe10 00000001`3f8f11f2 InstrumentedApp!wmain+0x33

00000000`002dfe50 00000000`7746f56d InstrumentedApp!__tmainCRTStartup+0x11a

00000000`002dfe80 00000000`776a3281 kernel32!BaseThreadInitThunk+0xd

00000000`002dfeb0 00000000`00000000 ntdll!RtlUserThreadStart+0x1d
Then we enable Application Verifier and full page heap in gflags.exe GUI. Actually 2 crash dumps are saved at the same time (we’d set up LocalDumps registry key on x64 W2K8 R2) with slightly different stack traces:
0:000> !gflag

Current NtGlobalFlag contents: 0x02000100

    vrf - Enable application verifier

    hpa - Place heap allocations at ends of pages
0:000> kL 100

Child-SP          RetAddr           Call Site

00000000`0022e438 00000000`77735ce2 ntdll!NtWaitForSingleObject+0xa

00000000`0022e440 00000000`77735e85 ntdll!RtlReportExceptionEx+0x1d2

00000000`0022e530 000007fe`f3ed26fb ntdll!RtlReportException+0xb5

00000000`0022e5b0 00000000`77688a8f verifier!AVrfpVectoredExceptionHandler+0×26b

00000000`0022e640 00000000`776859b2 ntdll!RtlpCallVectoredHandlers+0xa8

00000000`0022e6b0 00000000`776bfe48 ntdll!RtlDispatchException+0×22

00000000`0022ed90 000007fe`f3eca668 ntdll!KiUserExceptionDispatcher+0×2e

00000000`0022f350 000007fe`f3ec931d verifier!VerifierStopMessage+0×1f0

00000000`0022f400 000007fe`f3ec9736 verifier!AVrfpDphReportCorruptedBlock+0×155

00000000`0022f4c0 000007fe`f3ec99cd verifier!AVrfpDphCheckNormalHeapBlock+0xce

00000000`0022f530 000007fe`f3ec873a verifier!AVrfpDphNormalHeapFree+0×29

00000000`0022f560 00000000`7773c415 verifier!AVrfDebugPageHeapFree+0xb6

00000000`0022f5c0 00000000`776dd0fe ntdll!RtlDebugFreeHeap+0×35

00000000`0022f620 00000000`776c2075 ntdll! ?? ::FNODOBFM::`string’+0×122e2

00000000`0022f960 000007fe`f3edf4e1 ntdll!RtlFreeHeap+0×1a2

00000000`0022f9e0 00000000`77472c7a verifier!AVrfpRtlFreeHeap+0xa5

00000000`0022fa80 000007fe`f3ee09ae kernel32!HeapFree+0xa

00000000`0022fab0 00000000`642bc7bc verifier!AVrfpHeapFree+0xc6

00000000`0022fb40 00000001`3fac1033 msvcr90!free+0×1c

00000000`0022fb70 00000001`3fac11f2 InstrumentedApp!wmain+0×33

00000000`0022fbb0 00000000`7746f56d InstrumentedApp!__tmainCRTStartup+0×11a

00000000`0022fbe0 00000000`776a3281 kernel32!BaseThreadInitThunk+0xd

00000000`0022fc10 00000000`00000000 ntdll!RtlUserThreadStart+0×1d
0:000> kL 100

Child-SP          RetAddr           Call Site

00000000`0022e198 000007fe`f3ee0f82 ntdll!NtWaitForMultipleObjects+0xa

00000000`0022e1a0 000007fe`fd8513a6 verifier!AVrfpNtWaitForMultipleObjects+0×4e

00000000`0022e1e0 000007fe`f3ee0e2d KERNELBASE!WaitForMultipleObjectsEx+0xe8

00000000`0022e2e0 000007fe`f3ee0edd verifier!AVrfpWaitForMultipleObjectsExCommon+0xad

00000000`0022e320 00000000`77473143 verifier!AVrfpKernelbaseWaitForMultipleObjectsEx+0×2d

00000000`0022e370 00000000`774e9025 kernel32!WaitForMultipleObjectsExImplementation+0xb3

00000000`0022e400 00000000`774e91a7 kernel32!WerpReportFaultInternal+0×215

00000000`0022e4a0 00000000`774e91ff kernel32!WerpReportFault+0×77

00000000`0022e4d0 00000000`774e941c kernel32!BasepReportFault+0×1f

00000000`0022e500 00000000`7770573c kernel32!UnhandledExceptionFilter+0×1fc

00000000`0022e5e0 00000000`77685148 ntdll! ?? ::FNODOBFM::`string’+0×2365

00000000`0022e610 00000000`776a554d ntdll!_C_specific_handler+0×8c

00000000`0022e680 00000000`77685d1c ntdll!RtlpExecuteHandlerForException+0xd

00000000`0022e6b0 00000000`776bfe48 ntdll!RtlDispatchException+0×3cb

00000000`0022ed90 000007fe`f3eca668 ntdll!KiUserExceptionDispatcher+0×2e

00000000`0022f350 000007fe`f3ec931d verifier!VerifierStopMessage+0×1f0

00000000`0022f400 000007fe`f3ec9736 verifier!AVrfpDphReportCorruptedBlock+0×155

00000000`0022f4c0 000007fe`f3ec99cd verifier!AVrfpDphCheckNormalHeapBlock+0xce

00000000`0022f530 000007fe`f3ec873a verifier!AVrfpDphNormalHeapFree+0×29

00000000`0022f560 00000000`7773c415 verifier!AVrfDebugPageHeapFree+0xb6

00000000`0022f5c0 00000000`776dd0fe ntdll!RtlDebugFreeHeap+0×35

00000000`0022f620 00000000`776c2075 ntdll! ?? ::FNODOBFM::`string’+0×122e2

00000000`0022f960 000007fe`f3edf4e1 ntdll!RtlFreeHeap+0×1a2

00000000`0022f9e0 00000000`77472c7a verifier!AVrfpRtlFreeHeap+0xa5

00000000`0022fa80 000007fe`f3ee09ae kernel32!HeapFree+0xa

00000000`0022fab0 00000000`642bc7bc verifier!AVrfpHeapFree+0xc6

00000000`0022fb40 00000001`3fac1033 msvcr90!free+0×1c

00000000`0022fb70 00000001`3fac11f2 InstrumentedApp!wmain+0×33

00000000`0022fbb0 00000000`7746f56d InstrumentedApp!__tmainCRTStartup+0×11a

00000000`0022fbe0 00000000`776a3281 kernel32!BaseThreadInitThunk+0xd

00000000`0022fc10 00000000`00000000 ntdll!RtlUserThreadStart+0×1d
We also see above that enabling instrumentation triggers debug functions of runtime heap (RtlDebugFreeHeap).
- Dmitry Vostokov @ DumpAnalysis.org + TraceAnalysis.org -
Posted in Crash Dump Analysis, Crash Dump Patterns, Debugging, Debugging Methodology, Troubleshooting Methodology | 1 Comment »
Sunday, June 13th, 2010
By analogy with paratext let’s introduce a software narratological concept of the extended software trace that consists of a software trace plus additional supporting information that makes troubleshooting and debugging easier. Such “paratextual” information can consists of pictures, videos, accounts of scenarios and past problem histories, customer interviews and even software trace delivery medium and format (if preformatted).
- Dmitry Vostokov @ DumpAnalysis.org + TraceAnalysis.org -
Posted in Debugging, Debugging Methodology, Escalation Engineering, Science of Software Tracing, Software Engineering, Software Narratology, Software Technical Support, Software Trace Analysis, Software Trace Reading | 1 Comment »
Tuesday, April 20th, 2010
The following tool published by Citrix follows DebugWare patterns in its overall architecture and design and was implemented by a team of engineers using RADII process:
SsOnExpert - Single Sign-On XenApp Plug-in Troubleshooting Tool
- Dmitry Vostokov @ DumpAnalysis.org + TraceAnalysis.org -
Posted in Announcements, Citrix, DebugWare Patterns, Debugging, Debugging Methodology, Escalation Engineering, Software Architecture, Software Engineering, Software Maintenance Institute, Software Technical Support, Tools, Troubleshooting Methodology | No Comments »
Sunday, April 18th, 2010
OpenTask to offer first 3 volumes of Memory Dump Analysis Anthology in one set:


The set is available exclusively from OpenTask e-Commerce web site starting from June. Individual volumes are also available from Amazon, Barnes & Noble and other bookstores worldwide.
Product information:
- Title: Modern Memory Dump and Software Trace Analysis: Volumes 1-3
- Author: Dmitry Vostokov
- Language: English
- Product Dimensions: 22.86 x 15.24
- Paperback: 1600 pages
- Publisher: Opentask (31 May 2010)
- ISBN-13: 978-1-906717-99-5
Information about individual volumes:
- Dmitry Vostokov @ DumpAnalysis.org + TraceAnalysis.org -
Posted in .NET Debugging, Aesthetics of Memory Dumps, Announcements, AntiPatterns, Art, Assembly Language, Books, Bugchecks Depicted, C and C++, CDA Pattern Classification, CDF Analysis Tips and Tricks, Categorical Debugging, Certification, Citrix, Code Reading, Common Mistakes, Computational Ghosts and Bug Hauntings, Computer Science, Countefactual Debugging, Crash Analysis Report Environment (CARE), Crash Dump Analysis, Crash Dump Patterns, Crash Dumps for Dummies, Data Recovery, DebugWare Patterns, Debugging, Debugging Methodology, Debugging Slang, Deep Down C++, Dictionary of Debugging, Dr. Watson, Education and Research, Escalation Engineering, Fun with Crash Dumps, Futuristic Memory Dump Analysis, GDB for WinDbg Users, Hardware, History, Horrors of Computation, Hyper-V, Intelligent Memory Movement, Kernel Development, Laws of Troubleshooting and Debugging, Mathematics of Debugging, Memiotics (Memory Semiotics), Memoidealism, Memoretics, Memory Analysis Culture, Memory Analysis Forensics and Intelligence, Memory Auralization, Memory Dump Analysis Jobs, Memory Religion (Memorianity), Memory Space Art, Memory Space Music, Memory Systems Language, Memory Visualization, Memuonics, Minidump Analysis, Multithreading, Music for Debugging, Music of Computation, New Acronyms, New Words, Occult Debugging, Philosophy, Psi-computation, Publishing, Science of Memory Dump Analysis, Science of Software Tracing, Security, Software Architecture, Software Defect Construction, Software Engineering, Software Generalist, Software Maintenance Institute, Software Narratology, Software Technical Support, Software Trace Analysis, Software Trace Visualization, Software Tracing for Dummies, Software Victimology, Stack Trace Collection, Testing, Tools, Trace Analysis Patterns, Training and Seminars, Troubleshooting Methodology, Victimware, Virtualization, Vista, Visual Dump Analysis, WinDbg Scripts, WinDbg Tips and Tricks, WinDbg for GDB Users, Windows 7, Windows Server 2008, Windows System Administration | No Comments »
Friday, April 9th, 2010
Plan to start providing training and seminars in my free time. If you are interested please answer these questions (you can either respond here in comments or use this form for private communication http://www.dumpanalysis.org/contact):
- Are you interested in on-site training, prefer traveling or attending webinars?
- Are you interested in software trace analysis as well?
- What specific topics are you interested in?
- What training level (beginner, intermediate, advanced) are you interested in? (please provide an example, if possible)
Additional topics of expertise that can be integrated into training include Source Code Reading and Analysis, Debugging, Windows Architecture, Device Drivers, Troubleshooting Tools Design and Implementation, Multithreading, Deep Down C and C++, x86 and x64 Assembly Language Reading.
Looking forward to your responses. Any suggestions are welcome.
- Dmitry Vostokov @ DumpAnalysis.org + TraceAnalysis.org -
Posted in .NET Debugging, Announcements, AntiPatterns, Assembly Language, Bugchecks Depicted, C and C++, CDA Pattern Classification, CDF Analysis Tips and Tricks, Certification, Code Reading, Common Mistakes, Crash Analysis Report Environment (CARE), Crash Dump Analysis, Crash Dump Patterns, Crash Dumps for Dummies, Data Recovery, DebugWare Patterns, Debugging, Debugging Methodology, Deep Down C++, Education and Research, Escalation Engineering, FreeBSD Crash Corner, GDB for WinDbg Users, Hardware, Hyper-V, Java Debugging, Kernel Development, Laws of Troubleshooting and Debugging, Linux Crash Corner, Mac Crash Corner, Memory Analysis Forensics and Intelligence, Memory Visualization, Minidump Analysis, Multithreading, Security, Software Architecture, Software Defect Construction, Software Engineering, Software Generalist, Software Maintenance Institute, Software Narratology, Software Technical Support, Software Trace Analysis, Software Trace Visualization, Software Tracing for Dummies, Software Victimology, Stack Trace Collection, Testing, Tools, Trace Analysis Patterns, Training and Seminars, Troubleshooting Methodology, Victimware, Virtualization, Vista, Visual Dump Analysis, WinDbg Scripts, WinDbg Tips and Tricks, WinDbg for GDB Users, Windows 7, Windows Server 2008, Windows System Administration, Workaround Patterns | No Comments »
Saturday, March 13th, 2010
This is a new methodology I’m working upon. The idea came from reading “About the Author” page in a book I got yesterday in my post:
The Nomadic Developer: Surviving and Thriving in the World of Technology Consulting

I post a review here and on Amazon when finished reading. Just a few words now. This is the first career book I’m reading where I find pages in roman numerals useful. The page xiii itself looks like a good template (or an example) for a business-oriented CV summary. Thinking now about updating my CV book (2nd edition?):
Resume and CV: As a Book

- Dmitry Vostokov @ DumpAnalysis.org + TraceAnalysis.org -
Posted in Announcements, Books, Business, Crash Dump Analysis, Debugging, Debugging Methodology, Troubleshooting Methodology | 1 Comment »
Monday, September 14th, 2009
Ntdebugging blog has put the link to the video online from Microsoft Global Engineering Conference where I presented the pattern-driven memory dump analysis methodology:
Citrix engineers at Microsoft GEC
Note: you need to open a video link URL from the blog post in Windows Media Player if you don’t have an association for WMV files or save the file.
- Dmitry Vostokov @ DumpAnalysis.org -
Posted in Announcements, Citrix, Crash Dump Analysis, Crash Dump Patterns, Debugging, Debugging Methodology, Troubleshooting Methodology | No Comments »
Thursday, May 14th, 2009
Part 2 briefly discussed debuggers and their commands. Debugger commands can be grouped together into scripts that can be run against memory dump files and their resulted textual output can be redirected to log files.
Therefore we start with the first step in our analysis process diagram introduced in Part 1:
Information Collection: Scripts
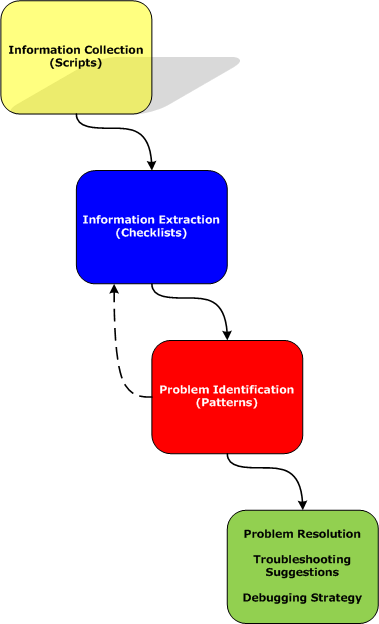
Here a script is a sequence of instructions to extract formatted textual information from a memory dump file (or a live system). There are many advantages of scripts and logs. Many companies, for example, banks, avoid sending plain memory dump files because of security considerations in order to prevent exposure of company or private information. After the advent of 64-bit personal computing complete memory dump files became larger and larger and it is now common to get 32Gb memory dumps. Processing multiple long-running commands can easily be done from textual log files. Additionally, scripts can be used to process hundreds of memory dumps in one go to look for similarities and differences. Many tools can be used for such purpose including built-in debugger scripting capabilities, shell scripting and regular expressions for intelligent search.
- Dmitry Vostokov @ DumpAnalysis.org -
Posted in Citrix, Crash Dump Analysis, Crash Dump Patterns, Debugging, Debugging Methodology, Memory Analysis Forensics and Intelligence, Security, Software Technical Support, Troubleshooting Methodology, WinDbg Scripts | No Comments »
Tuesday, April 21st, 2009
Before we explain stages of the analysis process shown in Part 1, let’s start with a brief overview of memory dumps, debuggers and logs. Recall that a memory dump is a snapshot of a process, system or physical memory state. This unifies post-mortem analysis and live debugging. Debuggers are tools that allow us to get and modify these memory snapshots. Other tools that allow us to get memory dump files are process dumpers like userdump.exe, Task Manager since Vista, WER, and system dumpers like LiveKd and Win32dd. We should not forget tools and methods that allow us to trigger Windows kernel ability to save consistent memory dump files: NMI button, keyboard method and various software bugcheck-triggers like Citrix SystemDump. Now coming back to debuggers. One of their essential features is to save a debugging session log, formatted textual output saved in a text file for further processing. One good example is !process 0 ff WinDbg command to output all processes and their thread stack traces (see Stack Trace Collection pattern for other variations).
I’ve created a page to add all P-DMA parts as soon as I write them:
Pattern-Driven Memory Analysis
- Dmitry Vostokov @ DumpAnalysis.org -
Posted in Citrix, Crash Dump Analysis, Crash Dump Patterns, Debugging, Debugging Methodology, Memory Analysis Forensics and Intelligence, Security, Software Technical Support, Troubleshooting Methodology, WinDbg Scripts | 1 Comment »