Archive for the ‘Assembly Language’ Category
Sunday, March 25th, 2012
This is a Mac OS X / GDB counterpart to NULL Pointer (data) pattern previously described for Windows platforms:
(gdb) bt

#0  0×000000010d3b0e90 in bar () at main.c:15

#1  0×000000010d3b0ea9 in foo () at main.c:20

#2  0×000000010d3b0ec4 in main (argc=1,

argv=0×7fff6cfafbf8) at main.c:25
(gdb) disassemble

Dump of assembler code for function bar:

0x000000010d3b0e80 <bar+0>:	push   %rbp

0×000000010d3b0e81 <bar+1>:	mov    %rsp,%rbp

0×000000010d3b0e84 <bar+4>:	movq   $0×0,-0×8(%rbp)

0×000000010d3b0e8c <bar+12>:	mov    -0×8(%rbp),%rax

0×000000010d3b0e90 <bar+16>:	movl   $0×1,(%rax)

0×000000010d3b0e96 <bar+22>:	pop    %bp

0×000000010d3b0e97 <bar+23>:	retq

End of assembler dump.
(gdb) p/x $rax

$1 = 0×0
- Dmitry Vostokov @ DumpAnalysis.org + TraceAnalysis.org -
Forthcoming Training: Accelerated Mac OS X Core Dump Analysis
Posted in Assembly Language, Core Dump Analysis, Crash Dump Analysis, Crash Dump Patterns, Debugging, GDB for WinDbg Users, Mac Crash Corner, Mac OS X, Software Defect Construction, x64 Mac OS X | No Comments »
Saturday, March 3rd, 2012

Memory Dump Analysis Services organizes a new training course:
Description: Learn how to analyze app crashes and freezes, navigate through process core memory dump space and diagnose corruption, memory leaks, CPU spikes, blocked threads, deadlocks, wait chains, and much more. We use a unique and innovative pattern-driven analysis approach to speed up the learning curve. The training consists of practical step-by-step exercises using Xcode and GDB environments highlighting various patterns diagnosed in 64-bit process core memory dumps. The training also includes an overview of relevant similarities and differences between Windows and Mac OS X user space memory dump analysis useful for engineers with Wintel background.
If you are registered you are allowed to optionally submit your app core dumps before the training. This will allow us in addition to the carefully constructed problems tailor additional examples to the needs of the attendees.
The training consists of 2 two-hour sessions. When you finish the training you additionally get:
- A full transcript in PDF format (retail price $200)
- 6 volumes of Memory Dump Analysis Anthology in PDF format (retail price $120)
- A personalized attendance certificate with unique CID (PDF format)
- Mac OS X Debugging: Practical Foundations in PDF format (retail price $15)
- Free Dump Analysis World Network membership including updates to full PDF transcript Q&A section
Prerequisites: Basic Mac OS X troubleshooting and debugging
Audience: Software technical support and escalation engineers, system administrators, software developers and quality assurance engineers.
Session 1: October 19, 2012 4:00 PM - 6:00 PM BST
Session 2: October 22, 2012 4:00 PM - 6:00 PM BST
Price: 210 USD
Space is limited.
Reserve your remote training seat now at:
https://student.gototraining.com/r/3803636572165653760
If you are mainly interested in Windows memory dump analysis there is another course available:
Accelerated Windows Memory Dump Analysis
- Dmitry Vostokov @ DumpAnalysis.org + TraceAnalysis.org -
Posted in Announcements, Assembly Language, Crash Dump Analysis, Crash Dump Patterns, Debugging, Escalation Engineering, Mac Crash Corner, Mac OS X, Memory Dump Analysis Services, Software Engineering, Software Technical Support, Testing, Training and Seminars | No Comments »
Saturday, December 3rd, 2011
In addition to functions we also have module variables like nt!MmPagedPoolCommit in Windows 7:
0: kd> x nt!MmPagedPool*

fffff800`031148d0 nt!MmPagedPoolInfo = <no type information>

fffff800`03092d20 nt!MmPagedPoolCommit = <no type information>

fffff800`031141a0 nt!MmPagedPoolEnd = <no type information>

fffff800`031175c0 nt!MmPagedPoolWs = <no type information>
If we are not sure whether we have a function or Module Variable we can try to disassemble:
0: kd> u nt!MmPagedPoolCommit

nt!MmPagedPoolCommit:

fffff800`03092d20 e3b2            jrcxz   nt!MmTotalNonPagedPoolQuota+0x4 (fffff800`03092cd4)

fffff800`03092d22 0000            add     byte ptr [rax],al

fffff800`03092d24 0000            add     byte ptr [rax],al

fffff800`03092d26 0000            add     byte ptr [rax],al

fffff800`03092d28 0000            add     byte ptr [rax],al

fffff800`03092d2a 0000            add     byte ptr [rax],al

fffff800`03092d2c 0000            add     byte ptr [rax],al

fffff800`03092d2e 0000            add     byte ptr [rax],al
Here the value is probably in pages so we multiply by 4 to get Kb value and compare to the output of !vm command:
0: kd> dp nt!MmPagedPoolCommit

fffff800`03092d20  00000000`0000b2e3 00000000`00000000

fffff800`03092d30  00000000`00000000 00000000`00000000

fffff800`03092d40  00000000`00000001 00000000`00000000

fffff800`03092d50  00000000`00000000 00000000`00060107

fffff800`03092d60  fffff800`03092d60 fffff800`03092d60

fffff800`03092d70  00000000`00000000 00000000`0001e972

fffff800`03092d80  fffff900`c0000000 00000000`00000002

fffff800`03092d90  fffff880`071dc0a8 fffff880`057340a8
0: kd> ? b2e3 * 4

Evaluate expression: 183180 = 00000000`0002cb8c
0: kd> !vm
*** Virtual Memory Usage ***

 Physical Memory:     1035228 (   4140912 Kb)

 Page File: \??\C:\pagefile.sys

   Current:   4448112 Kb  Free Space:   4448108 Kb

   Minimum:   4448112 Kb  Maximum:     12422736 Kb

Unimplemented error for MiSystemVaTypeCount

 Available Pages:      594029 (   2376116 Kb)

 ResAvail Pages:       889795 (   3559180 Kb)

 Locked IO Pages:           0 (         0 Kb)

 Free System PTEs:   33556870 ( 134227480 Kb)

 Modified Pages:        20079 (     80316 Kb)

 Modified PF Pages:     19441 (     77764 Kb)

 NonPagedPool Usage: 50865104 ( 203460416 Kb)

 NonPagedPoolNx Usage:  28163 (    112652 Kb)

 NonPagedPool Max:     763396 (   3053584 Kb)

 ********** Excessive NonPaged Pool Usage *****

 PagedPool 0 Usage:     39420 (    157680 Kb)

 PagedPool 1 Usage:      5194 (     20776 Kb)

 PagedPool 2 Usage:       367 (      1468 Kb)

 PagedPool 3 Usage:       338 (      1352 Kb)

 PagedPool 4 Usage:       440 (      1760 Kb)

 PagedPool Usage:       45759 (    183036 Kb)

 PagedPool Maximum:  33554432 ( 134217728 Kb)

 Session Commit:         8112 (     32448 Kb)

 Shared Commit:         31802 (    127208 Kb)

 Special Pool:              0 (         0 Kb)

 Shared Process:        10765 (     43060 Kb)

 PagedPool Commit:      45795 (    183180 Kb)

 Driver Commit:         13773 (     55092 Kb)

 Committed pages:      540998 (   2163992 Kb)

 Commit limit:        2146794 (   8587176 Kb)

[…]
Knowledge of available module variables is useful because some of them are not included in WinDbg extension command output. For their list please consult Windows Internals book. Also useful variables can be found in other modules as well, for example, srv!srvcomputername:
0: kd> dS srv!srvcomputername

fffff8a0`0344b090  "MYNOTEBOOK"
- Dmitry Vostokov @ DumpAnalysis.org + TraceAnalysis.org -
Posted in Assembly Language, Crash Dump Analysis, Crash Dump Patterns, Debugging, Windows 7 | 1 Comment »
Thursday, October 13th, 2011
When disassembling JIT code it is good to see annotated function calls with full type and token information:
0:000> !CLRStack

OS Thread Id: 0xbf8 (0)

ESP       EIP

001fef90 003200a4 ClassMain.DoWork()

001fef94 00320082 ClassMain.Main(System.String[])

001ff1b0 79e7c74b [GCFrame: 001ff1b0]
0:000> !U 00320082

Normal JIT generated code

ClassMain.Main(System.String[])

Begin 00320070, size 13

00320070 b960300d00      mov     ecx,0D3060h (MT: ClassMain)

00320075 e8a21fdaff      call    000c201c (JitHelp: CORINFO_HELP_NEWSFAST)

0032007a 8bc8            mov     ecx,eax

0032007c ff159c300d00    call    dword ptr ds:[0D309Ch] (ClassMain.DoWork(), mdToken: 06000002)

>>> 00320082 c3              ret
However, this doesn’t work when we disable the output of raw bytes:
0:000> .asm no_code_bytes

Assembly options: no_code_bytes
0:000> !U 00320082

Normal JIT generated code

ClassMain.Main(System.String[])

Begin 00320070, size 13

00320070 mov     ecx,0D3060h

00320075 call    000c201c

0032007a mov     ecx,eax

0032007c call    dword ptr ds:[0D309Ch]

>>> 00320082 ret
Here we can still double check JIT-ed function calls manually:
0:000> dd 0D309Ch l1

000d309c  00320098
0:000> !IP2MD 00320098

MethodDesc: 000d3048

Method Name: ClassMain.DoWork()

Class: 000d1180

MethodTable: 000d3060

mdToken: 06000002

Module: 000d2c3c

IsJitted: yes

m_CodeOrIL: 00320098
- Dmitry Vostokov @ DumpAnalysis.org + TraceAnalysis.org -
Posted in .NET Debugging, Assembly Language, Crash Dump Analysis, Crash Dump Patterns, Debugging, Reverse Engineering | No Comments »
Monday, October 10th, 2011
In addition to inline function optimization of unmanaged and native code we can see similar approach to JIT-compiled code:
public class ClassMain

{

    public bool time2stop = false;
    public static void Main(string[] args)

    {

        new ClassMain().Main();

    }
    public void Main()

    {

        while (!time2stop)

        {

            DoWork();

        }

    }
volatile int inSensor, outSensor;
    void DoWork()

    {

        outSensor ^= inSensor;

    }

}
0:000> kL

ChildEBP RetAddr

WARNING: Frame IP not in any known module. Following frames may be wrong.

001fefa0 79e7c6cc 0×3200a4

001ff020 79e7c8e1 mscorwks!CallDescrWorkerWithHandler+0xa3

001ff160 79e7c783 mscorwks!MethodDesc::CallDescr+0×19c

001ff17c 79e7c90d mscorwks!MethodDesc::CallTargetWorker+0×1f

001ff190 79eefb9e mscorwks!MethodDescCallSite::Call_RetArgSlot+0×18

001ff2f4 79eef830 mscorwks!ClassLoader::RunMain+0×263

001ff55c 79ef01da mscorwks!Assembly::ExecuteMainMethod+0xa6

001ffa2c 79fb9793 mscorwks!SystemDomain::ExecuteMainMethod+0×43f

001ffa7c 79fb96df mscorwks!ExecuteEXE+0×59

001ffac4 736455ab mscorwks!_CorExeMain+0×15c

001ffad0 73747f16 mscoreei!_CorExeMain+0×38

001ffae0 73744de3 mscoree!ShellShim__CorExeMain+0×99

001ffae8 76573833 mscoree!_CorExeMain_Exported+0×8

001ffaf4 77c1a9bd kernel32!BaseThreadInitThunk+0xe

001ffb34 00000000 ntdll!_RtlUserThreadStart+0×23
0:000> r

eax=00000000 ebx=001fefbc ecx=015316e0 edx=0037a238 esi=0037a238 edi=00000000

eip=003200a4 esp=001fef90 ebp=001fefa0 iopl=0  nv up ei pl zr na pe nc

cs=001b  ss=0023  ds=0023  es=0023  fs=003b  gs=0000      efl=00000246

003200a4 80790c00   cmp     byte ptr [ecx+0Ch],0   ds:0023:015316ec=00
0:000> !IP2MD 003200a4

MethodDesc: 000d3048

Method Name: ClassMain.Main()

Class: 000d1180

MethodTable: 000d3060

mdToken: 06000002

Module: 000d2c3c

IsJitted: yes

m_CodeOrIL: 00320098
0:000> .asm no_code_bytes

Assembly options: no_code_bytes
0:000> !U 003200a4

Normal JIT generated code

ClassMain.Main()

Begin 00320098, size 13

00320098 cmp     byte ptr [ecx+0Ch],0

0032009c jne     003200aa

0032009e mov     eax,dword ptr [ecx+4]

003200a1 xor     dword ptr [ecx+8],eax

>>> 003200a4 cmp     byte ptr [ecx+0Ch],0

003200a8 je      0032009e

003200aa ret
We see that DoWork code was inlined into Main function code.
- Dmitry Vostokov @ DumpAnalysis.org + TraceAnalysis.org -
Posted in .NET Debugging, Assembly Language, Crash Dump Analysis, Crash Dump Patterns, Debugging | No Comments »
Monday, October 10th, 2011
I noticed this pattern when analyzing the output of !DumpStack WinDbg SOS extension command:
0:011> !DumpStack

OS Thread Id: 0xac (11)

[...]

ChildEBP RetAddr  Caller, Callee

[…]

0b73f65c 77c416dc ntdll!RtlAllocateHeap+0×17c, calling ntdll!RtlpLowFragHeapAllocFromContext

0b73f688 77c486cd ntdll!RtlAllocateHeap+0×193, calling ntdll!memset

0b73f6b0 7653a467 kernel32!TlsSetValue+0×4c, calling ntdll!RtlAllocateHeap

0b73f6cc 77a01c48 urlmon!CUrlMkTls::TLSAllocData+0×3f, calling kernel32!TlsSetValue

0b73f6dc 77a0198d urlmon!CUrlMkTls::CUrlMkTls+0×29, calling urlmon!CUrlMkTls::TLSAllocData

0b73f6e8 77a01be5 urlmon!TlsDllMain+0×100, calling urlmon!EnsureFeatureCache

0b73f6f4 6d016a21 mshtml!DllMain+0×10, calling kernel32!GetCurrentThreadId

0b73f704 6d016b6c mshtml!_CRT_INIT+0×281, calling mshtml!DllMain

0b73f71c 7239133e msimtf!_CRT_INIT+0×281, calling msimtf!DllMain

0b73f728 72391375 msimtf!_CRT_INIT+0×3e7, calling msimtf!_SEH_epilog4

0b73f764 6d016ad0 mshtml!_DllMainStartup+0×56, calling mshtml!_DllMainCRTStartup

0b73f778 72391375 msimtf!_CRT_INIT+0×3e7, calling msimtf!_SEH_epilog4

0b73f77c 77c4a604 ntdll!LdrpCallInitRoutine+0×14

0b73f7a4 77c1ab6c ntdll!LdrpInitializeThread+0×1e9, calling ntdll!RtlLeaveCriticalSection

0b73f7ac 77c1a9ea ntdll!LdrpInitializeThread+0×1cd, calling ntdll!_SEH_epilog4

0b73f800 77c1ab15 ntdll!LdrpInitializeThread+0×11f, calling ntdll!RtlActivateActivationContextUnsafeFast

0b73f804 77c1ab53 ntdll!LdrpInitializeThread+0×167, calling ntdll!RtlDeactivateActivationContextUnsafeFast

0b73f838 77c1a9ea ntdll!LdrpInitializeThread+0×1cd, calling ntdll!_SEH_epilog4

0b73f83c 77c405a0 ntdll!NtTestAlert+0xc

0b73f840 77c1a968 ntdll!_LdrpInitialize+0×29c, calling ntdll!_SEH_epilog4

0b73f8a0 77c3f3d0 ntdll!NtContinue+0xc

0b73f8a4 77c1a98a ntdll!LdrInitializeThunk+0×1a, calling ntdll!NtContinue

0b73fb30 6afd59f6 clr!Thread::intermediateThreadProc+0×39, calling clr!_alloca_probe_16

0b73fb44 76573833 kernel32!BaseThreadInitThunk+0xe

0b73fb50 77c1a9bd ntdll!_RtlUserThreadStart+0×23
Obviously the command collected “call-type” execution residue from the raw stack. The “calling” part wasn’t found in the nearby region:
0:011> dps 0b73f7a4-20 0b73f7a4+20

0b73f784  72390000 msimtf!_imp__RegOpenKeyW <PERF> (msimtf+0×0)

0b73f788  00000002

0b73f78c  00000000

0b73f790  00000001

0b73f794  0b73f80c

0b73f798  0b73f80c

0b73f79c  00000001

0b73f7a0  05636578

0b73f7a4  0b73f83c

0b73f7a8  77c1ab6c ntdll!LdrpInitializeThread+0×1e9

0b73f7ac  77ca5340 ntdll!LdrpLoaderLock

0b73f7b0  77c1a9ea ntdll!LdrpInitializeThread+0×1cd

0b73f7b4  0b7321f2

0b73f7b8  7ff4e000

0b73f7bc  7ffdf000

0b73f7c0  77ca51f4 ntdll!LdrpProcessInitialized

0b73f7c4  00000000
I tried to disassemble backwards the addresses and found the callees:
0:011> ub 77c1ab6c

ntdll!LdrpInitializeThread+0×16b:

77c1ab57 90              nop

77c1ab58 90              nop

77c1ab59 90              nop

77c1ab5a 90              nop

77c1ab5b 90              nop

77c1ab5c ff054452ca77    inc     dword ptr [ntdll!LdrpActiveThreadCount (77ca5244)]

77c1ab62 684053ca77      push    offset ntdll!LdrpLoaderLock (77ca5340)

77c1ab67 e8bd820000      call    ntdll!RtlLeaveCriticalSection (77c22e29)
0:011> ub 77a01be5

urlmon!TlsDllMain+0×2f:

77a01bce 8d4510          lea     eax,[ebp+10h]

77a01bd1 50              push    eax

77a01bd2 8d4d0c          lea     ecx,[ebp+0Ch]

77a01bd5 e88efdffff      call    urlmon!CUrlMkTls::CUrlMkTls (77a01968)

77a01bda 397d10          cmp     dword ptr [ebp+10h],edi

77a01bdd 7c09            jl      urlmon!TlsDllMain+0×103 (77a01be8)

77a01bdf 56              push    esi

77a01be0 e887fcffff      call    urlmon!EnsureFeatureCache (77a0186c)
In the past I was frequently referencing this pattern especially when discussing coincidental symbolic information but didn’t name it. Now it’s time to do that: Caller-n-Callee.
We can also run !DumpStack command against every thread (including nonmanaged) to get the summary of the call-type execution residue:
0:011> ~4s

eax=76573821 ebx=00000002 ecx=00000000 edx=74d01909 esi=00000000 edi=00000000

eip=77c40f34 esp=0478f8a0 ebp=0478f93c iopl=0 nv up ei pl zr na pe nc

cs=001b ss=0023 ds=0023 es=0023 fs=003b gs=0000 efl=00000246

ntdll!KiFastSystemCallRet:

77c40f34 c3 ret
0:004> k

ChildEBP RetAddr

0478f89c 77c40690 ntdll!KiFastSystemCallRet

0478f8a0 76577e09 ntdll!ZwWaitForMultipleObjects+0xc

0478f93c 7674c4af kernel32!WaitForMultipleObjectsEx+0x11d

0478f990 76748b7b user32!RealMsgWaitForMultipleObjectsEx+0x13c

0478f9ac 74d01965 user32!MsgWaitForMultipleObjects+0x1f

0478f9f8 76573833 GdiPlus!BackgroundThreadProc+0x59

0478fa04 77c1a9bd kernel32!BaseThreadInitThunk+0xe

0478fa44 00000000 ntdll!_RtlUserThreadStart+0x23
0:004> !DumpStack

OS Thread Id: 0x950 (4)

Current frame: ntdll!KiFastSystemCallRet

ChildEBP RetAddr  Caller, Callee

0478f89c 77c40690 ntdll!ZwWaitForMultipleObjects+0xc

0478f8a0 76577e09 kernel32!WaitForMultipleObjectsEx+0x11d, calling ntdll!NtWaitForMultipleObjects

0478f914 76751a91 user32!UserCallWinProcCheckWow+0x5c, calling ntdll!RtlActivateActivationContextUnsafeFast

0478f918 76751b41 user32!UserCallWinProcCheckWow+0x16a, calling ntdll!RtlDeactivateActivationContextUnsafeFast

0478f93c 7674c4af user32!RealMsgWaitForMultipleObjectsEx+0x13c, calling kernel32!WaitForMultipleObjectsEx

0478f968 76752a65 user32!DispatchMessageWorker+0x396, calling user32!_SEH_epilog4

0478f980 76743c64 user32!PeekMessageA+0x129, calling user32!_PeekMessage

0478f990 76748b7b user32!MsgWaitForMultipleObjects+0x1f, calling user32!MsgWaitForMultipleObjectsEx

0478f9ac 74d01965 GdiPlus!BackgroundThreadProc+0x59, calling user32!MsgWaitForMultipleObjects

0478f9f8 76573833 kernel32!BaseThreadInitThunk+0xe

0478fa04 77c1a9bd ntdll!_RtlUserThreadStart+0x23
- Dmitry Vostokov @ DumpAnalysis.org + TraceAnalysis.org -
Posted in .NET Debugging, Assembly Language, Crash Dump Analysis, Crash Dump Patterns, Debugging, Reverse Engineering, WinDbg Tips and Tricks | 2 Comments »
Sunday, April 17th, 2011
I’m pleased to announce that MDAA, Volume 5 is available in PDF format:
www.dumpanalysis.org/Memory+Dump+Analysis+Anthology+Volume+5
It features:
- 25 new crash dump analysis patterns
- 11 new pattern interaction case studies (including software tracing)
- 16 new trace analysis patterns
- 7 structural memory patterns
- 4 modeling case studies for memory dump analysis patterns
- Discussion of 3 common analysis mistakes
- Malware analysis case study
- Computer independent architecture of crash analysis report service
- Expanded coverage of software narratology
- Metaphysical and theological implications of memory dump worldview
- More pictures of memory space and physicalist art
- Classification of memory visualization tools
- Memory visualization case studies
- Close reading of the stories of Sherlock Holmes: Dr. Watson’s observational patterns
- Fully cross-referenced with Volume 1, Volume 2, Volume 3, and Volume 4
Its table of contents is available here:
www.dumpanalysis.org/MDAA/MDA-Anthology-V5-TOC.pdf
Paperback and hardcover versions should be available in a week or two. I also started working on Volume 6 that should be available in November-December.
- Dmitry Vostokov @ DumpAnalysis.org + TraceAnalysis.org -
Posted in Aesthetics of Memory Dumps, Analysis Notation, Announcements, AntiPatterns, Archaeology of Computer Memory, Art, Assembly Language, Best Practices, Books, C and C++, CDF Analysis Tips and Tricks, Categorical Debugging, Citrix, Common Mistakes, Common Questions, Complete Memory Dump Analysis, Computer Forensics, Computer Science, Crash Analysis Report Environment (CARE), Crash Dump Analysis, Crash Dump De-analysis, Crash Dump Patterns, Crash Dumps for Dummies, Cyber Warfare, Debugging, Debugging Bureau, Debugging Industry, Debugging Methodology, Debugging Slang, Debugging Trends, Deep Down C++, Dr. Watson, Dublin School of Security, Education and Research, Escalation Engineering, Fun with Crash Dumps, Fun with Debugging, Fun with Software Traces, General Memory Analysis, Hermeneutics of Memory Dumps and Traces, Images of Computer Memory, Kernel Development, Malware Analysis, Mathematics of Debugging, Memiotics (Memory Semiotics), Memory Analysis Forensics and Intelligence, Memory Diagrams, Memory Dump Analysis Services, Memory Dumps in Myths, Memory Space Art, Memory Systems Language, Memory Visualization, Memory and Glitches, Metaphysics of Memory Worldview, Multithreading, Music for Debugging, New Acronyms, New Debugging School, New Words, Pattern Models, Philosophy, Physicalist Art, Publishing, Reverse Engineering, Science of Memory Dump Analysis, Science of Software Tracing, Security, Software Architecture, Software Behavior Patterns, Software Chorography, Software Chorology, Software Defect Construction, Software Engineering, Software Generalist, Software Maintenance Institute, Software Narratology, Software Technical Support, Software Trace Analysis, Software Trace Reading, Software Trace Visualization, Software Tracing for Dummies, Software Troubleshooting Patterns, Software Victimology, Structural Memory Patterns, Structural Trace Patterns, Systems Thinking, Testing, The Way of Philip Marlowe, Tools, Trace Analysis Patterns, Training and Seminars, Troubleshooting Methodology, Victimware, Vista, Webinars, WinDbg Scripting Extensions, WinDbg Scripts, WinDbg Tips and Tricks, WinDbg for GDB Users, Windows 7, Windows Server 2008, Windows System Administration, Workaround Patterns, x64 Windows | No Comments »
Tuesday, April 5th, 2011
Finally, after the numerous delays, the first Windows Debugging Notebook is almost ready for publication by the end of this month with a new cover and a foreword written by Mario Hewardt, the author of Advanced Windows Debugging and Advanced .NET Debugging books:
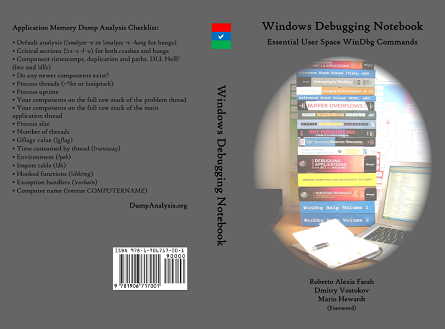
It is the first notebook because we have decided to split it into 3 different memory space volumes and one additional overview volume for concepts and tools:
- Windows Debugging Notebook: Essential User Space WinDbg Commands (ISBN: 978-1906717001 and 978-0955832857)
- Windows Debugging Notebook: Essential Kernel Space WinDbg Commands (ISBN: 978-1908043146)
- Windows Debugging Notebook: Essential Managed Space WinDbg .NET Commands (ISBN: 978-1908043153)
- Windows Debugging Notebook: Essential Concepts and Tools (ISBN: 978-1908043160)
On a bookshelf you would be able to distinguish between the first 3 volumes by a 3 color spine stripe with an appropriate check on it: red for kernel, blue for user, and green for managed space.
The Table of Contents has been changed too.
- Dmitry Vostokov @ DumpAnalysis.org + TraceAnalysis.org -
Posted in Announcements, Assembly Language, Books, Crash Dump Analysis, Debugging, Escalation Engineering, Publishing, Reverse Engineering, Security, Software Engineering, Software Technical Support, WinDbg Scripts, WinDbg Tips and Tricks | 2 Comments »
Monday, February 21st, 2011
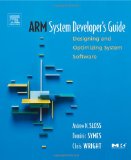
With Windows moving to ARM platforms I’m learning ARM assembly language and system programming. Being mostly exposed to PDP-11, VAX-11 and Intel architectures my interest in ARM systems began with porting my old project to Windows Mobile and writing a tool called WindowHistory Mobile to assist me in debugging. I remember how I was surprised when WinDbg was able to open a crash dump and show ARM code! Then I put it aside. Now with Windows Mobile 7 and Windows 8 approaching with its support of ARM I decided to resume my ARM studies and highly recommend this book:
ARM System Developer’s Guide: Designing and Optimizing System Software
My renewed interest in assembly language also coincides with joining Linkedin Assembly language coders group.
I also plan to create a separate version of my popular Windows Debugging: Practical Foundations book with ARM examples and an ARM section on Asmpedia. If time and resources permit, of course.
- Dmitry Vostokov @ DumpAnalysis.org + TraceAnalysis.org -
Posted in Assembly Language, Books, Debugging, Windows 8, Windows Mobile | No Comments »
Monday, December 27th, 2010
… the functions you meet on the way up, … you’re going to meet the same functions on the way down. Not always…
Jackie Gleason
- Dmitry Vostokov @ DumpAnalysis.org + TraceAnalysis.org -
Posted in Assembly Language, Bugtations, Crash Dump Analysis, Debugging | No Comments »
Friday, November 12th, 2010
Five volumes of cross-disciplinary Anthology (dubbed by the author “The Summa Memorianica”) lay the foundation of the scientific discipline of Memoretics (study of computer memory snapshots and their evolution in time) that is also called Memory Dump and Software Trace Analysis.ca
The 5th volume contains revised, edited, cross-referenced, and thematically organized selected DumpAnalysis.org blog posts about crash dump, software trace analysis and debugging written in February 2010 - October 2010 for software engineers developing and maintaining products on Windows platforms, quality assurance engineers testing software on Windows platforms, technical support and escalation engineers dealing with complex software issues, and security researchers, malware analysts and reverse engineers. The fifth volume features:
- 25 new crash dump analysis patterns
- 11 new pattern interaction case studies (including software tracing)
- 16 new trace analysis patterns
- 7 structural memory patterns
- 4 modeling case studies for memory dump analysis patterns
- Discussion of 3 common analysis mistakes
- Malware analysis case study
- Computer independent architecture of crash analysis report service
- Expanded coverage of software narratology
- Metaphysical and theological implications of memory dump worldview
- More pictures of memory space and physicalist art
- Classification of memory visualization tools
- Memory visualization case studies
- Close reading of the stories of Sherlock Holmes: Dr. Watson’s observational patterns
- Fully cross-referenced with Volume 1, Volume 2, Volume 3, and Volume 4
Product information:
- Title: Memory Dump Analysis Anthology, Volume 5
- Author: Dmitry Vostokov
- Language: English
- Product Dimensions: 22.86 x 15.24
- Paperback: 400 pages
- Publisher: Opentask (10 December 2010)
- ISBN-13: 978-1-906717-96-4
- Hardcover: 400 pages
- Publisher: Opentask (10 December 2010)
- ISBN-13: 978-1-906717-97-1

Back cover features memory space art image Hot Computation: Memory on Fire.
- Dmitry Vostokov @ DumpAnalysis.org + TraceAnalysis.org -
Posted in Aesthetics of Memory Dumps, Announcements, Archaeology of Computer Memory, Art, Assembly Language, Books, C and C++, CDF Analysis Tips and Tricks, Categorical Debugging, Common Mistakes, Complete Memory Dump Analysis, Computer Science, Crash Analysis Report Environment (CARE), Crash Dump Analysis, Crash Dump De-analysis, Crash Dump Patterns, Debugging, Debugging Methodology, Debugging Slang, Deep Down C++, Dr. Watson, Dublin School of Security, Education and Research, Escalation Engineering, Fun with Crash Dumps, Fun with Debugging, Fun with Software Traces, General Memory Analysis, Hermeneutics of Memory Dumps and Traces, Images of Computer Memory, Kernel Development, Malware Analysis, Malware Patterns, Mathematics of Debugging, Memiotics (Memory Semiotics), Memoidealism, Memoretics, Memory Analysis Culture, Memory Analysis Forensics and Intelligence, Memory Analysis Report System, Memory Diagrams, Memory Dreams, Memory Dump Analysis Jobs, Memory Dump Analysis Services, Memory Dump Analysis and History, Memory Dumps in Movies, Memory Dumps in Myths, Memory Religion (Memorianity), Memory Space Art, Memory Systems Language, Memory Visualization, Memory and Glitches, Memuonics, Metaphysical Society of Ireland, Minidump Analysis, Movies and Debugging, Multithreading, Museum of Debugging, Music for Debugging, Music of Computation, New Acronyms, New Words, Paleo-debugging, Pattern Models, Pattern Prediction, Philosophy, Physicalist Art, Psychoanalysis of Software Maintenance and Support, Publishing, Science of Memory Dump Analysis, Science of Software Tracing, Security, Software Architecture, Software Behavior Patterns, Software Chorography, Software Chorology, Software Defect Construction, Software Engineering, Software Generalist, Software Maintenance Institute, Software Narratology, Software Technical Support, Software Trace Analysis, Software Trace Analysis and History, Software Trace Deconstruction, Software Trace Reading, Software Trace Visualization, Software Tracing for Dummies, Software Troubleshooting Patterns, Software Victimology, Stack Trace Collection, Structural Memory Analysis and Social Sciences, Structural Memory Patterns, Structural Trace Patterns, Systems Thinking, Testing, Theology, Tool Objects, Tools, Trace Analysis Patterns, Training and Seminars, Troubleshooting Methodology, Uses of UML, Victimware, Virtualization, Vista, Visual Dump Analysis, Webinars, WinDbg Scripts, WinDbg Tips and Tricks, WinDbg for GDB Users, Windows 7, Windows Server 2008, Windows System Administration, Workaround Patterns, x64 Windows | No Comments »
Wednesday, November 10th, 2010
Just came up with this one for a starter:
Q. Why is the execution of this program so stable? A. Because there is a breakpoint at every instruction.
For those from countries in the past socialist camp like Soviet Union it might appear bugtated from a joke I heard from one Moscow State University mathematics professor when I was a student:
“Q. Why is the Communist Party course always straight? A. Because there is an inflection at every point.”
- Dmitry Vostokov @ DumpAnalysis.org + TraceAnalysis.org -
Posted in Assembly Language, Bugtations, Crash Dump Analysis, Debugging, Debugging Jokes, Fun with Crash Dumps, Fun with Debugging | No Comments »
Saturday, November 6th, 2010
I’m pleased to announce that MDAA, Volume 4 is available in PDF format:
www.dumpanalysis.org/Memory+Dump+Analysis+Anthology+Volume+4
It features:
- 15 new crash dump analysis patterns
- 13 new pattern interaction case studies
- 10 new trace analysis patterns
- 6 new Debugware patterns and case study
- Workaround patterns
- Updated checklist
- Fully cross-referenced with Volume 1, Volume 2 and Volume 3
- Memory visualization tutorials
- Memory space art
Its table of contents is available here:
http://www.dumpanalysis.org/MDAA/MDA-Anthology-V4-TOC.pdf
Paperback and hardcover versions should be available in a week or two. I also started working on Volume 5 that should be available in December.
- Dmitry Vostokov @ DumpAnalysis.org + TraceAnalysis.org -
Posted in .NET Debugging, Aesthetics of Memory Dumps, Announcements, AntiPatterns, Art, Assembly Language, Books, C and C++, CDF Analysis Tips and Tricks, Categorical Debugging, Common Mistakes, Complete Memory Dump Analysis, Computer Science, Countefactual Debugging, Crash Dump Analysis, Crash Dump Patterns, DebugWare Patterns, Debugging, Debugging Slang, Deep Down C++, Education and Research, Escalation Engineering, Fun with Crash Dumps, Fun with Debugging, Images of Computer Memory, Kernel Development, Memiotics (Memory Semiotics), Memoidealism, Memoretics, Memory Space Art, Memory Visualization, Memuonics, Metaphysics of Memory Worldview, Multithreading, Opcodism, Philosophy, Physicalist Art, Publishing, Science Fiction, Science of Memory Dump Analysis, Science of Software Tracing, Security, Software Architecture, Software Behavior Patterns, Software Defect Construction, Software Engineering, Software Narratology, Software Technical Support, Software Trace Analysis, Software Trace Reading, Software Victimology, Stack Trace Collection, Testing, Tools, Trace Analysis Patterns, Troubleshooting Methodology, Uses of UML, Victimware, Virtualization, Vista, Visual Dump Analysis, WinDbg Scripts, WinDbg Tips and Tricks, Windows 7, Windows Server 2008, Windows System Administration, Workaround Patterns, x64 Windows | No Comments »
Friday, October 22nd, 2010
I detour for MARS expedition. You may also call it Memory Analysis Report System as malware analysis is always exploration of memory (in general). Why is this sudden change of course? After reading Gilles Deleuze I want to broaden the concept of “malware” and give it new orientation and direction of thinking. Beside that I also want new challenges after many years of research in pattern-driven memory dump and software trace analysis of abnormal software behaviour.
You may have also noticed small restructuring (rebranding) of this blog and DumpAnalysis.org headers.
See you there 
- Dmitry Vostokov @ DumpAnalysis.org + TraceAnalysis.org -
Posted in Announcements, Archaeology of Computer Memory, Assembly Language, Computer Science, Education and Research, General Memory Analysis, Malware Analysis, Malware Patterns, Memiotics (Memory Semiotics), Memoretics, Memory Analysis Forensics and Intelligence, Memory Analysis Report System, Memory Dump Analysis Services, New Acronyms, Philosophy, Science of Memory Dump Analysis, Science of Software Tracing, Security, Software Trace Analysis, Software Victimology, Structural Memory Patterns, Systems Thinking, Tools, Trace Analysis Patterns, Victimware, Windows System Administration | No Comments »
Friday, September 3rd, 2010
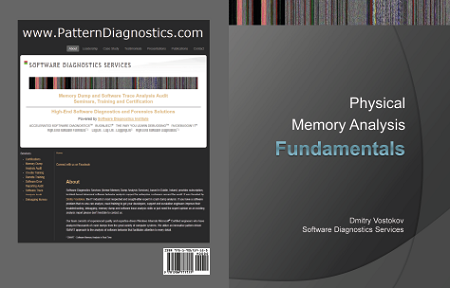
This forthcoming full color book is the complete transcript of a Webinar organized by Memory Dump Analysis Services (www.DumpAnalysis.com).
It discusses user vs. kernel vs. physical (complete) memory space, challenges of complete memory dump analysis, common WinDbg commands, patterns and pattern-driven analysis methodology, common mistakes, fiber bundles, DumpAnalysis.org case studies and illustrates step by step a hands-on exercise in a complete memory dump analysis.
- Title: Fundamentals of Complete Crash and Hang Memory Dump Analysis
- Author: Dmitry Vostokov
- Publisher: OpenTask (October 2010)
- Language: English
- Product Dimensions: 28.0 x 21.6
- Paperback: 48 pages
- ISBN-13: 978-1906717155
- Dmitry Vostokov @ DumpAnalysis.org + TraceAnalysis.org -
Posted in Announcements, Assembly Language, Books, Common Mistakes, Complete Memory Dump Analysis, Crash Analysis Report Environment (CARE), Crash Dump Analysis, Crash Dump Patterns, Debugging, Escalation Engineering, Software Technical Support, Stack Trace Collection, Tools, Training and Seminars, Webinars, WinDbg Tips and Tricks, Windows 7, Windows Server 2008, x64 Windows | No Comments »
Sunday, May 16th, 2010
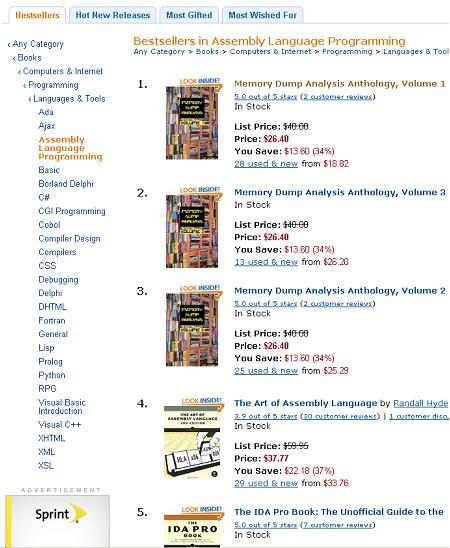
Just noticed a rare event when all three volumes of Memory Dump Analysis Anthology occupy the first 3 positions on Bestsellers in Assembly Language Programming Amazon list (observed at the time of this writing):
- Dmitry Vostokov @ DumpAnalysis.org + TraceAnalysis.org -
Posted in Announcements, Assembly Language, Books, Crash Dump Analysis, Debugging, Publishing | No Comments »
Sunday, April 18th, 2010
OpenTask to offer first 3 volumes of Memory Dump Analysis Anthology in one set:


The set is available exclusively from OpenTask e-Commerce web site starting from June. Individual volumes are also available from Amazon, Barnes & Noble and other bookstores worldwide.
Product information:
- Title: Modern Memory Dump and Software Trace Analysis: Volumes 1-3
- Author: Dmitry Vostokov
- Language: English
- Product Dimensions: 22.86 x 15.24
- Paperback: 1600 pages
- Publisher: Opentask (31 May 2010)
- ISBN-13: 978-1-906717-99-5
Information about individual volumes:
- Dmitry Vostokov @ DumpAnalysis.org + TraceAnalysis.org -
Posted in .NET Debugging, Aesthetics of Memory Dumps, Announcements, AntiPatterns, Art, Assembly Language, Books, Bugchecks Depicted, C and C++, CDA Pattern Classification, CDF Analysis Tips and Tricks, Categorical Debugging, Certification, Citrix, Code Reading, Common Mistakes, Computational Ghosts and Bug Hauntings, Computer Science, Countefactual Debugging, Crash Analysis Report Environment (CARE), Crash Dump Analysis, Crash Dump Patterns, Crash Dumps for Dummies, Data Recovery, DebugWare Patterns, Debugging, Debugging Methodology, Debugging Slang, Deep Down C++, Dictionary of Debugging, Dr. Watson, Education and Research, Escalation Engineering, Fun with Crash Dumps, Futuristic Memory Dump Analysis, GDB for WinDbg Users, Hardware, History, Horrors of Computation, Hyper-V, Intelligent Memory Movement, Kernel Development, Laws of Troubleshooting and Debugging, Mathematics of Debugging, Memiotics (Memory Semiotics), Memoidealism, Memoretics, Memory Analysis Culture, Memory Analysis Forensics and Intelligence, Memory Auralization, Memory Dump Analysis Jobs, Memory Religion (Memorianity), Memory Space Art, Memory Space Music, Memory Systems Language, Memory Visualization, Memuonics, Minidump Analysis, Multithreading, Music for Debugging, Music of Computation, New Acronyms, New Words, Occult Debugging, Philosophy, Psi-computation, Publishing, Science of Memory Dump Analysis, Science of Software Tracing, Security, Software Architecture, Software Defect Construction, Software Engineering, Software Generalist, Software Maintenance Institute, Software Narratology, Software Technical Support, Software Trace Analysis, Software Trace Visualization, Software Tracing for Dummies, Software Victimology, Stack Trace Collection, Testing, Tools, Trace Analysis Patterns, Training and Seminars, Troubleshooting Methodology, Victimware, Virtualization, Vista, Visual Dump Analysis, WinDbg Scripts, WinDbg Tips and Tricks, WinDbg for GDB Users, Windows 7, Windows Server 2008, Windows System Administration | No Comments »
Friday, April 9th, 2010
Plan to start providing training and seminars in my free time. If you are interested please answer these questions (you can either respond here in comments or use this form for private communication http://www.dumpanalysis.org/contact):
- Are you interested in on-site training, prefer traveling or attending webinars?
- Are you interested in software trace analysis as well?
- What specific topics are you interested in?
- What training level (beginner, intermediate, advanced) are you interested in? (please provide an example, if possible)
Additional topics of expertise that can be integrated into training include Source Code Reading and Analysis, Debugging, Windows Architecture, Device Drivers, Troubleshooting Tools Design and Implementation, Multithreading, Deep Down C and C++, x86 and x64 Assembly Language Reading.
Looking forward to your responses. Any suggestions are welcome.
- Dmitry Vostokov @ DumpAnalysis.org + TraceAnalysis.org -
Posted in .NET Debugging, Announcements, AntiPatterns, Assembly Language, Bugchecks Depicted, C and C++, CDA Pattern Classification, CDF Analysis Tips and Tricks, Certification, Code Reading, Common Mistakes, Crash Analysis Report Environment (CARE), Crash Dump Analysis, Crash Dump Patterns, Crash Dumps for Dummies, Data Recovery, DebugWare Patterns, Debugging, Debugging Methodology, Deep Down C++, Education and Research, Escalation Engineering, FreeBSD Crash Corner, GDB for WinDbg Users, Hardware, Hyper-V, Java Debugging, Kernel Development, Laws of Troubleshooting and Debugging, Linux Crash Corner, Mac Crash Corner, Memory Analysis Forensics and Intelligence, Memory Visualization, Minidump Analysis, Multithreading, Security, Software Architecture, Software Defect Construction, Software Engineering, Software Generalist, Software Maintenance Institute, Software Narratology, Software Technical Support, Software Trace Analysis, Software Trace Visualization, Software Tracing for Dummies, Software Victimology, Stack Trace Collection, Testing, Tools, Trace Analysis Patterns, Training and Seminars, Troubleshooting Methodology, Victimware, Virtualization, Vista, Visual Dump Analysis, WinDbg Scripts, WinDbg Tips and Tricks, WinDbg for GDB Users, Windows 7, Windows Server 2008, Windows System Administration, Workaround Patterns | No Comments »