The Korean Edition of Memory Dump Analysis Anthology, Volume 1
Monday, April 5th, 2010I’m very pleased to announce that the Korean edition is available:

The book can be found on:
- Dmitry Vostokov @ DumpAnalysis.org + TraceAnalysis.org -
I’m very pleased to announce that the Korean edition is available:
The book can be found on:
- Dmitry Vostokov @ DumpAnalysis.org + TraceAnalysis.org -
This is a revised, edited, cross-referenced and thematically organized volume of selected DumpAnalysis.org blog posts about crash dump analysis and debugging written in July 2009 - January 2010 for software engineers developing and maintaining products on Windows platforms, quality assurance engineers testing software on Windows platforms and technical support and escalation engineers dealing with complex software issues. The fourth volume features:
- 13 new crash dump analysis patterns
- 13 new pattern interaction case studies
- 10 new trace analysis patterns
- 6 new Debugware patterns and case study
- Workaround patterns
- Updated checklist
- Fully cross-referenced with Volume 1, Volume 2 and Volume 3
- New appendixes
Product information:

Back cover features memory space art image: Internal Process Combustion.
- Dmitry Vostokov @ DumpAnalysis.org + TraceAnalysis.org -
Another common mistake I observe is relying on what debuggers report without double-checking. Present day debuggers, like WinDbg or GDB, are symbol-driven, they do not possess much of that semantic knowledge that a human debugger has. Also, it is better to report more than less: what is irrelevant can be skipped over by a skilled memory analyst but what looks suspicious to the problem at hand shall be double-checked to see if it is not coincidental. One example we consider here is Coincidental Symbolic Information.
An application is frequently crashing. The process memory dump file shows only one thread left inside without any exception handling frames. In order to hypothesize about the probable cause the thread raw stack data is analyzed. It shows a few C++ STL calls with a custom smart pointer class and memory allocator like this:
app!std::vector<SmartPtr<ClassA>, std::allocator<SmartPtr<ClassA> > >::operator[]+
WinDbg !analyze-v command output points to this code:
FOLLOWUP_IP:

app!std::bad_alloc::~bad_alloc <PERF> (app+0x0)+0

00400000 4d  dec     ebp
Raw stack data contains a few symbolic references to bad_alloc destructor too:
[...]

0012f9c0  00000100

0012f9c4  00400100 app!std::bad_alloc::~bad_alloc <PERF> (app+0x100)

0012f9c8  00000000

0012f9cc  0012f9b4

0012f9d0  00484488 app!_NULL_IMPORT_DESCRIPTOR+0x1984

0012f9d4  0012fa8c

0012f9d8  7c828290 ntdll!_except_handler3

0012f9dc  0012fa3c

0012f9e0  7c82b04a ntdll!RtlImageNtHeaderEx+0xee

0012f9e4  00482f08 app!_NULL_IMPORT_DESCRIPTOR+0x404

0012f9e8  00151ed0

0012f9ec  00484c1e app!_NULL_IMPORT_DESCRIPTOR+0x211a

0012f9f0  00000100

0012f9f4  00400100 app!std::bad_alloc::~bad_alloc <PERF> (app+0x100)

[...]
By linking all these three pieces together an engineer hypothesized that the cause of failure is memory allocation. However, careful analysis reveals all of them as a coincidental symbolic information and renders hypothesis much less plausible:
1. The address of app!std::bad_alloc::~bad_alloc is 00400000 which coincides with the start of the main application module:
0:000> lm a 00400000

start    end        module name

00400000 004c4000   app    (no symbols)
As a consequence, its assembly language code makes no sense:
0:000> u 00400000

app:

00400000 4d              dec     ebp

00400001 5a              pop     edx

00400002 90              nop

00400003 0003            add     byte ptr [ebx],al

00400005 0000            add     byte ptr [eax],al

00400007 000400          add     byte ptr [eax+eax],al

0040000a 0000            add     byte ptr [eax],al

0040000c ff              ???
2. All std::vector references are in fact fragments of a UNICODE string that can be dumped using du command:
[...]

0012ef14  00430056 app!std::vector<SmartPtr<ClassA>, std::allocator<SmartPtr<ClassA> > >::operator[]+0x16

0012ef18  00300038

0012ef1c  0043002e app!std::vector<SmartPtr<ClassA>, std::allocator<SmartPtr<ClassA> > >::size+0x1

[...]
0:000> du 0012ef14 l6

0012ef14  "VC80.C"
3. Raw stack data references to bad_alloc destructor are still module addresses in disguise, 00400100 or app+0×100, with nonsense assembly code:
0:000> u 00400100

app+0x100:

00400100 50              push    eax

00400101 45              inc     ebp

00400102 0000            add     byte ptr [eax],al

00400104 4c              dec     esp

00400105 010500571aac    add     dword ptr ds:[0AC1A5700h],eax

0040010b 4a              dec     edx

0040010c 0000            add     byte ptr [eax],al

0040010e 0000            add     byte ptr [eax],al
- Dmitry Vostokov @ DumpAnalysis.org + TraceAnalysis.org -
Just noticed that Amazon introduced additional daily updated tabs for book categories. MDAA volumes are in top 10 ”Most Gifted” and “Most Wished For” Debugging and Assembly Language titles (today). Volume 3 is featured as a Hot New Release:

I assume ”Most Gifted” is about “gift wrapping” when you order a book ![]()
- Dmitry Vostokov @ DumpAnalysis.org -
See the greeting card on the portal together with New Year’s Eve code analysis puzzle:
DumpAnalysis.org Wishes Happy New Year 7DA!
- Dmitry Vostokov @ DumpAnalysis.org -
“Memory dumps are facts.”
I’m very excited to announce that Volume 3 is available in paperback, hardcover and digital editions:
Memory Dump Analysis Anthology, Volume 3
In two weeks paperback edition should also appear on Amazon and other bookstores. Amazon hardcover edition is planned to be available in January 2010.
The amount of information was so voluminous that I had to split the originally planned volume into two. Volume 4 should appear by the middle of February together with Color Supplement for Volumes 1-4.
- Dmitry Vostokov @ DumpAnalysis.org -
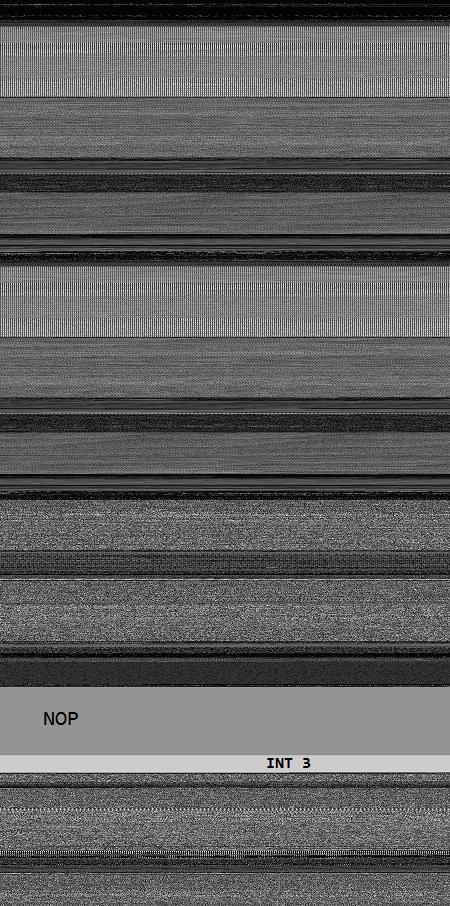
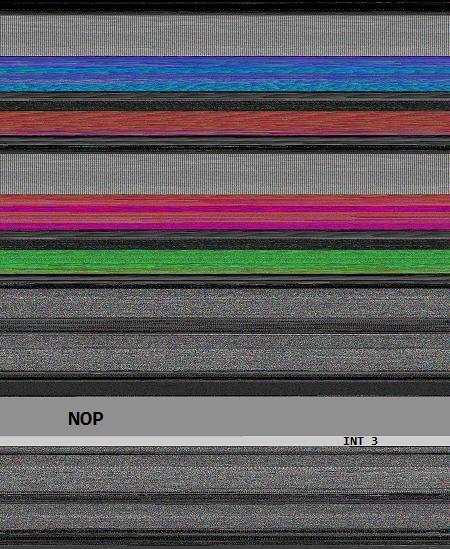
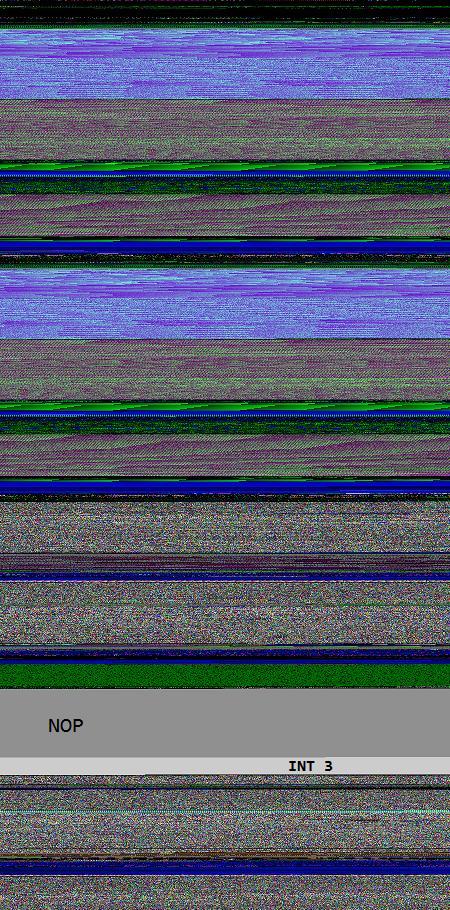
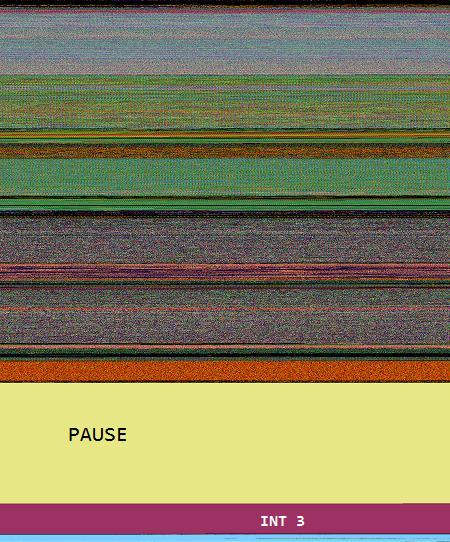
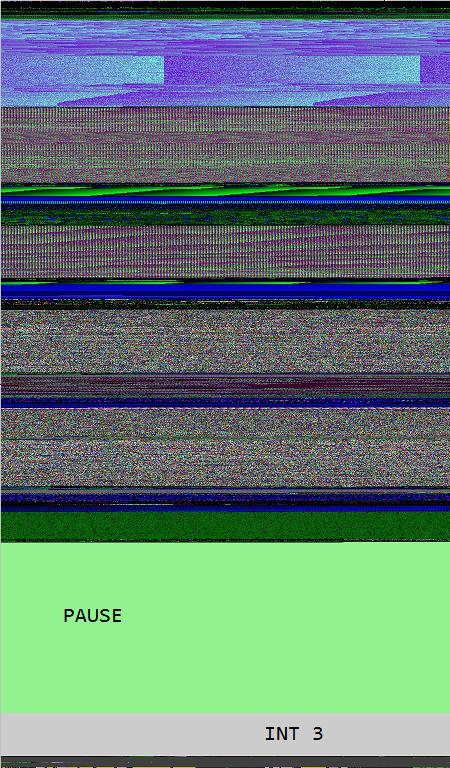
Opcodism art is not limited to assembly language code and binary installations. It also provides beautiful color illustrations of processor opcodes and instructions. In this post I provide illustrations of NOP, PAUSE and INT 3 instructions generated by Dump2Picture from memory dump images of crashed 1MbNop and 1MbPause processes.
0:000> lmp

start             end                 module name

00000000`77030000 00000000`7715d000   kernel32

00000000`77230000 00000000`773b6000   ntdll

00000001`40000000 00000001`40144000   1MbNop

000007fe`fd1c0000 000007fe`fd1f5000   apphelp

000007fe`fdaf0000 000007fe`fdc33000   rpcrt4

000007fe`ff400000 000007fe`ff508000   advapi32
8 bit image of 1Mb NOP field fenced by INT 3 wall:
16 bit image of 1Mb NOP field fenced by INT 3 wall:
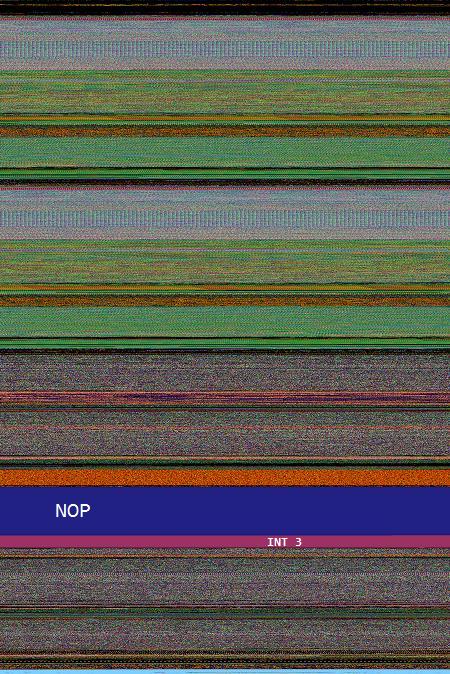
24 bit image of 1Mb NOP field fenced by INT 3 wall:
32 bit image of 1Mb NOP field fenced by INT 3 wall:
0:000> lmp

start             end                 module name

00000000`77030000 00000000`7715d000   kernel32

00000000`77230000 00000000`773b6000   ntdll

00000001`40000000 00000001`40284000   1MbPause
8 bit image of 1Mb PAUSE field fenced by INT 3 wall:
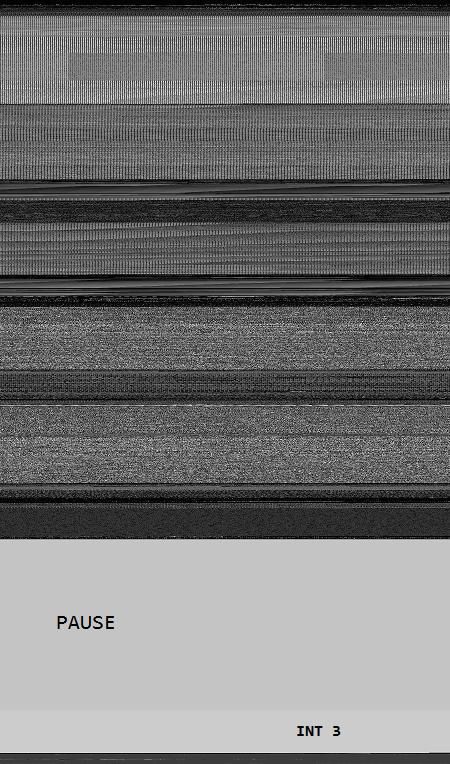
The same as above but PAUSE / INT 3 transition magnified:

16 bit image of 1Mb PAUSE field fenced by INT 3 wall:
24 bit image of 1Mb PAUSE field fenced by INT 3 wall:
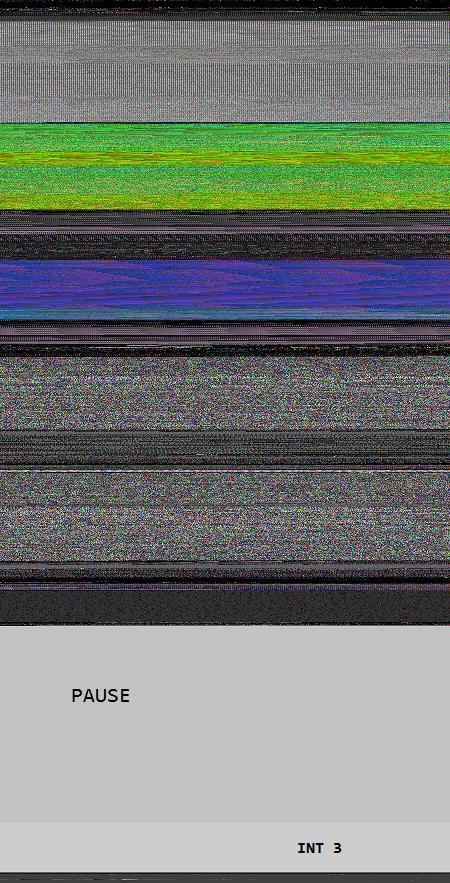
The same as above but PAUSE / INT 3 transition magnified:

32 bit image of 1Mb PAUSE field fenced by INT 3 wall:
- Dmitry Vostokov @ DumpAnalysis.org -
Fascinated by Kazimir Malevich’s Black Square I created the new art genre with the following two artistic installations:
A Pause before Crash
This is 1Mb of PAUSE instructions without the point of return:
_text SEGMENT
main PROC
DW 100000h DUP (90f3h)
main ENDP
_text ENDS
END
When launched it crashes:
0:000> kL

Child-SP          RetAddr           Call Site

00000000`0012ff58 00000000`7704be3d 1MbPause+0x201011

00000000`0012ff60 00000000`77256a51 kernel32!BaseThreadInitThunk+0xd

00000000`0012ff90 00000000`00000000 ntdll!RtlUserThreadStart+0x1d
0:000> ub rip

1MbPause+0x201002:

00000001`40201002 f390            pause

00000001`40201004 f390            pause

00000001`40201006 f390            pause

00000001`40201008 f390            pause

00000001`4020100a f390            pause

00000001`4020100c f390            pause

00000001`4020100e f390            pause

00000001`40201010 cc              int     3
You can download the source code, PDB and 64-bit EXE from here:
Do Nothing and Crash
This is 1Mb of NOP instructions without the point of return:
_text SEGMENT
main PROC
DB 100000h DUP (90h)
main ENDP
_text ENDS
END
When launched it crashes too:
0:000> kL

Child-SP          RetAddr           Call Site

00000000`0012ff58 00000000`7704be3d 1MbNop+0x101011

00000000`0012ff60 00000000`77256a51 kernel32!BaseThreadInitThunk+0xd

00000000`0012ff90 00000000`00000000 ntdll!RtlUserThreadStart+0x1d
0:000> ub rip

1MbNop+0x101009:

00000001`40101009 90              nop

00000001`4010100a 90              nop

00000001`4010100b 90              nop

00000001`4010100c 90              nop

00000001`4010100d 90              nop

00000001`4010100e 90              nop

00000001`4010100f 90              nop

00000001`40101010 cc              int     3
You can download the source code, PDB and 64-bit EXE from here:
The earliest opcodism binary was created on October 25th, 2006 that I now call Nothingness and Crash: The Smallest Program.
- Dmitry Vostokov @ DumpAnalysis.org -
This is a revised, edited, cross-referenced and thematically organized volume of selected DumpAnalysis.org blog posts about crash dump analysis and debugging written in October 2008 - June 2009 for software engineers developing and maintaining products on Windows platforms, quality assurance engineers testing software on Windows platforms and technical support and escalation engineers dealing with complex software issues. The third volume features:
- 15 new crash dump analysis patterns
- 29 new pattern interaction case studies
- Trace analysis patterns
- Updated checklist
- Fully cross-referenced with Volume 1 and Volume 2
- New appendixes
Product information:

Back cover features 3D computer memory visualization image.
- Dmitry Vostokov @ DumpAnalysis.org -
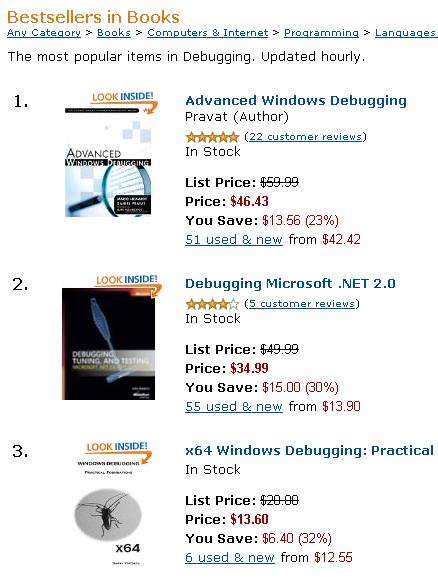
Occasionally I check my books to see how they are positioned on Amazon and noticed that Windows Debugging: Practical Foundations and Memory Dump Analysis Anthology, Volume 1 paperback titles are #1 and #2 bestsellers (at the time of this writing) on Amazon Debugging and Assembly Language Programming bestselling lists:


- Dmitry Vostokov @ DumpAnalysis.org -
Having discussed dereference fixpoints we come back to the quiz code and see what happens when we execute it after compilation as default Debug target with Debug Information Format set to Program Database to avoid extra stack space allocation:
int _tmain(int argc, _TCHAR* argv[])

{

   char c;

   char* pc = &c;

   while(1)

   {

     *pc = 0;

     pc++;

   }
   return 0;

}
Expecting crashes I created the following key HKEY_LOCAL_MACHINE \ SOFTWARE \ Microsoft \ Windows \ Windows Error Reporting \ LocalDumps with the following values: DumpFolder (REG_EXPAND_SZ) and DumpType (2, Full).
When running the compiled program I noticed that it crashed according to my expectations. The saved dump StackErasure.exe.2096.dmp confirmed that the crash was due to the stack underflow when it hit the base address:
0:000> r

eax=002c0000 ebx=7efde000 ecx=00000001 edx=002c0000 esi=00000000 edi=00000000

eip=00e11039 esp=002bf7c4 ebp=002bf7d4 iopl=0         nv up ei pl nz na po nc

cs=0023  ss=002b  ds=002b  es=002b  fs=0053  gs=002b             efl=00010202

StackErasure!wmain+0x29:

00e11039 c60200          mov     byte ptr [edx],0           ds:002b:002c0000=??
0:000> !teb

TEB at 7efdd000

    ExceptionList:        002bf810

    StackBase:            002c0000

    StackLimit:           002be000

    SubSystemTib:         00000000

    FiberData:            00001e00

    ArbitraryUserPointer: 00000000

    Self:                 7efdd000

    EnvironmentPointer:   00000000

    ClientId:             00000830 . 00000a78

    RpcHandle:            00000000

    Tls Storage:          7efdd02c

    PEB Address:          7efde000

    LastErrorValue:       0

    LastStatusValue:      0

    Count Owned Locks:    0

    HardErrorMode:        0
The loop from source code is highlighted in blue:
0:000> uf wmain

StackErasure!wmain:

00e11010 push    ebp

00e11011 mov     ebp,esp

00e11013 sub     esp,10h

00e11016 mov     eax,0CCCCCCCCh

00e1101b mov     dword ptr [ebp-10h],eax

00e1101e mov     dword ptr [ebp-0Ch],eax

00e11021 mov     dword ptr [ebp-8],eax

00e11024 mov     dword ptr [ebp-4],eax

00e11027 lea     eax,[ebp-5]

00e1102a mov     dword ptr [ebp-10h],eax
StackErasure!wmain+0x1d:

00e1102d mov     ecx,1

00e11032 test    ecx,ecx

00e11034 je      StackErasure!wmain+0x37 (00e11047)
StackErasure!wmain+0x26:

00e11036 mov     edx,dword ptr [ebp-10h]

00e11039 mov     byte ptr [edx],0

00e1103c mov     eax,dword ptr [ebp-10h]

00e1103f add     eax,1

00e11042 mov     dword ptr [ebp-10h],eax

00e11045 jmp     StackErasure!wmain+0x1d (00e1102d)
StackErasure!wmain+0x37:

00e11047 xor     eax,eax

00e11049 push    edx

00e1104a mov     ecx,ebp

00e1104c push    eax

00e1104d lea     edx,[StackErasure!wmainCRTStartup+0x10 (00e11060)]

00e11053 call    StackErasure!__tmainCRTStartup+0x50 (00e110c0)

00e11058 pop     eax

00e11059 pop     edx

00e1105a mov     esp,ebp

00e1105c pop     ebp

00e1105d ret
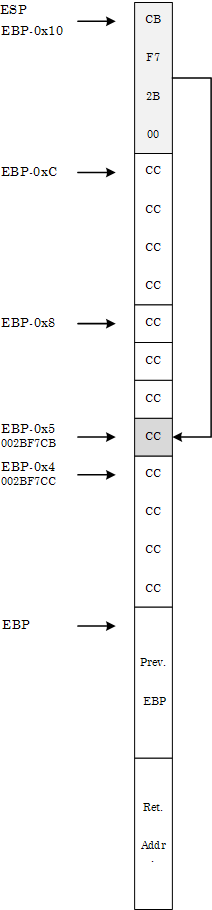
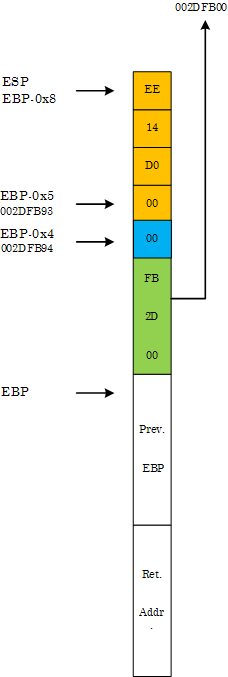
We see that our char variable ‘c’ is located at EBP-5 and the pointer ‘pc’ is located at EBP-10 (in another words ‘c’ follows ‘pc’ in memory):
00e11027 lea     eax,[ebp-5]

00e1102a mov     dword ptr [ebp-10h],eax
Both locations were initialized to 0xCCCCCCCC:
00e11016 mov     eax,0CCCCCCCCh

00e1101b mov     dword ptr [ebp-10h],eax

00e1101e mov     dword ptr [ebp-0Ch],eax

00e11021 mov     dword ptr [ebp-8],eax  ; this ends with EBP-5

00e11024 mov     dword ptr [ebp-4],eax
The memory layout before the start of the loop is depicted on the following diagram in the style of Windows Debugging: Practical Foundations book:
At the crash point we have the following final memory layout:
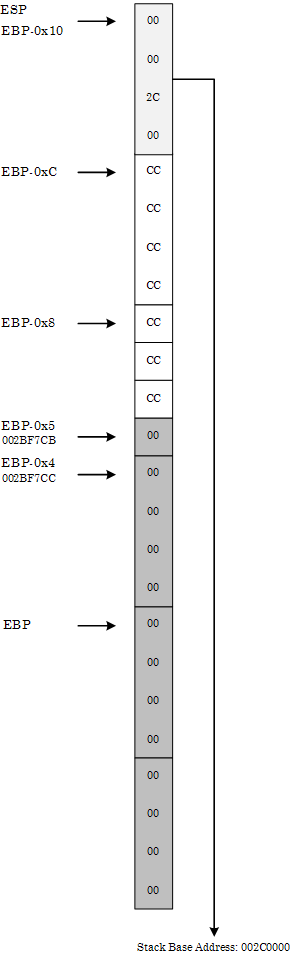
We can see it from the raw stack:
0:000> db esp

002bf7c4  00 00 2c 00 cc cc cc cc-cc cc cc 00 00 00 00 00

002bf7d4  00 00 00 00 00 00 00 00-00 00 00 00 00 00 00 00

002bf7e4  00 00 00 00 00 00 00 00-00 00 00 00 00 00 00 00

002bf7f4  00 00 00 00 00 00 00 00-00 00 00 00 00 00 00 00

002bf804  00 00 00 00 00 00 00 00-00 00 00 00 00 00 00 00

002bf814  00 00 00 00 00 00 00 00-00 00 00 00 00 00 00 00

002bf824  00 00 00 00 00 00 00 00-00 00 00 00 00 00 00 00

002bf834  00 00 00 00 00 00 00 00-00 00 00 00 00 00 00 00
or in pointer-sized (double word) values where we can see little endian effects (compare 00 00 2c 00 with 002c0000):
0:000> dp esp

002bf7c4  002c0000 cccccccc 00cccccc 00000000

002bf7d4  00000000 00000000 00000000 00000000

002bf7e4  00000000 00000000 00000000 00000000

002bf7f4  00000000 00000000 00000000 00000000

002bf804  00000000 00000000 00000000 00000000

002bf814  00000000 00000000 00000000 00000000

002bf824  00000000 00000000 00000000 00000000

002bf834  00000000 00000000 00000000 00000000
The loop code erases stack starting from EBP-5 until it hits the base address.
Now we change Basic Runtime Checks in Code Generation properties to Default, recompile and launch the project. Suddenly it no longer crashes but loops infinitely (shown in blue):
0:000> bp wmain
0:000> g

[...]
0:000> uf wmain

StackErasure!wmain:

00d01010 push    ebp

00d01011 mov     ebp,esp

00d01013 sub     esp,8

00d01016 lea     eax,[ebp-5]

00d01019 mov     dword ptr [ebp-4],eax
StackErasure!wmain+0xc:

00d0101c mov     ecx,1

00d01021 test    ecx,ecx

00d01023 je      StackErasure!wmain+0x26 (00d01036)
StackErasure!wmain+0x15:

00d01025 mov     edx,dword ptr [ebp-4]

00d01028 mov     byte ptr [edx],0

00d0102b mov     eax,dword ptr [ebp-4]

00d0102e add     eax,1

00d01031 mov     dword ptr [ebp-4],eax

00d01034 jmp     StackErasure!wmain+0xc (00d0101c)
StackErasure!wmain+0x26:

00d01036 xor     eax,eax

00d01038 mov     esp,ebp

00d0103a pop     ebp

00d0103b ret
At first it looks strange but if we look at the stack memory layout we would see that ‘pc’ pointer follows ‘c’ (the opposite to the memory layout discussed above):
00d01016 lea     eax,[ebp-5]

00d01019 mov     dword ptr [ebp-4],eax
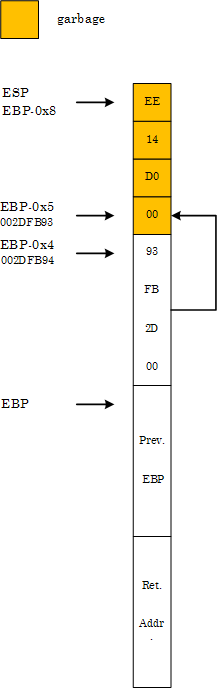
0:000> dp esp

002dfb90 00d014ee 002dfb93 002dfbe4 00d01186

002dfba0 00000001 00081d70 00081df8 5a16a657

002dfbb0 00000000 00000000 7ffdb000 00000000

002dfbc0 00000000 00000000 00000000 002dfbac

002dfbd0 000001bb 002dfc28 00d06e00 5aed06eb

002dfbe0 00000000 002dfbec 00d0105f 002dfbf8

002dfbf0 77844911 7ffdb000 002dfc38 7791e4b6

002dfc00 7ffdb000 705b3701 00000000 00000000
Therefore, when the pointer at EBP-4 is incremented by 1 during the first loop iteration it becomes a dereference fixpoint:
0:000> bp 00d0101c
0:000> g

Breakpoint 1 hit

eax=002dfb93 ebx=7ffdb000 ecx=00000001 edx=00081df8 esi=00000000 edi=00000000

eip=00d0101c esp=002dfb90 ebp=002dfb98 iopl=0         nv up ei pl nz na pe nc

cs=001b  ss=0023  ds=0023  es=0023  fs=003b  gs=0000             efl=00000206

StackErasure!wmain+0xc:

00d0101c b901000000      mov     ecx,1
0:000> t

eax=002dfb93 ebx=7ffdb000 ecx=00000001 edx=00081df8 esi=00000000 edi=00000000

eip=00d01021 esp=002dfb90 ebp=002dfb98 iopl=0         nv up ei pl nz na pe nc

cs=001b  ss=0023  ds=0023  es=0023  fs=003b  gs=0000             efl=00000206

StackErasure!wmain+0x11:

00d01021 85c9            test    ecx,ecx
0:000> t

eax=002dfb93 ebx=7ffdb000 ecx=00000001 edx=00081df8 esi=00000000 edi=00000000

eip=00d01023 esp=002dfb90 ebp=002dfb98 iopl=0         nv up ei pl nz na po nc

cs=001b  ss=0023  ds=0023  es=0023  fs=003b  gs=0000             efl=00000202

StackErasure!wmain+0x13:

00d01023 7411            je      StackErasure!wmain+0x26 (00d01036)      [br=0]
0:000> t

eax=002dfb93 ebx=7ffdb000 ecx=00000001 edx=00081df8 esi=00000000 edi=00000000

eip=00d01025 esp=002dfb90 ebp=002dfb98 iopl=0         nv up ei pl nz na po nc

cs=001b  ss=0023  ds=0023  es=0023  fs=003b  gs=0000             efl=00000202

StackErasure!wmain+0x15:

00d01025 8b55fc          mov     edx,dword ptr [ebp-4] ss:0023:002dfb94=002dfb93
0:000> t

eax=002dfb93 ebx=7ffdb000 ecx=00000001 edx=002dfb93 esi=00000000 edi=00000000

eip=00d01028 esp=002dfb90 ebp=002dfb98 iopl=0         nv up ei pl nz na po nc

cs=001b  ss=0023  ds=0023  es=0023  fs=003b  gs=0000             efl=00000202

StackErasure!wmain+0x18:

00d01028 c60200          mov     byte ptr [edx],0           ds:0023:002dfb93=00
0:000> t

eax=002dfb93 ebx=7ffdb000 ecx=00000001 edx=002dfb93 esi=00000000 edi=00000000

eip=00d0102b esp=002dfb90 ebp=002dfb98 iopl=0         nv up ei pl nz na po nc

cs=001b  ss=0023  ds=0023  es=0023  fs=003b  gs=0000             efl=00000202

StackErasure!wmain+0x1b:

00d0102b 8b45fc          mov     eax,dword ptr [ebp-4] ss:0023:002dfb94=002dfb93
0:000> t

eax=002dfb93 ebx=7ffdb000 ecx=00000001 edx=002dfb93 esi=00000000 edi=00000000

eip=00d0102e esp=002dfb90 ebp=002dfb98 iopl=0         nv up ei pl nz na po nc

cs=001b  ss=0023  ds=0023  es=0023  fs=003b  gs=0000             efl=00000202

StackErasure!wmain+0x1e:

00d0102e 83c001          add     eax,1
0:000> t

eax=002dfb94 ebx=7ffdb000 ecx=00000001 edx=002dfb93 esi=00000000 edi=00000000

eip=00d01031 esp=002dfb90 ebp=002dfb98 iopl=0         nv up ei pl nz na po nc

cs=001b  ss=0023  ds=0023  es=0023  fs=003b  gs=0000             efl=00000202

StackErasure!wmain+0x21:

00d01031 8945fc          mov     dword ptr [ebp-4],eax ss:0023:002dfb94=002dfb93
0:000> t

eax=002dfb94 ebx=7ffdb000 ecx=00000001 edx=002dfb93 esi=00000000 edi=00000000

eip=00d01034 esp=002dfb90 ebp=002dfb98 iopl=0         nv up ei pl nz na po nc

cs=001b  ss=0023  ds=0023  es=0023  fs=003b  gs=0000             efl=00000202

StackErasure!wmain+0x24:

00d01034 ebe6            jmp     StackErasure!wmain+0xc (00d0101c)
0:000> dp ebp-4 l1

002dfb94  002dfb94
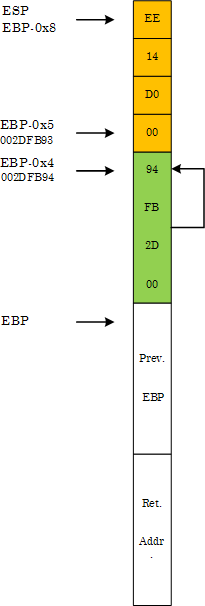
During the second iteration the assignment of zero to ‘*pc’ clears the first byte of ‘pc’:
0:000> t

Breakpoint 1 hit

eax=002dfb94 ebx=7ffdb000 ecx=00000001 edx=002dfb93 esi=00000000 edi=00000000

eip=00d0101c esp=002dfb90 ebp=002dfb98 iopl=0         nv up ei pl nz na po nc

cs=001b  ss=0023  ds=0023  es=0023  fs=003b  gs=0000             efl=00000202

StackErasure!wmain+0xc:

00d0101c b901000000      mov     ecx,1
0:000> t

eax=002dfb94 ebx=7ffdb000 ecx=00000001 edx=002dfb93 esi=00000000 edi=00000000

eip=00d01021 esp=002dfb90 ebp=002dfb98 iopl=0         nv up ei pl nz na po nc

cs=001b  ss=0023  ds=0023  es=0023  fs=003b  gs=0000             efl=00000202

StackErasure!wmain+0x11:

00d01021 85c9            test    ecx,ecx
0:000> t

eax=002dfb94 ebx=7ffdb000 ecx=00000001 edx=002dfb93 esi=00000000 edi=00000000

eip=00d01023 esp=002dfb90 ebp=002dfb98 iopl=0         nv up ei pl nz na po nc

cs=001b  ss=0023  ds=0023  es=0023  fs=003b  gs=0000             efl=00000202

StackErasure!wmain+0x13:

00d01023 7411            je      StackErasure!wmain+0x26 (00d01036)      [br=0]
0:000> t

eax=002dfb94 ebx=7ffdb000 ecx=00000001 edx=002dfb93 esi=00000000 edi=00000000

eip=00d01025 esp=002dfb90 ebp=002dfb98 iopl=0         nv up ei pl nz na po nc

cs=001b  ss=0023  ds=0023  es=0023  fs=003b  gs=0000             efl=00000202

StackErasure!wmain+0x15:

00d01025 8b55fc          mov     edx,dword ptr [ebp-4] ss:0023:002dfb94=002dfb94
0:000> t

eax=002dfb94 ebx=7ffdb000 ecx=00000001 edx=002dfb94 esi=00000000 edi=00000000

eip=00d01028 esp=002dfb90 ebp=002dfb98 iopl=0         nv up ei pl nz na po nc

cs=001b  ss=0023  ds=0023  es=0023  fs=003b  gs=0000             efl=00000202

StackErasure!wmain+0x18:

00d01028 c60200          mov     byte ptr [edx],0           ds:0023:002dfb94=94
0:000> t

eax=002dfb94 ebx=7ffdb000 ecx=00000001 edx=002dfb94 esi=00000000 edi=00000000

eip=00d0102b esp=002dfb90 ebp=002dfb98 iopl=0         nv up ei pl nz na po nc

cs=001b  ss=0023  ds=0023  es=0023  fs=003b  gs=0000             efl=00000202

StackErasure!wmain+0x1b:

00d0102b 8b45fc          mov     eax,dword ptr [ebp-4] ss:0023:002dfb94=002dfb00
0:000> dp esp

002dfb90  00d014ee 002dfb00 002dfbe4 00d01186

002dfba0  00000001 00081d70 00081df8 5a16a657

002dfbb0  00000000 00000000 7ffdb000 00000000

002dfbc0  00000000 00000000 00000000 002dfbac

002dfbd0  000001bb 002dfc28 00d06e00 5aed06eb

002dfbe0  00000000 002dfbec 00d0105f 002dfbf8

002dfbf0  77844911 7ffdb000 002dfc38 7791e4b6

002dfc00  7ffdb000 705b3701 00000000 00000000
The new ‘pc’ pointer points to the following region of the stack:
0:000> dp 002dfb00 l100/4

002dfb00  002dfb0c 00000004 00000000 5c008ede

002dfb10  002dfb28 00d0634a 0008128c 5aed018b

002dfb20  000807f8 7790fb66 00000000 7ffdb000

002dfb30  00000000 002dfb40 00d089a6 00d68ab8

002dfb40  002dfb4c 00d019bc 00000008 002dfb84

002dfb50  00d07520 00d07519 5a16a637 00000000

002dfb60  00000000 7ffdb000 00d02b10 00000004

002dfb70  00000002 002dfbd4 00d06e00 5aed007b

002dfb80  fffffffe 002dfb90 00d0769e 002dfba0

002dfb90  00d014ee 002dfb00 002dfbe4 00d01186

002dfba0  00000001 00081d70 00081df8 5a16a657

002dfbb0  00000000 00000000 7ffdb000 00000000

002dfbc0  00000000 00000000 00000000 002dfbac

002dfbd0  000001bb 002dfc28 00d06e00 5aed06eb

002dfbe0  00000000 002dfbec 00d0105f 002dfbf8

002dfbf0  77844911 7ffdb000 002dfc38 7791e4b6
The loop code now starts clearing this region until the pointer becomes the fixpoint again after successive increments and therefore continues to loop indefinitely:
0:000> bc 0 1
0:000> g

(1238.c9c): Break instruction exception - code 80000003 (first chance)

eax=7ffde000 ebx=00000000 ecx=00000000 edx=7796d094 esi=00000000 edi=00000000

eip=77927dfe esp=00a4ff30 ebp=00a4ff5c iopl=0         nv up ei pl zr na pe nc

cs=001b  ss=0023  ds=0023  es=0023  fs=003b  gs=0000             efl=00000246

ntdll!DbgBreakPoint:

77927dfe cc              int     3
0:001> dp 002dfb00 l100/4

002dfb00  0000000c 00000000 00000000 00000000

002dfb10  00000000 00000000 00000000 00000000

002dfb20  00000000 00000000 00000000 00000000

002dfb30  00000000 00000000 00000000 00000000

002dfb40  00000000 00000000 00000000 00000000

002dfb50  00000000 00000000 00000000 00000000

002dfb60  00000000 00000000 00000000 00000000

002dfb70  00000000 00000000 00000000 00000000

002dfb80  00000000 00000000 00000000 00000000

002dfb90  00000000 002dfb1f 002dfbe4 00d01186

002dfba0  00000001 00081d70 00081df8 5a16a657

002dfbb0  00000000 00000000 7ffdb000 00000000

002dfbc0  00000000 00000000 00000000 002dfbac

002dfbd0  000001bb 002dfc28 00d06e00 5aed06eb

002dfbe0  00000000 002dfbec 00d0105f 002dfbf8

002dfbf0  77844911 7ffdb000 002dfc38 7791e4b6
StackErasure that loops indefinitely is available for download.
- Dmitry Vostokov @ DumpAnalysis.org -
Imagine we have the following arrangements in memory:
address: value
where value == address, so we have effectively:
address: address
So when we dereference the address we get the address value. If we name the dereference function as p(address) we get
p(address) = address
That gave me an idea to name after the mathematical notion of a function fixpoint (fixed point).
In C++ we can write the following code to initialize a fixpoint:
void *pc = &pc;
in assembly language:
lea      eax, [pc]

mov      dword ptr [pc], eax
or using local variables:
lea      eax, [ebp-4]

mov      dword ptr [ebp-4], eax
Dereference of a fixpoint pointer gives us the same value as its address, for example, using old style conversion:
int *pc = (int *)&pc;
if (pc == (int *)*pc) {

 // TRUE
or for C++ purists:
int *pc = reinterpret_cast<int *>(&pc);
if (pc == reinterpret_cast<int *>(*pc)) {

 // TRUE
In x86 assembly language we have this comparison:
mov         eax,dword ptr [pc]

mov         ecx,dword ptr [pc]

cmp         ecx,dword ptr [eax]
or using local variables:
mov         eax,dword ptr [ebp-4]

mov         ecx,dword ptr [ebp-4]

cmp         ecx,dword ptr [eax]
Now, having discussed fixpoints, let me ask the question to ponder over this weekend. What would this code do?
int _tmain(int argc, _TCHAR* argv[])

{

   char c;

   char* pc = &c;
   while(1)

   {

     *pc = 0;

     pc++;

   }
   return 0;

}
Would it produce stack overflow with an exception, or stack underflow with an exception or loop indefinitely? The C++ Standard answer of compiler and platform dependence is not acceptable. I plan to elaborate on this topic on Monday.
The notion of counterfactual debugging (”what if” debugging) was inspired by the so called counterfactual history.
- Dmitry Vostokov @ DumpAnalysis.org -
Although the first 2 parameters are passed via registers RCX and RDX they are saved on a stack as the part of a function prolog (as can be seen in many examples from my book x64 Windows Debugging: Practical Foundations):
0:000> uf arithmetic

FunctionParameters!arithmetic [c:\dumps\wdpf-x64\functionparameters\arithmetic.cpp @ 2]:

    2 00000001`40001020 mov     dword ptr [rsp+10h],edx

    2 00000001`40001024 mov     dword ptr [rsp+8],ecx

    2 00000001`40001028 push    rdi

    3 00000001`40001029 mov     eax,dword ptr [rsp+10h]

    3 00000001`4000102d mov     ecx,dword ptr [rsp+18h]

    3 00000001`40001031 add     ecx,eax

    3 00000001`40001033 mov     eax,ecx

    3 00000001`40001035 mov     dword ptr [rsp+18h],eax

    4 00000001`40001039 mov     eax,dword ptr [rsp+10h]

    4 00000001`4000103d add     eax,1

    4 00000001`40001040 mov     dword ptr [rsp+10h],eax

    5 00000001`40001044 mov     eax,dword ptr [rsp+10h]

    5 00000001`40001048 imul    eax,dword ptr [rsp+18h]

    5 00000001`4000104d mov     dword ptr [rsp+18h],eax

    7 00000001`40001051 mov     eax,dword ptr [rsp+18h]

    8 00000001`40001055 pop     rdi

    8 00000001`40001056 ret
Notice that RDI is saved too. This helps us later in a more complex case. If we put a breakpoint at arithmetic entry we see that WinDbg is not able to get parameters from RCX and RDX:
0:000> bp 00000001`40001020
0:000> g

ModLoad: 000007fe`ff4d0000 000007fe`ff5d8000   C:\Windows\system32\ADVAPI32.DLL

ModLoad: 000007fe`fef80000 000007fe`ff0c3000   C:\Windows\system32\RPCRT4.dll

Breakpoint 0 hit

FunctionParameters!arithmetic:

00000001`40001020 89542410        mov     dword ptr [rsp+10h],edx ss:00000000`0012fe88=cccccccc
0:000> kv

Child-SP          RetAddr           : Args to Child                                                           : Call Site

00000000`0012fe78 00000001`400010a5 : cccccccc`cccccccc cccccccc`cccccccc cccccccc`cccccccc cccccccc`cccccccc : FunctionParameters!arithmetic

00000000`0012fe80 00000001`4000137c : 00000000`00000001 00000000`00282960 00000000`00000000 00000000`00000000 : FunctionParameters!main+0×35

00000000`0012fec0 00000001`4000114e : 00000000`00000000 00000000`00000000 00000000`00000000 00000000`00000000 : FunctionParameters!__tmainCRTStartup+0×21c

00000000`0012ff30 00000000`7776be3d : 00000000`00000000 00000000`00000000 00000000`00000000 00000000`00000000 : FunctionParameters!mainCRTStartup+0xe

00000000`0012ff60 00000000`778a6a51 : 00000000`00000000 00000000`00000000 00000000`00000000 00000000`00000000 : kernel32!BaseThreadInitThunk+0xd

00000000`0012ff90 00000000`00000000 : 00000000`00000000 00000000`00000000 00000000`00000000 00000000`00000000 : ntdll!RtlUserThreadStart+0×1d
This seems correct approach in general because at the time of any other breakpoint in the middle of the code parameter passing registers could be already overwritten, for example, RCX at 0000000140001031. However, as soon as we execute the first two MOV instruction one by one, parameters appear on kv output one by one too:
0:000> t

ModLoad: 000007fe`fd810000 000007fe`fd845000   C:\Windows\system32\apphelp.dll

FunctionParameters!arithmetic+0x4:

00000001`40001024 894c2408        mov     dword ptr [rsp+8],ecx ss:00000000`0012fe80=cccccccc
0:000> kv

Child-SP          RetAddr           : Args to Child                                                           : Call Site

00000000`0012fe78 00000001`400010a5 : cccccccc`cccccccc cccccccc`00000001 cccccccc`cccccccc cccccccc`cccccccc : FunctionParameters!arithmetic+0×4

00000000`0012fe80 00000001`4000137c : 00000000`00000001 00000000`00282960 00000000`00000000 00000000`00000000 : FunctionParameters!main+0×35

00000000`0012fec0 00000001`4000114e : 00000000`00000000 00000000`00000000 00000000`00000000 00000000`00000000 : FunctionParameters!__tmainCRTStartup+0×21c

00000000`0012ff30 00000000`7776be3d : 00000000`00000000 00000000`00000000 00000000`00000000 00000000`00000000 : FunctionParameters!mainCRTStartup+0xe

00000000`0012ff60 00000000`778a6a51 : 00000000`00000000 00000000`00000000 00000000`00000000 00000000`00000000 : kernel32!BaseThreadInitThunk+0xd

00000000`0012ff90 00000000`00000000 : 00000000`00000000 00000000`00000000 00000000`00000000 00000000`00000000 : ntdll!RtlUserThreadStart+0×1d
0:000> t

FunctionParameters!arithmetic+0x8:

00000001`40001028 57              push    rdi
0:000> kv

Child-SP          RetAddr           : Args to Child                                                           : Call Site

00000000`0012fe78 00000001`400010a5 : cccccccc`00000001 cccccccc`00000001 cccccccc`cccccccc cccccccc`cccccccc : FunctionParameters!arithmetic+0×8

00000000`0012fe80 00000001`4000137c : 00000000`00000001 00000000`00282960 00000000`00000000 00000000`00000000 : FunctionParameters!main+0×35

00000000`0012fec0 00000001`4000114e : 00000000`00000000 00000000`00000000 00000000`00000000 00000000`00000000 : FunctionParameters!__tmainCRTStartup+0×21c

00000000`0012ff30 00000000`7776be3d : 00000000`00000000 00000000`00000000 00000000`00000000 00000000`00000000 : FunctionParameters!mainCRTStartup+0xe

00000000`0012ff60 00000000`778a6a51 : 00000000`00000000 00000000`00000000 00000000`00000000 00000000`00000000 : kernel32!BaseThreadInitThunk+0xd

00000000`0012ff90 00000000`00000000 : 00000000`00000000 00000000`00000000 00000000`00000000 00000000`00000000 : ntdll!RtlUserThreadStart+0×1d
Now we come to the more complex example:
1: kd> kv

  *** Stack trace for last set context - .thread/.cxr resets it

Child-SP          RetAddr           : Args to Child                                                           : Call Site

fffffa60`166a7020 fffffa60`07e9dbf2 : fffffa80`1dbd8820 00000000`00000000 fffffa80`1ec3b7a8 fffffa60`166a7278 : Driver!DeviceWrite+0xae

fffffa60`166a7050 fffffa60`062ae7cb : 00000000`00000000 fffffa80`1dbd8820 fffffa60`166a7340 fffffa80`1df4f520 : Driver!RawWrite+0×8a

[…]
1: kd> r

Last set context:

rax=000000000083a03b rbx=fffffa801ec3b800 rcx=fffffa8018cdc000

rdx=0000000000000004 rsi=fffffa801ec3b9f0 rdi=0000000005040000

rip=fffffa6007ea006e rsp=fffffa60166a7020 rbp=fffffa801ec3b7a8

 r8=fffff6fd400f61e0  r9=000000000083a03b r10=fffffa801ec3b9f8

r11=fffffa801ec3b9f8 r12=fffffa801e7c9000 r13=0000000000000000

r14=000000000038011b r15=fffffa8019891670

iopl=0         nv up ei ng nz na po cy

cs=0010 ss=0018 ds=002b es=002b fs=0053 gs=002b efl=00010287

Driver!DeviceWrite+0xae:

fffffa60`07ea006e mov     rax,qword ptr [rdi+10h] ds:002b:00000000`05040010=????????????????
We know that the first parameter to Write function is a pointer to some structure we want to explore because we see from the disassembly that some member from that structure was used ([rcx+320h]) and it was used as a pointer (assigned to RDI) that was trapping ([rdi+10h]):
1: kd> .asm no_code_bytes

Assembly options: no_code_bytes
1: kd> u Driver!DeviceWrite Driver!DeviceWrite+0xae+10

Driver!DeviceWrite:

fffffa60`07e9ffc0 mov     qword ptr [rsp+8],rbx

fffffa60`07e9ffc5 mov     qword ptr [rsp+10h],rbp

fffffa60`07e9ffca mov     qword ptr [rsp+18h],rsi

fffffa60`07e9ffcf push    rdi

fffffa60`07e9ffd0 sub     rsp,20h

fffffa60`07e9ffd4 mov     rdi,qword ptr [rcx+320h]

[…]

fffffa60`07ea006e mov     rax,qword ptr [rdi+10h] ; TRAP

[…]
Unfortunately RCX was not saved on the stack and fffffa80`1dbd8820 from kv was just the value of the saved RBX. This can be double-checked by verifying that parameter+320 doesn’t point to RDI value (05040000) at the time of the trap:
1: kd> dq fffffa80`1dbd8820+320 l1

fffffa80`1dbd8b40  00000000`00020000
Looking at DeviceWrite caller we see that RCX was initialized from RDI:
1: kd> ub fffffa60`07e9dbf2

Driver!RawWrite+0x66:

fffffa60`07e9dbce mov     rax,qword ptr [rdi+258h]

fffffa60`07e9dbd5 mov     qword ptr [rcx-18h],rax

fffffa60`07e9dbd9 mov     rax,qword ptr [rdi+260h]

fffffa60`07e9dbe0 mov     qword ptr [rcx-20h],rax

fffffa60`07e9dbe4 mov     dword ptr [rdx+10h],ebp

fffffa60`07e9dbe7 mov     rdx,rsi

fffffa60`07e9dbea mov     rcx,rdi

fffffa60`07e9dbed call    Driver!DeviceWrite (fffffa60`07e9ffc0)
We also see that RDI was saved at the function prolog so we can get our real first parameter from the raw stack bearing in mind that 0×20 was subtracted from RSP too:
1: kd> dq esp

fffffa60`166a7020  fffffa80`1ec3b800 00000000`05040000 ; SUB RSP, 20H

fffffa60`166a7030  fffffa60`07edc5dd fffffa60`07ee6f8f ;

fffffa60`166a7040  fffffa80`1ec3b520 fffffa60`07e9dbf2 ; Saved RDI - Return Address

fffffa60`166a7050  fffffa80`1dbd8820 00000000`00000000 ; Saved RBX and RBP

fffffa60`166a7060  fffffa80`1ec3b7a8 fffffa60`166a7278 ; Saved RSI

fffffa60`166a7070  fffffa60`166a7250 fffffa60`01ab5180

fffffa60`166a7080  fffffa80`1e2937c8 fffff800`018a928a

fffffa60`166a7090  00000003`0004000d 00000026`0024000d
We see that saved RDI value +320 points to the right expected address:
1: kd> dq fffffa80`1ec3b520+320 l1

fffffa80`1ec3b840  00000000`05040000
Now we can investigate the structure but this is beyond the scope of this post.
- Dmitry Vostokov @ DumpAnalysis.org -
Readers of my book Windows Debugging: Practical Foundations asked why so much space is allocated on a stack when they run the sample from Chapter 10, “Frame Pointer and Local Variables”. They expected the following instruction for two integer local variables:
sub esp, 8
What they see is:
sub esp, d8h
Originally I thought that it was the effect of certain optimization or verification options for default Debug configuration in Visual C++. To check that I created a small console project with the following C/C++ code:
int _tmain(int argc, _TCHAR* argv[])

{

    int a = 1;
    return 0;

}
Default Debug configuration in Visual C++ 2008 Express Edition generates this code:
0:000:x86> uf wmain

StackAllocation!wmain:

    7 01211370 push    ebp

    7 01211371 mov     ebp,esp

    7 01211373 sub     esp,0CCh

    7 01211379 push    ebx

    7 0121137a push    esi

    7 0121137b push    edi

    7 0121137c lea     edi,[ebp-0CCh]

    7 01211382 mov     ecx,33h

    7 01211387 mov     eax,0CCCCCCCCh

    7 0121138c rep stos dword ptr es:[edi]

    8 0121138e mov     dword ptr [ebp-8],1

   10 01211395 xor     eax,eax

   11 01211397 pop     edi

   11 01211398 pop     esi

   11 01211399 pop     ebx

   11 0121139a mov     esp,ebp

   11 0121139c pop     ebp

   11 0121139d ret
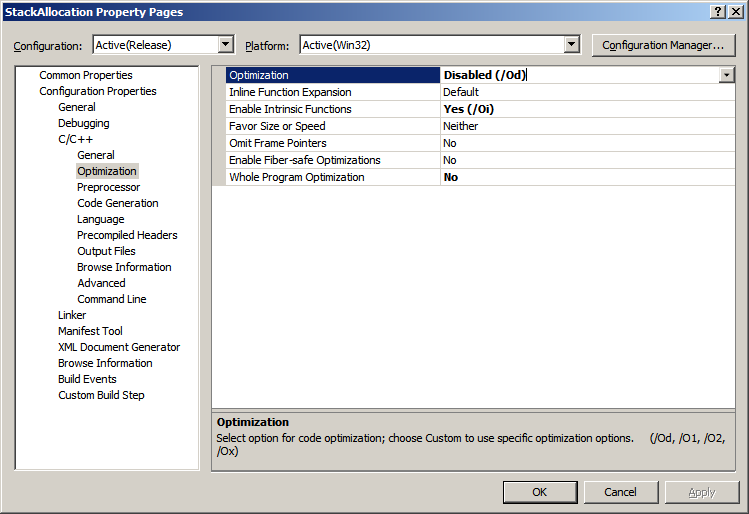
Default Release configuration with disabled optimization and whole program optimization properties also generates the code with large stack space reservation:
0:000:x86> uf wmain

StackAllocation!wmain:

    7 00021000 push    ebp

    7 00021001 mov     ebp,esp

    7 00021003 sub     esp,44h

    7 00021006 push    ebx

    7 00021007 push    esi

    7 00021008 push    edi

    8 00021009 mov     dword ptr [ebp-4],1

   10 00021010 xor     eax,eax

   11 00021012 pop     edi

   11 00021013 pop     esi

   11 00021014 pop     ebx

   11 00021015 mov     esp,ebp

   11 00021017 pop     ebp

   11 00021018 ret
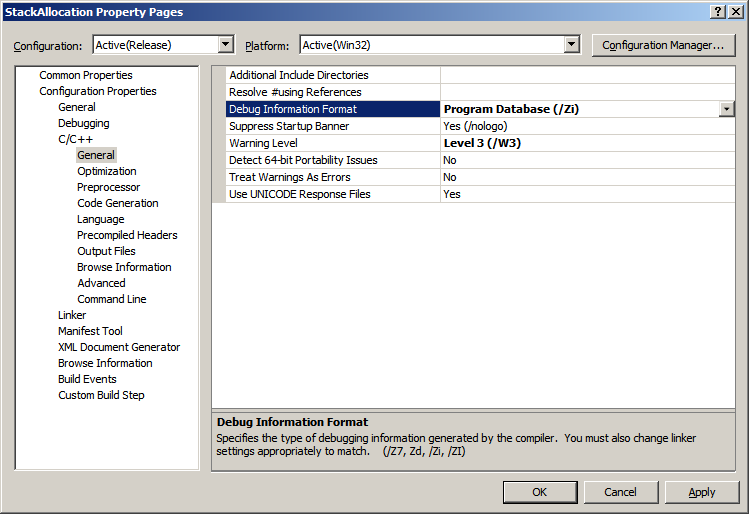
We still have 0×44 bytes allocated instead of 4. Playing with further options I found that choosing Program Database (/Zi) instead of default Program Database for Edit & Continue (/ZI) Debug Information Format general property reduces allocated stack space down to exact 4 bytes:
0:000:x86> uf wmain

StackAllocation!wmain:

    7 00c71000 push    ebp

    7 00c71001 mov     ebp,esp

    7 00c71003 push    ecx

    8 00c71004 mov     dword ptr [ebp-4],1

   10 00c7100b xor     eax,eax

   11 00c7100d mov     esp,ebp

   11 00c7100f pop     ebp

   11 00c71010 ret
We see here push ecx instead of sub esp, 4 but the result is equivalent in terms of space reservation of 4 bytes. Going back to Debug configuration and changing Debug Information Format we reduce space allocation too:
0:000:x86> uf wmain

StackAllocation!wmain:

    7 01361010 push    ebp

    7 01361011 mov     ebp,esp

    7 01361013 push    ecx

    7 01361014 mov     dword ptr [ebp-4],0CCCCCCCCh

    8 0136101b mov     dword ptr [ebp-4],1

   10 01361022 xor     eax,eax

   11 01361024 mov     esp,ebp

   11 01361026 pop     ebp

   11 01361027 ret
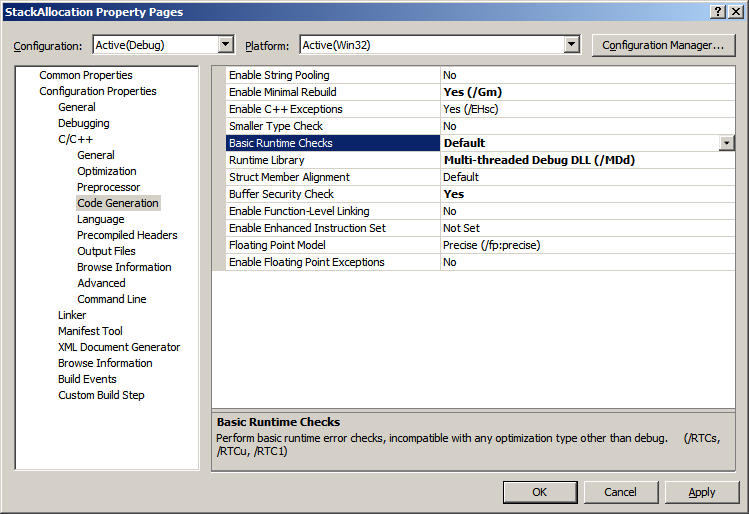
We also see redundant filling of 4 bytes with 0xCC pattern but this is the effect of Basic Runtime Checks in Code Generation properties. If we change them to Default we eliminate filling and the code becomes identical to Release configuration:
0:000:x86> uf wmain

StackAllocation!wmain:

    7 010e1010 push    ebp

    7 010e1011 mov     ebp,esp

    7 010e1013 push    ecx

    8 010e1014 mov     dword ptr [ebp-4],1

   10 010e101b xor     eax,eax

   11 010e101d mov     esp,ebp

   11 010e101f pop     ebp

   11 010e1020 ret
- Dmitry Vostokov @ DumpAnalysis.org -
Shortly after being published, x64 Windows Debugging: Practical Foundations book rises to the top of Amazon debugging bestesellers list (on 22:30 19.08.09):
- Dmitry Vostokov @ DumpAnalysis.org -
I was recently asked why the following code used byte ptr modifier for MOV instruction when assigning a number to a memory location pointed to by a register:
C/C++ code:
int a;

int *pa = &a;
void foo()

{

    __asm

    {

        // ...

        mov eax,   [pa]

        mov [eax], 1

        // ...

    }

}
Generated x86 assembly language code:
0:000:x86> uf foo

[...]

0042d64e c60001 mov byte ptr [eax],1

[…]
It looks like by default Visual C++ inline assembler treats MOV as “byte ptr” because it doesn’t know about C or C++ language semantics. Originally I thought that was the sign of a code optimization because the resulted binary code is smaller than the one generated by dword ptr. In order to check that I used a WinDbg command:
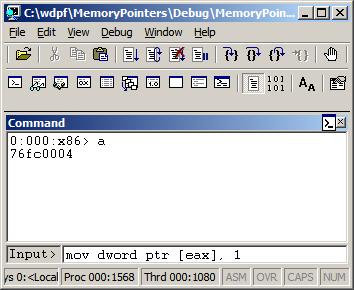
0:000> a

77067dfe mov dword ptr [eax], 1

mov dword ptr [eax], 1

77067e04
0:000> u 77067dfe

ntdll!DbgBreakPoint:

77067dfe c70001000000    mov     dword ptr [eax],1

77067e04 0c8b            or      al,8Bh

77067e06 54              push    esp

77067e07 2408            and     al,8

77067e09 c70200000000    mov     dword ptr [edx],0

77067e0f 897a04          mov     dword ptr [edx+4],edi

77067e12 0bff            or      edi,edi

77067e14 741e            je      ntdll!RtlInitString+0×34 (77067e34)
This could be possible because the variable “a” is global, initialized to 0 during the program startup, so it is safe to change just one byte. If “a” was a local variable (on stack) than other 3 bytes of DWORD could contain garbage from the previously used stack memory. However, I noticed that the program was compiled as Debug target with all optimization turned off. If Visual C++ compiler was used it should have assumed that the variable “a” could have been referenced from other compilation units and no longer contained 0 before the assignment in foo function. I recreated the same code in C/C++, built the new Debug executable, and indeed, it used dword ptr instead of byte ptr as expected from C/C++ semantics.
- Dmitry Vostokov @ DumpAnalysis.org -
Errata for the previous book Windows Debugging: Practical Foundations has been published:
Next week the updated version (revision 2.0) should be available on Amazon and other stores for both paperback and hardback titles. Digital version on Lulu has already been updated.
- Dmitry Vostokov @ DumpAnalysis.org -
The digital version of the book is finally available:
x64 Windows Debugging: Practical Foundations
Paperback should be available in 1-2 weeks on Amazon and other stores. When working on the book I fixed errors in the previous x86 version. Errata file for it should be available tomorrow.
- Dmitry Vostokov @ DumpAnalysis.org -
OpenTask plans to expand its Practical Foundations series and publish the following 2 books for the forthcoming Memory Dump Analysis Fundamentals certification (Unix track) being developed by Memory Analysis and Debugging Institute:
Linux, FreeBSD and Mac OS X Debugging: Practical Foundations (ISBN: 978-1906717773)
64-bit Linux, FreeBSD and Mac OS X Debugging: Practical Foundations (ISBN: 978-1906717780)
- Dmitry Vostokov @ DumpAnalysis.org -
I’ve decided to spend a few hours every week reading and / or re-reading various Intel 64 and IA-32 Architectures manuals to keep myself informed in differences between x64 and x86, revive Asmpedia and perhaps even apply gained insights to memory dump analysis. Today I read 2.1 - 2.2.5 sections from Volume 1 and here’s a rough picture of processor families that I assembled after reading:
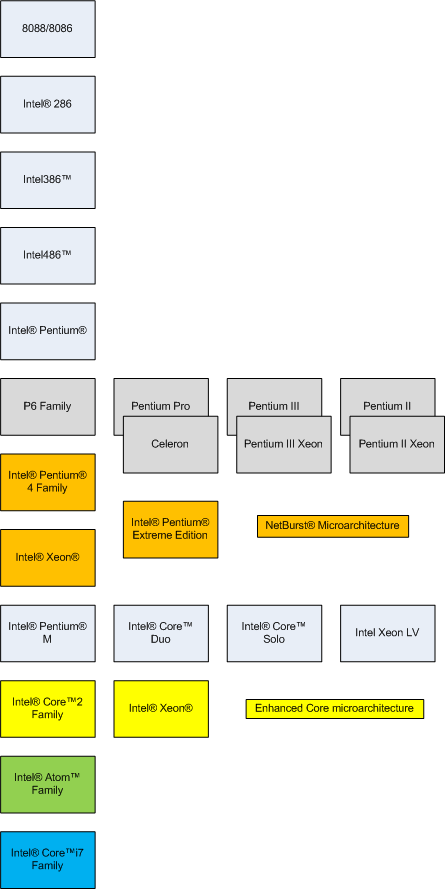
Most of these models and their hardware architecture are discussed in this popular book that I read more than a year ago and still recommend without hesitation:
- Dmitry Vostokov @ DumpAnalysis.org -