Archive for the ‘Announcements’ Category
Saturday, January 21st, 2012
According to Google Analytics the number of visits / year increased by 4% since 2010 with almost 160,000 unique visitors (2% increase) from 180 countries and 34% of them are coming back. 2,725 visits were via 12 mobile operating systems (106% increase). Here are the top 100 network locations out of 28,932:
| Service Provider |
Visits
|
| microsoft corp |
5,292
|
| comcast cable communications inc. |
3,596
|
| internet service provider |
3,509
|
| road runner holdco llc |
3,314
|
| verizon online llc |
2,597
|
| comite gestor da internet no brasil |
2,557
|
| hewlett-packard company |
2,546
|
| ip pools |
2,222
|
| deutsche telekom ag |
2,160
|
| japan network information center |
2,109
|
| chunghwa telecom data communication business group |
1,632
|
| intel corporation |
1,518
|
| uunet non-portable customer assignment |
1,312
|
| qwest communications company llc |
1,202
|
| symantec corporation |
1,170
|
| charter communications |
1,110
|
| at&t internet services |
1,108
|
| emc corporation |
1,099
|
| network of citrix systems inc |
1,093
|
| broadband multiplay project o/o dgm bb noc bsnl bangalore |
1,063
|
| abts (karnataka) |
1,043
|
| comcast cable communications holdings inc |
986
|
| eircom |
919
|
| this space is statically assigned. |
918
|
| chinanet guangdong province network |
900
|
| cox communications |
896
|
| korea telecom |
895
|
| proxad / free sas |
886
|
| comcast business communications llc |
845
|
| tw telecom holdings inc. |
825
|
| china unicom beijing province network |
816
|
| psinet inc. |
811
|
| kaspersky lab internet |
734
|
| telstra internet |
716
|
| chinanet shanghai province network |
664
|
| comcast cable communications |
652
|
| honeywell international inc. |
641
|
| cisco systems inc. |
637
|
| shaw communications inc. |
629
|
| cox communications inc. |
627
|
| xo communications |
618
|
| ntt communications corporation |
604
|
| optimum online (cablevision systems) |
597
|
| microsoft |
595
|
| symantec |
590
|
| krnic |
589
|
| citrix systems inc. |
571
|
| chtd chunghwa telecom co. ltd. |
557
|
| telefonica de espana sau |
547
|
| this space is statically assigned |
543
|
| dynamic ip pool for broadband customers |
538
|
| frontier communications of america inc. |
523
|
| computer associates international |
501
|
| appense |
479
|
| telus communications inc. |
473
|
| unknown |
473
|
| research in motion limited |
469
|
| singnet pte ltd |
458
|
| customers ie |
457
|
| arcor ag |
454
|
| chinanet jiangsu province network |
448
|
| sympatico hse |
445
|
| suddenlink communications |
435
|
| nib (national internet backbone) |
429
|
| comcast cable communications ip services |
426
|
| rcs & rds s.a. |
425
|
| dynamic pools |
421
|
| siemens ag |
419
|
| mcafee inc. |
410
|
| iinet limited |
409
|
| smart comp. a.s. |
406
|
| eset s.r.o. |
400
|
| tpg internet pty ltd. |
393
|
| ziggo consumers |
390
|
| ncc#2011011865 approved ip assignment |
383
|
| ibm india private limited |
373
|
| abts tamilnadu |
355
|
| pt telkom indonesia |
340
|
| tata teleservices ltd - tata indicom - cdma division |
336
|
| pacnet services (japan) corp. |
334
|
| opera software asa |
333
|
| core ip development |
332
|
| easynet ltd |
327
|
| mcafee |
313
|
| global crossing |
312
|
| uecomm |
311
|
| wipro technologies |
310
|
| mtnl cat b isp |
306
|
| upc polska sp. z o.o. |
305
|
| integra telecom inc. |
304
|
| videotron ltee |
299
|
| network of ign arch. and design gb |
297
|
| rcom-wireless-hsd-mumbai |
292
|
| scansafe inc. |
292
|
| hutchison global communications |
285
|
| upc slovakia |
279
|
| gesti n de direccionamiento uninet |
278
|
| bellsouth.net inc. |
277
|
| starhub cable vision ltd |
271
|
| las colinas microsoft |
268
|
Top 25 visiting countries:
| Country/Territory |
Visits
|
| United States |
67,799
|
| India |
22,266
|
| United Kingdom |
17,258
|
| Russia |
11,094
|
| Germany |
10,244
|
| China |
8,928
|
| Canada |
7,569
|
| France |
5,551
|
| Japan |
4,944
|
| Australia |
4,792
|
| South Korea |
4,279
|
| Taiwan |
3,845
|
| Ukraine |
3,315
|
| Netherlands |
3,176
|
| Israel |
2,791
|
| Poland |
2,781
|
| Brazil |
2,773
|
| Italy |
2,701
|
| Spain |
2,623
|
| Ireland |
2,592
|
| Romania |
2,391
|
| Czech Republic |
2,359
|
| Singapore |
2,307
|
| Sweden |
2,255
|
| Finland |
1,800
|
More than 8,000 portal and blog pages were viewed a total of more than 392,000 times with top 100 content pages:
| Page |
Pageviews
|
| / |
39,456
|
| /blog/ |
30,649
|
| /blog/index.php/2007/06/20/crash-dump-analysis-checklist/ |
7,596
|
| /blog/index.php/category/windbg-tips-and-tricks/ |
7,406
|
| /blog/index.php/2008/01/10/what-is-kifastsystemcallret/ |
5,553
|
| /blog/index.php/2008/09/12/adplus-in-21-seconds-and-13-steps/ |
4,179
|
| /blog/index.php/2007/07/20/crash-dump-analysis-patterns-part-17/ |
3,712
|
| /blog/index.php/category/minidump-analysis/ |
3,393
|
| /blog/index.php/category/windows-7/ |
3,012
|
| /blog/index.php/2007/09/17/resolving-symbol-file-could-not-be-found/ |
2,932
|
| /blog/index.php/2007/09/06/minidump-analysis-part-2/ |
2,859
|
| /Tools |
2,632
|
| /Memory+Dump+Analysis+Anthology+Volume+5 |
2,507
|
| /blog/index.php/category/windbg-scripts/ |
2,444
|
| /ru/blog/ |
2,337
|
| /blog/index.php/category/windows-server-2008/ |
2,262
|
| /blog/index.php/2008/03/13/crash-dump-analysis-patterns-part-2b/ |
2,196
|
| /blog/index.php/2006/10/31/crash-dump-analysis-patterns-part-2/ |
2,182
|
| /blog/index.php/2008/04/22/bugchecks-system_service_exception/ |
2,073
|
| /blog/index.php/2007/09/11/crash-dump-analysis-patterns-part-26/ |
1,998
|
| /blog/index.php/2008/01/24/crash-dump-analysis-patterns-part-43/ |
1,986
|
| /blog/index.php/2007/04/03/crash-dump-analysis-patterns-part-11/ |
1,960
|
| /blog/index.php/2007/10/11/minidump-analysis-part-4/ |
1,938
|
| /blog/index.php/category/gdb-for-windbg-users/ |
1,928
|
| /blog/index.php/2006/12/09/clipboard-issues-explained/ |
1,922
|
| /blog/index.php/about/ |
1,863
|
| /blog/index.php/2006/10/30/crash-dump-analysis-patterns-part-1/ |
1,803
|
| /FCMDA-book |
1,800
|
| /mda-learning-speed |
1,793
|
| /blog/index.php/2007/02/02/crash-dump-analysis-patterns-part-8/ |
1,753
|
| /Memory+Dump+Analysis+Anthology+Volume+1 |
1,746
|
| /blog/index.php/2007/04/25/bugchecks-system_thread_exception_not_handled/ |
1,712
|
| /blog/index.php/2007/02/09/crash-dump-analysis-patterns-part-9a/ |
1,705
|
| /blog/index.php/2007/08/06/crash-dump-analysis-patterns-part-20a/ |
1,661
|
| /blog/index.php/category/windbg-tips-and-tricks/page/2/ |
1,661
|
| /blog/index.php/2008/03/12/bug-check-frequencies/ |
1,646
|
| /blog/index.php/2007/10/17/crash-dump-analysis-patterns-part-31/ |
1,615
|
| /blog/index.php/2007/03/04/windbg-tips-and-tricks-analyzing-hangs-faster/ |
1,605
|
| /blog/index.php/basic-windows-crash-dump-analysis/ |
1,600
|
| /blog/index.php/2007/07/15/interrupts-and-exceptions-explained-part-4/ |
1,591
|
| /blog/index.php/category/bugchecks-depicted/ |
1,584
|
| /blog/index.php/2007/08/29/minidump-analysis-part-1/ |
1,508
|
| /blog/index.php/2008/06/12/crash-dump-analysis-patterns-part-59b/ |
1,479
|
| /blog/index.php/crash-dump-analysis-patterns/ |
1,456
|
| /blog/index.php/2008/03/08/time-travel-debugging/ |
1,453
|
| /ru/blog/index.php/category/komandy-otladchika-windbg/ |
1,420
|
| /WinDbg+reference |
1,396
|
| /blog/index.php/crash-dump-examples/ |
1,358
|
| /advanced-software-debugging-reference |
1,347
|
| /blog/index.php/category/windbg-tips-and-tricks/page/6/ |
1,317
|
| /ru/blog/index.php/page/2/ |
1,314
|
| /blog/index.php/2010/01/08/live-kernel-debugging-of-a-system-freeze-case-study/ |
1,298
|
| /Forthcoming+Windows+Debugging+Notebook |
1,285
|
| /Crash+Dump+Analysis+for+System+Administrators |
1,278
|
| /blog/index.php/2007/03/03/windbg-tips-and-tricks-hypertext-commands/ |
1,240
|
| /accelerated-windows-memory-dump-analysis |
1,191
|
| /blog/index.php/2007/06/21/crash-dump-analysis-patterns-part-16a/ |
1,178
|
| /blog/index.php/category/cartoons/ |
1,157
|
| /blog/index.php/category/windbg-tips-and-tricks/page/7/ |
1,128
|
| /blog/index.php/2008/06/26/heuristic-stack-trace-in-windbg-693113/ |
1,114
|
| /blog/index.php/2007/12/17/crash-dump-analysis-patterns-part-41b/ |
1,106
|
| /blog/index.php/category/mac-crash-corner/ |
1,082
|
| /blog/index.php/2007/05/19/resurrecting-dr-watson-on-vista/ |
1,036
|
| /blog/index.php/category/bugchecks-depicted/page/2/ |
976
|
| /blog/index.php/2007/02/10/crash-dump-analysis-in-visual-studio-2005/ |
947
|
| /blog/index.php/category/dump-analysis/ |
937
|
| /blog/index.php/2008/05/09/windbg-cheat-sheet-for-crash-dump-analysis/ |
931
|
| /arts-photography-links |
917
|
| /blog/index.php/2008/04/03/crash-dump-analysis-patterns-part-57/ |
915
|
| /blog/index.php/2007/06/21/repair-clipboard-chain-201/ |
880
|
| /blog/index.php/automated-analysis/ |
848
|
| /blog/index.php/2007/07/25/reconstructing-stack-trace-manually/ |
844
|
| /Forthcoming+Windows+Debugging:+Practical+Foundations |
841
|
| /Memory+Dump+Analysis+Anthology+Volume+4 |
831
|
| /blog/index.php/2007/09/ |
828
|
| /blog/index.php/2007/09/14/crash-dump-analysis-patterns-part-27/ |
819
|
| /museum-debugging |
813
|
| /blog/index.php/dumps-for-dummies/ |
810
|
| /blog/index.php/2007/08/19/crash-dump-analysis-patterns-part-23a/ |
807
|
| /blog/index.php/2007/08/04/visualizing-memory-dumps/ |
797
|
| /blog/index.php/2007/11/02/crash-dump-analysis-patterns-part-13c/ |
785
|
| /blog/index.php/2008/01/02/how-to-distinguish-between-1st-and-2nd-chances/ |
784
|
| /blog/index.php/2008/05/08/stl-and-windbg/ |
780
|
| /blog/index.php/2007/05/20/custom-postmortem-debuggers-on-vista/ |
764
|
| /blog/index.php/2007/10/01/windows-service-crash-dumps-on-vista/ |
760
|
| /blog/index.php/category/linux-crash-corner/ |
748
|
| /blog/index.php/memory-dump-analysis-interview-questions/ |
746
|
| /blog/index.php/2007/12/19/crash-dump-analysis-patterns-part-42b/ |
723
|
| /blog/index.php/2007/10/30/object-names-and-waiting-threads/ |
720
|
| /blog/index.php/2006/10/09/dumps-for-dummies-part-1/ |
700
|
| /blog/index.php/category/windbg-scripts/page/2/ |
693
|
| /node?page=1 |
687
|
| /Forthcoming+Memory+Dump+Analysis+Anthology+Volume+2 |
686
|
| /blog/index.php/2006/10/ |
680
|
| /blog/index.php/2008/10/15/crash-dump-analysis-patterns-part-1b/ |
680
|
| /blog/index.php/2006/11/01/crash-dump-analysis-patterns-part-3/ |
677
|
| /blog/index.php/2007/12/12/crash-dump-analysis-patterns-part-41a/ |
676
|
| /blog/index.php/category/net-debugging/ |
675
|
| /blog/index.php/2007/07/15/crash-dump-analysis-patterns-part-13b/ |
674
|
| /blog/index.php/category/windbg-scripts/page/3/ |
667
|
More than 70,000 Google search keywords pointed to the portal and this blog with 100 most frequent (some are in Russian):
| Keyword |
Visits
|
| crash dump |
2,485
|
| crash dump analysis |
2,042
|
| kifastsystemcallret |
1,881
|
| nt!_gshandlercheck_seh |
1,111
|
| adplus |
1,099
|
| dump analysis |
894
|
| ntdll!kifastsystemcallret |
640
|
| windbg |
595
|
| bugcheck 3b |
570
|
| win32 error 0n2 |
551
|
| memory dump analysis |
526
|
| symbol file could not be found |
405
|
| windbg commands |
393
|
| dmitry vostokov |
385
|
| dumpanalysis.org |
361
|
| fnodobfm |
361
|
| system_thread_exception_not_handled |
338
|
| adplus download |
336
|
| crash dump analyzer |
328
|
| crash dump windows 7 |
326
|
| windbg crash dump analysis |
320
|
| kisystemservicecopyend |
317
|
| idna trace |
306
|
| dumpanalysis |
301
|
| minidump analysis |
288
|
| warning: frame ip not in any known module. following frames may be wrong. |
264
|
| crash dumps |
253
|
| windows 7 crash dump |
250
|
| crashdump |
244
|
| frame ip not in any known module |
239
|
| adplus tutorial |
237
|
| memory dump analysis anthology |
235
|
| core dump analysis |
224
|
| windbg script |
217
|
| kiuserexceptiondispatcher |
213
|
| application_fault_status_breakpoint |
211
|
| pool corruption |
192
|
| exception_double_fault |
189
|
| basethreadinitthunk |
188
|
| анализ дампа памяти |
187
|
| getcontextstate failed, 0xd0000147 |
184
|
| ntdll kifastsystemcallret |
184
|
| nngakegl |
180
|
| memory dump analysis tool |
179
|
| analyze minidump |
177
|
| error: symbol file could not be found |
176
|
| dump analyzer |
175
|
| kernel_mode_exception_not_handled |
174
|
| rtlpwaitoncriticalsection |
174
|
| trap frame |
174
|
| дамп памяти |
173
|
| getcontextstate failed, 0×80070026 |
171
|
| windows crash dump analysis |
170
|
| windbg analyze |
168
|
| system_service_exception |
167
|
| frame pointer omission |
161
|
| minidump analyzer |
156
|
| obfreferenceobject |
155
|
| “this book fills the gap in children’s literature and introduces binary arithmetic to babies” |
154
|
| life cycle of a beetle |
152
|
| string theory |
148
|
| отладка windows dump |
143
|
| application_hang_blockedon_fileio |
142
|
| bugcheck 7e |
139
|
| image dump analysis visual studio |
139
|
| ntdll.dll!kifastsystemcallret |
138
|
| windbg cheat sheet |
138
|
| msmapi32.dll!fopenthreadimpersonationtoken |
130
|
| windbg debugging using vmware mac osx |
128
|
| download adplus |
127
|
| memory worldview |
127
|
| waitformultiple windbg???? |
127
|
| rtlplowfragheapfree |
125
|
| application_hang_busyhang |
124
|
| symbol file could not be found. defaulted to export symbols for fltmgr.sys |
121
|
| error: symbol file could not be found. defaulted to export symbols for ntkrnlmp.exe |
120
|
| unwindandcontinuerethrowhelperaftercatch |
120
|
| анализ дампа памяти ядра |
120
|
| bugcheck analysis |
118
|
| ntdll dbgbreakpoint |
117
|
| error: symbol file could not be found. |
116
|
| windows debugging: practical foundations |
116
|
| !cs windbg |
113
|
| bios disassembly ninjutsu uncovered |
112
|
| kipagefault |
110
|
| pool_corruption |
110
|
| windbg symbol file could not be found |
109
|
| crash dump analysis windbg |
108
|
| linux crash dump analysis |
105
|
| warning: stack unwind information not available. following frames may be wrong. |
104
|
| zwwaitforworkviaworkerfactory |
104
|
| failure_bucket_id |
103
|
| system_thread_exception_not_handled (7e) |
103
|
| the stored exception information can be accessed via .ecxr. |
103
|
| анализ дампов памяти |
103
|
| dump crash |
101
|
| ldrpsnapthunk |
101
|
| the stored exception information can be accessed via .ecxr |
101
|
| windbg !locks |
100
|
| windbg gs:[58h] |
100
|
Special thanks to more 1,000 web sites that mention the portal and this blog with the first top 100:
| Source/Medium |
Visits
|
| google |
152,133
|
| (direct) / (none) |
34,419
|
| bing |
6,847
|
| windbg.org |
5,106
|
| google.com |
4,904
|
| google.co.in |
2,576
|
| stackoverflow.com |
1,713
|
| yandex |
1,614
|
| dumpanalysis.com |
1,577
|
| twitter.com |
1,229
|
| baike.baidu.com |
1,165
|
| yahoo |
1,157
|
| t.co |
709
|
| blogs.msdn.com |
665
|
| google.co.uk |
609
|
| dumpanalysis.org |
574
|
| baidu |
560
|
| facebook.com |
558
|
| google.de |
502
|
| winvistaclub.com |
442
|
| naver |
419
|
| google.ca |
394
|
| search |
373
|
| linkedin.com |
356
|
| google.ru |
311
|
| google.com.au |
296
|
| citrixblogger.org |
277
|
| en.wikipedia.org |
257
|
| reconstructer.org |
256
|
| analyze-v.com |
252
|
| debuggingexperts.com |
250
|
| itdatabase.com |
250
|
| windbg.dumpanalysis.org |
230
|
| advancedwindowsdebugging.com |
226
|
| nynaeve.net |
225
|
| google.com.br |
209
|
| blog.miniasp.com |
208
|
| google.fr |
200
|
| google.it |
181
|
| google.com.hk |
180
|
| advanceddotnetdebugging.com |
172
|
| blogs.microsoft.co.il |
171
|
| community.citrix.com |
166
|
| google.co.kr |
165
|
| google.es |
152
|
| social.technet.microsoft.com |
149
|
| google.pl |
142
|
| google.nl |
140
|
| google.com.ua |
136
|
| serverfault.com |
125
|
| google.com.tw |
123
|
| google.com.tr |
118
|
| bytetalk.net |
114
|
| google.co.jp |
107
|
| forum.sysinternals.com |
105
|
| blog.naver.com |
104
|
| google.be |
98
|
| reddit.com |
97
|
| google.com.sg |
95
|
| google.co.il |
93
|
| google.ch |
91
|
| jasonhaley.com |
87
|
| netfxharmonics.com |
87
|
| google.ie |
83
|
| support.citrix.com |
83
|
| advdbg.org |
81
|
| google.se |
80
|
| google.com.pk |
77
|
| saygoodnight.com |
76
|
| google.ro |
75
|
| blogs.technet.com |
74
|
| news.ycombinator.com |
74
|
| google.co.za |
73
|
| driverentry.com.br |
72
|
| google.co.nz |
69
|
| google.cz |
68
|
| admin.itdatabase.com |
66
|
| codemachine.com |
66
|
| rambler |
66
|
| ask |
63
|
| dotnettips.info |
63
|
| google.at |
63
|
| pchelpforum.com |
63
|
| techspot.com |
62
|
| google.com.my |
61
|
| images.google |
61
|
| my.safaribooksonline.com |
60
|
| opentask.com |
60
|
| voneinem-windbg.blogspot.com |
60
|
| google.com.ph |
58
|
| google.no |
55
|
| google.gr |
54
|
| ja.iphone.luna.tv |
53
|
| kaixin001.com |
53
|
| aol |
52
|
| google.co.id |
52
|
| networksteve.com |
52
|
| caloni.com.br |
51
|
| google.com.ar |
51
|
- Dmitry Vostokov @ DumpAnalysis.org + TraceAnalysis.org -
Posted in Announcements, Crash Dump Analysis, Debugging, DumpAnalysis.org Statistics, History, Software Trace Analysis | No Comments »
Tuesday, January 3rd, 2012
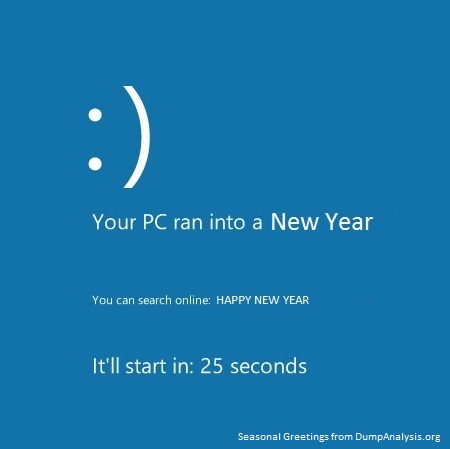
This is a seasonal greetings postcard with Windows 8 bluescreen theme:
- Dmitry Vostokov @ DumpAnalysis.org + TraceAnalysis.org -
Posted in Announcements, Art, Fun with Crash Dumps, Physicalist Art, Windows 8 | No Comments »
Saturday, December 24th, 2011
I created a special picture based on CPU and memory timing diagram (an optimistic version of the original computicart):
- Dmitry Vostokov @ DumpAnalysis.org + TraceAnalysis.org -
Posted in Announcements, Art, Computicart (Computical Art), Debugging, Fun with Software Traces, Software Trace Analysis | No Comments »
Monday, December 19th, 2011
150 bugtations so far…
Program history has two sides, a computational and a human.
Philip Schaff
- Dmitry Vostokov @ DumpAnalysis.org + TraceAnalysis.org -
Posted in Announcements, Bugtations, Crash Dump Analysis, Debugging, Fun with Crash Dumps, Fun with Debugging, Fun with Software Traces, History, Memory Dump Analysis and History, Software Trace Analysis, Software Trace Analysis and History | No Comments »
Sunday, December 18th, 2011
This is the first initiative for the year of software trace analysis: the first and unique software trace and log analysis training based entirely on patterns of software behavior. No longer you will be frustrated when opening a software trace with millions of messages from hundreds of software components, threads and processes.
Memory Dump Analysis Services (DumpAnalysis.com) organizes a training course:
Learn how to efficiently and effectively analyze software traces and logs from complex software environments. Covered popular software logs and trace formats from Microsoft and Citrix products and tools including Event Tracing for Windows (ETW) and Citrix Common Diagnostics Format (CDF). Learn how to use pioneering and innovative pattern-driven software problem behavior analysis to troubleshoot and debug software incidents.
If your are registered you are allowed to optionally submit your software traces and logs before the training. This will allow us in addition to the carefully constructed problems tailor additional examples to the needs of the attendees.
The training consists of 2 two-hour sessions and additional homework exercises. When you finish the training you additionally get:
- A full transcript in PDF format (retail price $200)
- 6 volumes of Memory Dump Analysis Anthology in PDF format (retail price $120)
- A personalized attendance certificate with unique CID (PDF format)
- Free Dump Analysis World Network membership including updates to full PDF transcript Q&A section
Prerequisites: Basic Windows troubleshooting.
Audience: Software technical support and escalation engineers, software maintenance engineers, system administrators.
Session 1: October 12, 2012 4:00 PM - 6:00 PM BST
Session 2: October 15, 2012 4:00 PM - 6:00 PM BST
Price: 210 USD
Space is limited.
Reserve your remote training seat now at:
https://student.gototraining.com/r/5287623225237732608

- Dmitry Vostokov @ DumpAnalysis.org + TraceAnalysis.org -
Posted in Announcements, CDF Analysis Tips and Tricks, Debugging, Software Technical Support, Software Trace Analysis, Software Trace Reading, Tools, Trace Analysis Patterns, Training and Seminars, Troubleshooting Methodology, Windows System Administration | No Comments »
Saturday, December 17th, 2011
The number of software trace analysis patterns approaches the critical mass of 50 and we have decided to focus on software tracing and logging in the forthcoming year. Some books on tracing including Volume 7 of Memory Dump Analysis Anthology will be published by OpenTask during that year and our efforts will be to further advance software narratology, software trace linguistics, and software trace analysis in the context of memory dump analysis, generative debugging and modeling software behavior.
- Dmitry Vostokov @ DumpAnalysis.org + TraceAnalysis.org -
Posted in Announcements, CDF Analysis Tips and Tricks, Debugging, Generative Debugging, Memoretics, Science of Software Tracing, Software Behavior DNA, Software Behavior Patterns, Software Behavioral Genome, Software Narratology, Software Trace Analysis, Software Trace Analysis and History, Software Trace Deconstruction, Software Trace Linguistics, Software Trace Reading, Software Trace Visualization, Software Tracing Implementation Patterns, Software Tracing for Dummies, Trace Analysis Patterns | No Comments »
Monday, December 12th, 2011
This is a specially commissioned artwork for the first celebration of Memoristmas. Those in the know will instantly recognize processor timing diagram:
- Dmitry Vostokov @ DumpAnalysis.org + TraceAnalysis.org -
Posted in Announcements, Art, Computicart (Computical Art), Memory Analysis Culture, Memory Celebrations | No Comments »
Monday, December 12th, 2011
More than 4 years passed since I provided a longer structuralist definition. Recently I came to recognize a pattern-driven iterative and incremental nature of memory and software trace analysis and post-construction software problem solving in general and therefore a one sentence definition became necessary:
“Recognition and interpretation of patterns of software behavior”
- Dmitry Vostokov @ DumpAnalysis.org + TraceAnalysis.org -
Posted in Announcements, Crash Dump Analysis, Crash Dump Patterns, Malware Analysis, Malware Patterns, Memiotics (Memory Semiotics), Memoretics, Memory Analysis Forensics and Intelligence, Science of Memory Dump Analysis, Science of Software Tracing, Software Behavior Patterns, Software Narratology, Software Problem Solving, Software Trace Analysis, Structural Memory Patterns, Structural Trace Patterns, Trace Analysis Patterns, Victimware | No Comments »
Monday, December 12th, 2011
This is an annual celebration at the overflow boundary 31 - 32 [1] (December - January). Its date is kept coincidental with The New Year to allow backward and legacy compatibility. It is an official celebration in memory religion, Memorianity, but it is also an open one and not particularly tied to it similar to other religious celebrations that became secular holidays. A series of special artistic images and pictures have been commissioned for the first Memoristmas, so stay tuned (listen to memory for news). If you are curious about etymology of this new word please take a note that -mas suffix denotes memory analysis service.
Dmitry Vostokov,
Memoriarch
- Dmitry Vostokov @ DumpAnalysis.org + TraceAnalysis.org -
Posted in Announcements, Memory Celebrations, Memory Holidays, Memory Religion (Memorianity), New Words, Religion | No Comments »
Monday, December 5th, 2011
On the portal I published my vision of software tools as a service in the context of post-construction software problem solving. The main part is software problem description language (SPDL) which was previously introduced as Riemann programming language. I have decided to keep the name.
- Dmitry Vostokov @ DumpAnalysis.org + TraceAnalysis.org -
Posted in Announcements, Debugging, Debugging Methodology, Riemann Programming Language, SPDL, Software Problem Solving, Software Technical Support, TaaS, Tool Objects, Tools | No Comments »
Saturday, December 3rd, 2011
If not for you then definitely for me because I now diagnose Spiking Thread pattern much faster. One of the readers if this blog asked me whether there is !runaway command equivalent for kernel and complete memory dumps. So, after some thinking I gave it a try especially in the context of WinDbg scripting exercises designed for Advanced Windows Memory Dump Analysis training. As a result I wrote 2 scripts initially that you can try yourself. Their output here is taken from a complete memory dump I used for Fundamentals of Complete Crash and Hang Memory Dump Analysis presentation.
The first one dumps the most CPU consuming threads for user and kernel mode:
$$

$$ krunawaymost.wds

$$ Copyright (c) 2011 Memory Dump Analysis Services

$$ GNU GENERAL PUBLIC LICENSE

$$ http://www.gnu.org/licenses/gpl-3.0.txt

$$

r $t0 = 0

!for_each_thread “r $t1 = dwo( @#Thread + @@c++(#FIELD_OFFSET(nt!_KTHREAD, UserTime)) ); .if (@$t1 > @$t0) {r $t0 = @$t1; r $t2 = @#Thread}”

.echo “The largest UserTime value: ”

? @$t0

!thread @$t2 ff

r $t0 = 0

!for_each_thread “r $t1 = dwo( @#Thread + @@c++(#FIELD_OFFSET(nt!_KTHREAD, KernelTime)) ); .if (@$t1 > @$t0) {r $t0 = @$t1; r $t2 = @#Thread}”

.echo “The largest KernelTime value: ”

? @$t0

!thread @$t2 ff
0: kd> $$><c:\Scripts\krunawaymost.wds

The largest UserTime value:

Evaluate expression: 5470 = 00000000`0000155e

THREAD fffffa800451d720  Cid 1418.17fc  Teb: 000007fffffdc000 Win32Thread: 0000000000000000 RUNNING on processor 2

Not impersonating

DeviceMap                 fffff8a001ce6b90

Owning Process            fffffa800442ab30       Image:         ApplicationE.exe

Attached Process          N/A            Image:         N/A

Wait Start TickCount      22295          Ticks: 0

Context Switch Count      27960

UserTime                  00:01:25.332

KernelTime                00:00:00.015

*** ERROR: Module load completed but symbols could not be loaded for ApplicationE.exe

Win32 Start Address ApplicationE (0×000000013f0f1578)

Stack Init fffff8800723cc70 Current fffff8800723c960

Base fffff8800723d000 Limit fffff88007237000 Call 0

Priority 8 BasePriority 8 UnusualBoost 0 ForegroundBoost 0 IoPriority 2 PagePriority 5

Child-SP          RetAddr           Call Site

00000000`0021f9e0 00000000`00000000 ApplicationE+0×6cd3
The largest KernelTime value:

Evaluate expression: 187 = 00000000`000000bb

THREAD fffffa80098d7b60  Cid 07bc.0a14  Teb: 000007fffffd7000 Win32Thread: fffff900c2ca0c20 WAIT: (UserRequest) KernelMode Non-Alertable

    fffffa8008a4a030  NotificationEvent

Not impersonating

DeviceMap                 fffff8a001ce6b90

Owning Process            fffffa80096beb30       Image:         dwm.exe

Attached Process          N/A            Image:         N/A

Wait Start TickCount      22294          Ticks: 1 (0:00:00:00.015)

Context Switch Count      15473                 LargeStack

UserTime                  00:00:06.801

KernelTime                00:00:02.917

Win32 Start Address dwmcore!CPartitionThread::ThreadMain (0×000007fef8a1f0d8)

Stack Init fffff8800d3d5c70 Current fffff8800d3d5740

Base fffff8800d3d6000 Limit fffff8800d3cf000 Call 0

Priority 15 BasePriority 15 UnusualBoost 0 ForegroundBoost 0 IoPriority 2 PagePriority 5

Child-SP          RetAddr           Call Site

fffff880`0d3d5780 fffff800`02ee6f32 nt!KiSwapContext+0×7a

fffff880`0d3d58c0 fffff800`02ee974f nt!KiCommitThreadWait+0×1d2

fffff880`0d3d5950 fffff880`0fef65b3 nt!KeWaitForSingleObject+0×19f

fffff880`0d3d59f0 fffff960`001fedea dxgkrnl!DxgkWaitForVerticalBlankEvent+0×53f

fffff880`0d3d5ab0 fffff800`02ee0ed3 win32k!NtGdiDdDDIWaitForVerticalBlankEvent+0×12

fffff880`0d3d5ae0 000007fe`ff1d143a nt!KiSystemServiceCopyEnd+0×13 (TrapFrame @ fffff880`0d3d5ae0)

00000000`0287f778 000007fe`f8791da1 GDI32!NtGdiDdDDIWaitForVerticalBlankEvent+0xa

00000000`0287f780 000007fe`f89e1b6e dxgi!CDXGIOutput::WaitForVBlank+0×51

00000000`0287f7c0 000007fe`f89e1ae9 dwmcore!CD3DDeviceLevel1::WaitForVBlank+0×1f9

00000000`0287f810 000007fe`f89e1a9d dwmcore!CHwDisplayRenderTarget::WaitForVBlank+0×39

00000000`0287f850 000007fe`f89e1a4c dwmcore!CDesktopRenderTarget::WaitForVBlank+0×40

00000000`0287f880 000007fe`f89d3513 dwmcore!CSlaveHWndRenderTarget::WaitForVBlank+0×2c

00000000`0287f8c0 000007fe`f89d3584 dwmcore!CRenderTargetManager::WaitForVBlank+0×7d

00000000`0287f900 000007fe`f89d2661 dwmcore!CPartitionVerticalBlankScheduler::WaitForVBlank+0×7c

00000000`0287f950 000007fe`f8a1f0f4 dwmcore!CPartitionVerticalBlankScheduler::Run+0xe5

00000000`0287f9b0 00000000`7719652d dwmcore!CPartitionThread::ThreadMain+0×1c

00000000`0287f9e0 00000000`772cc521 kernel32!BaseThreadInitThunk+0xd

00000000`0287fa10 00000000`00000000 ntdll!RtlUserThreadStart+0×1d
The second script takes two arguments and shows all threads that have UserTime and KernelTime ticks value greater than (you can have the idea of the maximum from the previous script):
$$

$$ krunawaygt.wds

$$ Copyright (c) 2011 Memory Dump Analysis Services

$$ GNU GENERAL PUBLIC LICENSE

$$ http://www.gnu.org/licenses/gpl-3.0.txt

$$

!for_each_thread “r $t1 = dwo( @#Thread + @@c++(#FIELD_OFFSET(nt!_KTHREAD, UserTime)) ); r $t0 = $arg1; .if (@$t1 > @$t0) {!thread @#Thread ff}”

!for_each_thread “r $t1 = dwo( @#Thread + @@c++(#FIELD_OFFSET(nt!_KTHREAD, KernelTime)) ); r $t0 = $arg2; .if (@$t1 > @$t0) {!thread @#Thread ff}”
Using hints from the previous script run (the largest UserTime ticks value is 0×155e) we now get threads that spent more than 0×100 ticks in user mode:
0: kd> $$>a<c:\Scripts\krunawaygt.wds 100 100

THREAD fffffa800843e060  Cid 03f4.0658  Teb: 000007fffff90000 Win32Thread: 0000000000000000 WAIT: (WrQueue) UserMode Non-Alertable

    fffffa800843c2c0  QueueObject

Not impersonating

DeviceMap                 fffff8a000008aa0

Owning Process            fffffa800916b060       Image:         MsMpEng.exe

Attached Process          N/A            Image:         N/A

Wait Start TickCount      21211          Ticks: 1084 (0:00:00:16.910)

Context Switch Count      6028

UserTime                  00:00:10.140

KernelTime                00:00:00.296

Win32 Start Address msvcrt!endthreadex (0×000007feff5173fc)

Stack Init fffff88009d4bc70 Current fffff88009d4b660

Base fffff88009d4c000 Limit fffff88009d46000 Call 0

Priority 9 BasePriority 8 UnusualBoost 0 ForegroundBoost 0 IoPriority 2 PagePriority 5

*** ERROR: Symbol file could not be found.  Defaulted to export symbols for mprtp.dll -

Child-SP          RetAddr           Call Site

fffff880`09d4b6a0 fffff800`02ee6f32 nt!KiSwapContext+0×7a

fffff880`09d4b7e0 fffff800`02ee9f93 nt!KiCommitThreadWait+0×1d2

fffff880`09d4b870 fffff800`031ca647 nt!KeRemoveQueueEx+0×323

fffff880`09d4b930 fffff800`0319cae5 nt!IoRemoveIoCompletion+0×47

fffff880`09d4b9c0 fffff800`02ee0ed3 nt!NtRemoveIoCompletion+0×145

fffff880`09d4ba70 00000000`772f13aa nt!KiSystemServiceCopyEnd+0×13 (TrapFrame @ fffff880`09d4bae0)

00000000`0209fb08 000007fe`fd9e169d ntdll!ZwRemoveIoCompletion+0xa

00000000`0209fb10 00000000`7718a4e1 KERNELBASE!GetQueuedCompletionStatus+0×39

00000000`0209fb70 00000000`748f2c74 kernel32!GetQueuedCompletionStatusStub+0×11

00000000`0209fbb0 00000000`0045cbc0 mprtp!MpPluginSignatureChange+0×3e170

00000000`0209fbb8 000007fe`fbac25ff 0×45cbc0

00000000`0209fbc0 00000000`00466610 FLTLIB!FilterGetMessage+0×2b

00000000`0209fc20 00000000`00000000 0×466610
THREAD fffffa800845c060  Cid 03f4.065c  Teb: 000007fffff8e000 Win32Thread: 0000000000000000 WAIT: (WrQueue) UserMode Non-Alertable

    fffffa800843c2c0  QueueObject

Not impersonating

DeviceMap                 fffff8a000008aa0

Owning Process            fffffa800916b060       Image:         MsMpEng.exe

Attached Process          N/A            Image:         N/A

Wait Start TickCount      21520          Ticks: 775 (0:00:00:12.090)

Context Switch Count      4979

UserTime                  00:00:04.149

KernelTime                00:00:00.156

Win32 Start Address msvcrt!endthreadex (0×000007feff5173fc)

Stack Init fffff88009d52c70 Current fffff88009d52660

Base fffff88009d53000 Limit fffff88009d4d000 Call 0

Priority 8 BasePriority 8 UnusualBoost 0 ForegroundBoost 0 IoPriority 2 PagePriority 5

*** ERROR: Symbol file could not be found.  Defaulted to export symbols for mprtp.dll -

Child-SP          RetAddr           Call Site

fffff880`09d526a0 fffff800`02ee6f32 nt!KiSwapContext+0×7a

fffff880`09d527e0 fffff800`02ee9f93 nt!KiCommitThreadWait+0×1d2

fffff880`09d52870 fffff800`031ca647 nt!KeRemoveQueueEx+0×323

fffff880`09d52930 fffff800`0319cae5 nt!IoRemoveIoCompletion+0×47

fffff880`09d529c0 fffff800`02ee0ed3 nt!NtRemoveIoCompletion+0×145

fffff880`09d52a70 00000000`772f13aa nt!KiSystemServiceCopyEnd+0×13 (TrapFrame @ fffff880`09d52ae0)

00000000`01ccf498 000007fe`fd9e169d ntdll!ZwRemoveIoCompletion+0xa

00000000`01ccf4a0 00000000`7718a4e1 KERNELBASE!GetQueuedCompletionStatus+0×39

00000000`01ccf500 00000000`748f2c74 kernel32!GetQueuedCompletionStatusStub+0×11

00000000`01ccf540 00000000`0045d030 mprtp!MpPluginSignatureChange+0×3e170

00000000`01ccf548 000007fe`fbac25ff 0×45d030

00000000`01ccf550 00000000`004666b0 FLTLIB!FilterGetMessage+0×2b

00000000`01ccf5b0 00000000`00000000 0×4666b0
THREAD fffffa80092b7060  Cid 03f4.1268  Teb: 000007fffff6a000 Win32Thread: 0000000000000000 WAIT: (WrQueue) UserMode Alertable

    fffffa8009299140  QueueObject

Not impersonating

DeviceMap                 fffff8a000008aa0

Owning Process            fffffa800916b060       Image:         MsMpEng.exe

Attached Process          N/A            Image:         N/A

Wait Start TickCount      7762           Ticks: 14533 (0:00:03:46.716)

Context Switch Count      3297

UserTime                  00:00:06.489

KernelTime                00:00:00.499

Win32 Start Address ntdll!TppWorkerThread (0×00000000772bfbc0)

Stack Init fffff8800e620c70 Current fffff8800e620680

Base fffff8800e621000 Limit fffff8800e61b000 Call 0

Priority 8 BasePriority 8 UnusualBoost 0 ForegroundBoost 0 IoPriority 2 PagePriority 5

Child-SP          RetAddr           Call Site

fffff880`0e6206c0 fffff800`02ee6f32 nt!KiSwapContext+0×7a

fffff880`0e620800 fffff800`02ee9f93 nt!KiCommitThreadWait+0×1d2

fffff880`0e620890 fffff800`031ca647 nt!KeRemoveQueueEx+0×323

fffff880`0e620950 fffff800`02ecdb36 nt!IoRemoveIoCompletion+0×47

fffff880`0e6209e0 fffff800`02ee0ed3 nt!NtWaitForWorkViaWorkerFactory+0×285

fffff880`0e620ae0 00000000`772f2c1a nt!KiSystemServiceCopyEnd+0×13 (TrapFrame @ fffff880`0e620ae0)

00000000`0540f998 00000000`772bfe0b ntdll!ZwWaitForWorkViaWorkerFactory+0xa

00000000`0540f9a0 00000000`7719652d ntdll!TppWorkerThread+0×2c9

00000000`0540fca0 00000000`772cc521 kernel32!BaseThreadInitThunk+0xd

00000000`0540fcd0 00000000`00000000 ntdll!RtlUserThreadStart+0×1d
THREAD fffffa80098d7b60  Cid 07bc.0a14  Teb: 000007fffffd7000 Win32Thread: fffff900c2ca0c20 WAIT: (UserRequest) KernelMode Non-Alertable

    fffffa8008a4a030  NotificationEvent

Not impersonating

DeviceMap                 fffff8a001ce6b90

Owning Process            fffffa80096beb30       Image:         dwm.exe

Attached Process          N/A            Image:         N/A

Wait Start TickCount      22294          Ticks: 1 (0:00:00:00.015)

Context Switch Count      15473                 LargeStack

UserTime                  00:00:06.801

KernelTime                00:00:02.917

Win32 Start Address dwmcore!CPartitionThread::ThreadMain (0×000007fef8a1f0d8)

Stack Init fffff8800d3d5c70 Current fffff8800d3d5740

Base fffff8800d3d6000 Limit fffff8800d3cf000 Call 0

Priority 15 BasePriority 15 UnusualBoost 0 ForegroundBoost 0 IoPriority 2 PagePriority 5

Child-SP          RetAddr           Call Site

fffff880`0d3d5780 fffff800`02ee6f32 nt!KiSwapContext+0×7a

fffff880`0d3d58c0 fffff800`02ee974f nt!KiCommitThreadWait+0×1d2

fffff880`0d3d5950 fffff880`0fef65b3 nt!KeWaitForSingleObject+0×19f

fffff880`0d3d59f0 fffff960`001fedea dxgkrnl!DxgkWaitForVerticalBlankEvent+0×53f

fffff880`0d3d5ab0 fffff800`02ee0ed3 win32k!NtGdiDdDDIWaitForVerticalBlankEvent+0×12

fffff880`0d3d5ae0 000007fe`ff1d143a nt!KiSystemServiceCopyEnd+0×13 (TrapFrame @ fffff880`0d3d5ae0)

00000000`0287f778 000007fe`f8791da1 GDI32!NtGdiDdDDIWaitForVerticalBlankEvent+0xa

00000000`0287f780 000007fe`f89e1b6e dxgi!CDXGIOutput::WaitForVBlank+0×51

00000000`0287f7c0 000007fe`f89e1ae9 dwmcore!CD3DDeviceLevel1::WaitForVBlank+0×1f9

00000000`0287f810 000007fe`f89e1a9d dwmcore!CHwDisplayRenderTarget::WaitForVBlank+0×39

00000000`0287f850 000007fe`f89e1a4c dwmcore!CDesktopRenderTarget::WaitForVBlank+0×40

00000000`0287f880 000007fe`f89d3513 dwmcore!CSlaveHWndRenderTarget::WaitForVBlank+0×2c

00000000`0287f8c0 000007fe`f89d3584 dwmcore!CRenderTargetManager::WaitForVBlank+0×7d

00000000`0287f900 000007fe`f89d2661 dwmcore!CPartitionVerticalBlankScheduler::WaitForVBlank+0×7c

00000000`0287f950 000007fe`f8a1f0f4 dwmcore!CPartitionVerticalBlankScheduler::Run+0xe5

00000000`0287f9b0 00000000`7719652d dwmcore!CPartitionThread::ThreadMain+0×1c

00000000`0287f9e0 00000000`772cc521 kernel32!BaseThreadInitThunk+0xd

00000000`0287fa10 00000000`00000000 ntdll!RtlUserThreadStart+0×1d
THREAD fffffa800451d720  Cid 1418.17fc  Teb: 000007fffffdc000 Win32Thread: 0000000000000000 RUNNING on processor 2

Not impersonating

DeviceMap                 fffff8a001ce6b90

Owning Process            fffffa800442ab30       Image:         ApplicationE.exe

Attached Process          N/A            Image:         N/A

Wait Start TickCount      22295          Ticks: 0

Context Switch Count      27960

UserTime                  00:01:25.332

KernelTime                00:00:00.015

*** ERROR: Module load completed but symbols could not be loaded for ApplicationE.exe

Win32 Start Address ApplicationE (0×000000013f0f1578)

Stack Init fffff8800723cc70 Current fffff8800723c960

Base fffff8800723d000 Limit fffff88007237000 Call 0

Priority 8 BasePriority 8 UnusualBoost 0 ForegroundBoost 0 IoPriority 2 PagePriority 5

Child-SP          RetAddr           Call Site

00000000`0021f9e0 00000000`00000000 ApplicationE+0×6cd3
Memory Dump Analysis Services is now working to incorporate client-side WinDbg scripting into their CARE2 architecture.
- Dmitry Vostokov @ DumpAnalysis.org + TraceAnalysis.org -
Posted in Announcements, Complete Memory Dump Analysis, Crash Analysis Report Environment (CARE), Crash Dump Analysis, Crash Dump Patterns, Debugging, Memory Dump Analysis Services, Training and Seminars, WinDbg Scripts, WinDbg Tips and Tricks, x64 Windows | No Comments »
Monday, November 14th, 2011
This is a new exiting book project I’m working on now scheduled for release in 2012 with ISBN 978-1908043337. If your company would like to have its programs considered for inclusion please let me know and send a copy just in case I would need to include screenshots. I’ll update about this project soon.
Posted in Announcements, Books, Software and History | No Comments »
Sunday, November 13th, 2011
During the previous several months some companies and individuals expressed their interest in the training (the next one is scheduled for January) but its time was not suitable due to different geographic time zones. So I have decided to publish this training in a book format (currently in PDF) and make it available in paperback on Amazon and B&N later. Book details:
- Title: Accelerated .NET Memory Dump Analysis: Training Course Transcript and WinDbg Practice Exercises with Notes
- Description: The full transcript of Memory Dump Analysis Services Training with 7 step-by-step exercises, notes, source code of specially created modeling applications and selected Q&A. Covers 20 .NET memory dump analysis patterns plus additional unmanaged patterns.
- Authors: Dmitry Vostokov, Memory Dump Analysis Services
- Publisher: OpenTask (November 2011)
- Language: English
- Product Dimensions: 28.0 x 21.6
- Paperback: 204 pages
- ISBN-13: 978-1908043320
Table of Contents
Now available for sale in PDF format from Memory Dump Analysis Services.
- Dmitry Vostokov @ DumpAnalysis.org + TraceAnalysis.org -
Posted in .NET Debugging, Announcements, Books, Crash Dump Analysis, Crash Dump Patterns, Debugging, Escalation Engineering, Medicine, Memory Dump Analysis Services, Publishing, Software Engineering, Software Technical Support, Testing, Tools, Training and Seminars, WinDbg Tips and Tricks | No Comments »
Friday, November 11th, 2011
This is a second long-term initiative for 2012 to design and develop memory-oriented operating system where memory is the foundation of the whole architecture from the ground up. More on this later as the announcement date and time memory pattern 11-11-11 11:11 is quickly approaching 
- Dmitry Vostokov @ DumpAnalysis.org + TraceAnalysis.org -
Posted in Announcements, Computer Science, Memory OS, Software Architecture | 1 Comment »
Friday, November 11th, 2011
One of the new initiatives for 2012 is the development of SPDL (Software Problem Description Language). Its purpose is automatic generation of a software troubleshooting tool(s) based on the description of a problem. Here software problem means a post-construction problem as outlined in Introduction to Pattern-Driven Software Problem Solving. The tool construction will utilize an expanded set of DebugWare and Workaround patterns together with the refind version of RADII software development process. This will also provide necessary effectiveness, efficiency and enhanced problem solving capabilities to existing TaaS (Tools as a Service) implementations that are limited in the number of tools they offer.
- Dmitry Vostokov @ DumpAnalysis.org + TraceAnalysis.org -
Posted in Announcements, Computer Science, Crash Dump Analysis, DebugWare Patterns, Debugging, Generative Debugging, New Acronyms, New Debugging School, SPDL, Software Behavior DNA, Software Behavior Patterns, Software Behavioral Genome, Software Engineering, Software Problem Solving, Software Technical Support, Software Trace Analysis, Software Troubleshooting Patterns, Software and Modeling, TaaS, Testing, Tool Objects, Tools, Troubleshooting Methodology, Unified Debugging Patterns, Windows System Administration | No Comments »
Thursday, November 3rd, 2011
The new 6th volume contains revised, edited, cross-referenced, and thematically organized selected DumpAnalysis.org blog posts about memory dump and software trace analysis, software troubleshooting and debugging written in November 2010 - October 2011 for software engineers developing and maintaining products on Windows platforms, quality assurance engineers testing software on Windows platforms, technical support and escalation engineers dealing with complex software issues, and security researchers, malware analysts and reverse engineers. The sixth volume features:
- 56 new crash dump analysis patterns including 14 new .NET memory dump analysis patterns
- 4 new pattern interaction case studies
- 11 new trace analysis patterns
- New Debugware pattern
- Introduction to UI problem analysis patterns
- Introduction to intelligence analysis patterns
- Introduction to unified debugging pattern language
- Introduction to generative debugging, metadefect template library and DNA of software behaviour
- The new school of debugging and trends
- .NET memory dump analysis checklist
- Software trace analysis checklist
- Introduction to close and deconstructive readings of a software trace
- Memory dump analysis compass
- Computical and Stack Trace Art
- The abductive reasoning of Philip Marlowe
- Orbifold memory space and cloud computing
- Memory worldview
- Interpretation of cyberspace
- Relationship of memory dumps to religion
- Fully cross-referenced with Volume 1, Volume 2, Volume 3, Volume 4, and Volume 5
Product information:
- Title: Memory Dump Analysis Anthology, Volume 6
- Author: Dmitry Vostokov
- Language: English
- Product Dimensions: 22.86 x 15.24
- Paperback: 300 pages
- Publisher: Opentask (December 2011)
- ISBN-13: 978-1-908043-19-1
- Hardcover: 300 pages
- Publisher: Opentask (January 2012)
- ISBN-13: 978-1-908043-20-7

Back cover features 3d memory space visualization image created with ParaView.
- Dmitry Vostokov @ DumpAnalysis.org + TraceAnalysis.org -
Posted in .NET Debugging, Announcements, Art, Books, Cloud Computing, Cloud Memory Dump Analysis, Common Mistakes, Complete Memory Dump Analysis, Computer Science, Computicart (Computical Art), Crash Dump Analysis, Crash Dump Patterns, Cyber Intelligence, Cyber Problems, Cyber Security, Cyber Space, Cyber Warfare, DebugWare Patterns, Debugging, Debugging Industry, Debugging Methodology, Debugging Slang, Debugging Trends, Escalation Engineering, Generative Debugging, Intelligence Analysis Patterns, Kernel Development, Memoidealism, Memoretics, Memory Visualization, Metadefect Template Library, New Debugging School, Philosophy, Physicalist Art, Publishing, Root Cause Analysis, Science of Memory Dump Analysis, Science of Software Tracing, Security, Software Behavior DNA, Software Behavior Patterns, Software Behavioral Genome, Software Engineering, Software Narratology, Software Technical Support, Software Trace Analysis, Software Trace Deconstruction, Software Trace Reading, Software Victimology, Testing, The Way of Philip Marlowe, Tools, Trace Analysis Patterns, Training and Seminars, Troubleshooting Methodology, UI Problem Analysis Patterns, Unified Debugging Patterns, Victimware, WinDbg Tips and Tricks, Windows 7, Windows Azure, Windows Data Structures, Windows Server 2008, Windows System Administration, x64 Windows | No Comments »
Sunday, October 16th, 2011
switch(years_at_citrix)

{

  case 5:

  write_blog_post(”I’ve just passed 5 year mark … “);

  wait_for_certificate();

  write_blog_post(”Shortly after celebrating 5 years … “);

  break;

  case 6:

  write_blog_post(”Threads in my process run very fast. Not long ago … “);

  break;

  case 7:

  write_blog_post(”Transition to kernel mode and space … “);

  break;

  case 8:

  write_blog_posts(”A byte has passed”, “8 bits of Citrix”, … “);

  break;

  case 9:

  // … TBD
}
No default case label in the code yet.
- Dmitry Vostokov @ DumpAnalysis.org + TraceAnalysis.org -
Posted in Announcements, Citrix, Crash Dump Analysis, Debugging, History, Software Technical Support, Software Trace Analysis | 3 Comments »
Friday, October 7th, 2011
After the launch of the first episode about symbols I decided to make it recurrent where registration will be needed only once. So I apologize to all who already registered for episode 0×01 that another registration well be required for episode 0×02. However, no registration will be necessary for episode 0×03 and so on. If anyone misses episode 0×02 they can still register for episode 0×03 and all subsequent episodes only once, and so on by induction.
The second episode is about symbol file troubleshooting. All about this topic in 8 slides in 8 minutes including live WinDbg demonstration plus extra 8 minutes for you to ask questions.
Register for Debugging TV Frame 0×02 and further weekly episodes
Date: Friday, October 14, 2011
Time: 5:45 PM - 6:01 PM BST
Space is limited.
Reserve your seat now at:
https://www3.gotomeeting.com/register/318613774
After registering you will receive a confirmation email containing information about joining the show.
Debugging TV Frame 0×01
Recording: https://www3.gotomeeting.com/register/640694470
Slides: DebuggingTV_Frame_0×01.pdf
WinDbg log: DebuggingTV_Frame_0×01.txt
More frames are coming and www.debugging.tv will host TV programme and recordings of past episodes.
- Dmitry Vostokov @ DumpAnalysis.org + TraceAnalysis.org -
Posted in Announcements, Crash Dump Analysis, Debugging, Debugging TV, Memory Dump Analysis Services, Training and Seminars, Webinars, WinDbg Tips and Tricks | No Comments »
Tuesday, October 4th, 2011
First, we announced Debugging TV and its first weekly program called Frames where each episode features some facet of debugging, memory dump, and software trace analysis in 8 minutes. The first episode is about symbol files plus extra 8 minutes to ask questions.

Debugging TV Frame 0×01
Date: Friday, October 7, 2011
Time: 5:45 PM - 6:01 PM BST
Space is limited.
Reserve your seat now at:
https://www3.gotomeeting.com/register/640694470
Second, Accelerated Windows Memory Dump Analysis book became available on Amazon and Barnes & Noble.
Third, a recording of Fundamentals of Complete Crash and Hang Memory Dump Analysis (Revision 2) Webinar was made available for viewing.
Fourth, I’m working now on the next 5 crash dump analysis patterns to be published this week.
- Dmitry Vostokov @ DumpAnalysis.org + TraceAnalysis.org -
Posted in Announcements, Books, Crash Dump Analysis, Debugging, Debugging TV, Publishing, WinDbg Tips and Tricks | 2 Comments »
Monday, September 26th, 2011
Memoretics views Cyber Space as Memory Space + Memory Data. Here Memory Space consists of many different memory spaces. Although data is private property memory space where it is located is not:
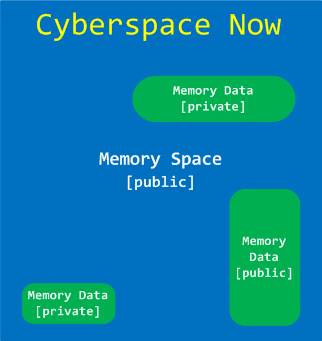
We propose private property on memory spaces and their partitions as a solution to various Cyber problems such as Cyber Crime and Cyber War:
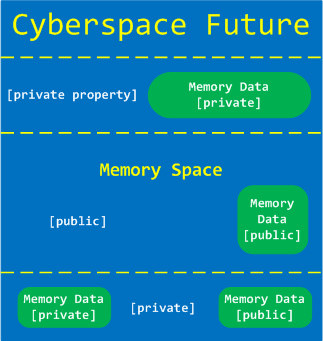
- Dmitry Vostokov @ DumpAnalysis.org + TraceAnalysis.org -
Posted in Announcements, Cyber Intelligence, Cyber Problems, Cyber Security, Cyber Space, Cyber Warfare, Memory Analysis Forensics and Intelligence, Security | No Comments »