Archive for the ‘Announcements’ Category
Saturday, September 17th, 2011
Whereas DNA of a ruptured computation is a coarse grained, software behavioral genome in general is fine grained consisting of multiple behavioral patterns such as seen in memory dumps and software traces. I will elaborate more on it later especially in relation to software behavior profiles. Here’s a nice “memory DNA” metaphorical picture from 3D memory visualization post:
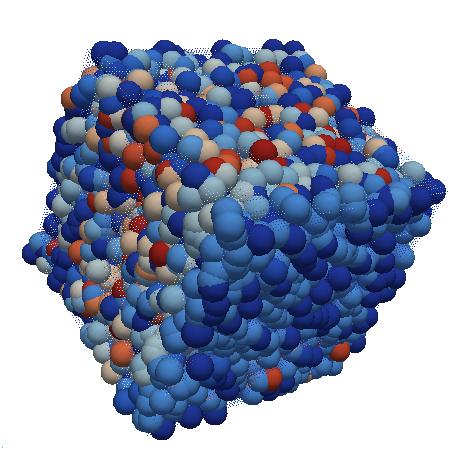
- Dmitry Vostokov @ DumpAnalysis.org + TraceAnalysis.org -
Posted in Announcements, Crash Dump Patterns, Memory Visualization, Software Behavior DNA, Software Behavior Patterns, Software Behavioral Genome, Trace Analysis Patterns | No Comments »
Monday, August 29th, 2011
This month marks 5 years of blogging that resulted in more than 2,500 posts across 8 blogs. I would like to thank everyone for their continuing support! The major milestones are marked on the updated timeline.
- Dmitry Vostokov @ DumpAnalysis.org + TraceAnalysis.org -
Posted in Announcements, DumpAnalysis.org Statistics, History, Statistics | 1 Comment »
Monday, August 15th, 2011
Memory Dump Analysis Services announces development of the first memory dump analysis certification and is looking for volunteers to participate in its beta program. Please visit its website for further details.
Source: http://www.dumpanalysis.com/anon-beta-exam-mda-bi-w
- Dmitry Vostokov @ DumpAnalysis.org + TraceAnalysis.org -
Posted in Announcements, Certification, Crash Dump Analysis, Crash Dump Patterns, Memory Dump Analysis Services | No Comments »
Sunday, August 14th, 2011
Due to the need to extend existing basic and intermediate Accelerated Windows Memory Dump Analysis training Memory Dump Analysis Services organises advanced training course. Here is the description and registration information:
Learn how to navigate through memory dump space and Windows data structures to troubleshoot and debug complex software incidents. We use a unique and innovative pattern-driven analysis approach to speed up the learning curve. The training consists of practical step-by-step exercises using WinDbg to diagnose structural and behavioral patterns in 32-bit and 64-bit process, kernel and complete memory dumps.

If you are registered you are allowed to optionally submit your memory dumps before the training. This will allow us in addition to the carefully constructed problems tailor extra examples to the needs of the attendees.
The training consists of one four-hour session and additional homework exercises. When you finish the training you additionally get:
- A full transcript in PDF format (retail price $200)
- 5 volumes of Memory Dump Analysis Anthology in PDF format (retail price $100)
- A personalized attendance certificate with unique CID (PDF format)
Prerequisites: Basic and intermediate level Windows memory dump analysis: ability to list processors, processes, threads, modules, apply symbols, walk through stack traces and raw stack data, diagnose patterns such as heap corruption, CPU spike, memory and handle leaks, access violation, stack overflow, critical section and resource wait chains and deadlocks. If you don’t feel comfortable with prerequisites then Accelerated Windows Memory Dump Analysis training is recommended to take (or purchase a corresponding book) before attending this course.
Audience: Software developers, software technical support and escalation engineers.
Session: December 9, 2011 4:00 PM - 8:00 PM GMT
Price: 210 USD
Space is limited.
Reserve your remote training seat now at:
https://student.gototraining.com/24s4l/register/3788047691824598784
- Dmitry Vostokov @ DumpAnalysis.org + TraceAnalysis.org -
Posted in Announcements, Complete Memory Dump Analysis, Crash Dump Analysis, Crash Dump Patterns, Debugging, Escalation Engineering, Kernel Development, Memory Dump Analysis Services, Multithreading, Reverse Engineering, Root Cause Analysis, Software Engineering, Software Technical Support, Structural Memory Patterns, Training and Seminars, Uses of UML, Vista, WinDbg Scripts, WinDbg Tips and Tricks, Windows 7, Windows Data Structures, Windows Server 2008, x64 Windows | No Comments »
Thursday, August 11th, 2011
Due to popular demand and the need to extend existing Accelerated Windows Memory Dump Analysis training Memory Dump Analysis Services organises the new training course. Here is the description and registration information:
Learn how to analyze .NET application and service crashes and freezes, navigate through memory dump space (managed and unmanaged code) and diagnose corruption, leaks, CPU spikes, blocked threads, deadlocks, wait chains, resource contention, and much more. We use a unique and innovative pattern-driven analysis approach to speed up the learning curve. The training consists of practical step-by-step exercises using WinDbg to diagnose patterns in 32-bit and 64-bit process memory dumps.

If you are registered you are allowed to optionally submit your memory dumps before the training. This will allow us in addition to the carefully constructed problems tailor extra examples to the needs of the attendees.
The training consists of one four-hour session and additional homework exercises. When you finish the training you additionally get:
- A full transcript in PDF format (retail price $200)
- 5 volumes of Memory Dump Analysis Anthology in PDF format (retail price $100)
- A personalized attendance certificate with unique CID (PDF format)
Prerequisites: Basic .NET programming and debugging.
Audience: Software developers, software technical support and escalation engineers.
Session: October 28, 2011 4:00 PM - 8:00 PM GMT
Price: 210 USD
Space is limited.
Reserve your remote training seat now at:
https://student.gototraining.com/24s4l/register/423991811034037760
- Dmitry Vostokov @ DumpAnalysis.org + TraceAnalysis.org -
Posted in .NET Debugging, Announcements, Cloud Memory Dump Analysis, Crash Dump Analysis, Crash Dump Patterns, Debugging, Escalation Engineering, Memory Dump Analysis Services, Multithreading, Software Engineering, Software Technical Support, Training and Seminars, Windows 7, Windows Azure, Windows Server 2008, x64 Windows | No Comments »
Sunday, August 7th, 2011
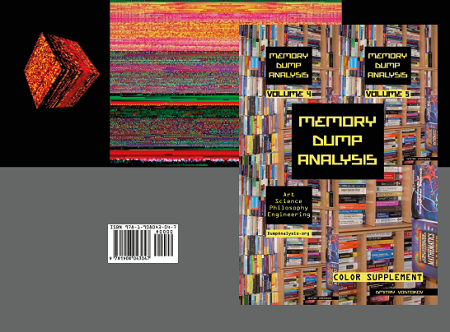
During the previous several months many people expressed their interest in the training (the next one is scheduled for November) but its time was not suitable due to the very different geographic time zones. So I have decided to publish this training in book format (currently in PDF) and make it available in paperback on Amazon and B&N later. Book details:
- Title: Accelerated Windows Memory Dump Analysis: Training Course Transcript and WinDbg Practice Exercises with Notes
- Description: The full transcript of Memory Dump Analysis Services Training with 21 step-by-step exercises, notes, source code of specially created modeling applications and selected Q&A. Covers about 50 crash dump analysis patterns from process, kernel and complete memory dumps.
- Authors: Dmitry Vostokov, Memory Dump Analysis Services
- Publisher: OpenTask (August 2011)
- Language: English
- Product Dimensions: 28.0 x 21.6
- Paperback: 360 pages
- ISBN-13: 978-1908043290

Table of Contents
Now available for sale in PDF format from Memory Dump Analysis Services.
- Dmitry Vostokov @ DumpAnalysis.org + TraceAnalysis.org -
Posted in Announcements, Books, Complete Memory Dump Analysis, Crash Dump Analysis, Crash Dump Patterns, Escalation Engineering, Memory Dump Analysis Services, Publishing, Software Technical Support, Testing, Tools, Training and Seminars, Vista, WinDbg Tips and Tricks, Windows 7, Windows Server 2008, Windows System Administration, x64 Windows | No Comments »
Saturday, August 6th, 2011
Due to popular demand (the previous training was fully booked) Memory Dump Analysis Services scheduled the next training sessions.
Learn how to analyze application, service and system crashes and freezes, navigate through memory dump space and diagnose heap corruption, memory leaks, CPU spikes, blocked threads, deadlocks, wait chains, and much more. We use a unique and innovative pattern-driven analysis approach to speed up the learning curve. The training consists of more than 20 practical step-by-step exercises using WinDbg highlighting more than 50 patterns diagnosed in 32-bit and 64-bit process, kernel and complete memory dumps.
Public preview (selected slides) of the previous training

Memory Dump Analysis Services organizes a training course.
If you are registered you are allowed to optionally submit your memory dumps before the training. This will allow us in addition to the carefully constructed problems tailor extra examples to the needs of the attendees.
The training consists of 4 two-hour sessions (2 hours every day). When you finish the training you additionally get:
- A full transcript in PDF format (retail price $200)
- 5 volumes of Memory Dump Analysis Anthology in PDF format (retail price $100)
- A personalized attendance certificate with unique CID (PDF format)
Prerequisites: Basic Windows troubleshooting
Session 1: November 1, 2011 4:00 PM - 6:00 PM GMT
Session 2: November 2, 2011 4:00 PM - 6:00 PM GMT
Session 3: November 3, 2011 4:00 PM - 6:00 PM GMT
Session 4: November 4, 2011 4:00 PM - 6:00 PM GMT
Price: 210 USD
Space is limited.
Reserve your remote training seat now.
If scheduled dates or time are not suitable for you Memory Dump Analysis Services offers the same training in book format.
Training testimonials:
I would like to thank you and recommend your training. I think that the “Accelerated Windows Memory Dump Analysis” training is a pin-point, well taught training. I think it’s the leading training in the dump analysis area and I’ve enjoyed it, the books and materials are very detailed and well written and Dmitry answered all of the needed question. In addition after the training Dmitry sent a PDF with written answers and more information about the questions that were asked. I will give this training 5/5. Thank you Dmitry.
Yaniv Miron, Security Researcher, IL.Hack
- Dmitry Vostokov @ DumpAnalysis.org + TraceAnalysis.org -
Posted in Announcements, Complete Memory Dump Analysis, Crash Dump Analysis, Crash Dump Patterns, Escalation Engineering, Memory Dump Analysis Services, Multithreading, Software Technical Support, Testing, Tools, Training and Seminars, Vista, WinDbg Tips and Tricks, Windows 7, Windows Server 2008, Windows System Administration, x64 Windows | No Comments »
Friday, July 22nd, 2011
I’m pleased to announce that I had a visitor from Vatican City (as reported by Google Analytics):
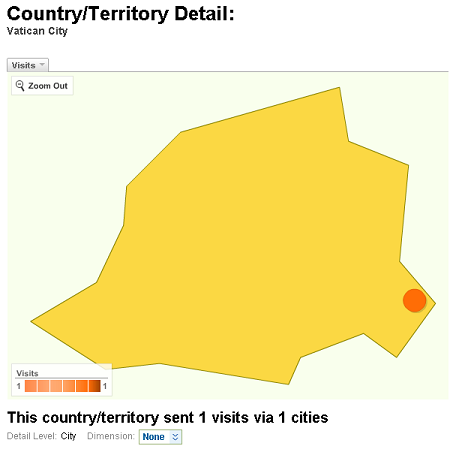
I hope they were interested in Memory Religion (Memorianity) where I have the title of Memoriarch.
- Dmitry Vostokov @ DumpAnalysis.org + TraceAnalysis.org -
Posted in Announcements, Intelligent Memory Movement, Memory Religion (Memorianity) | 2 Comments »
Thursday, July 14th, 2011
As a part of unified debugging pattern and generative debugging approach we extend software behavior analysis patterns such as memory dump and software trace analysis with UI abnormal behaviour patterns. Here by abnormality we mean behavior that users should not encounter while using software. Typical example is some error message or GUI distortion during execution of a functional use case. Such patterns will extend software behavior analysis pattern language we use for description of various post-construction software problems.
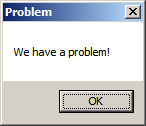
The first pattern we start with is called Error Message Box and we link it to Message Box and Self-Diagnosis memory analysis patterns. You can download x86 and x64 modeling examples from this location:
UIPMessageBox.zip
When we start the application it shows a message box:
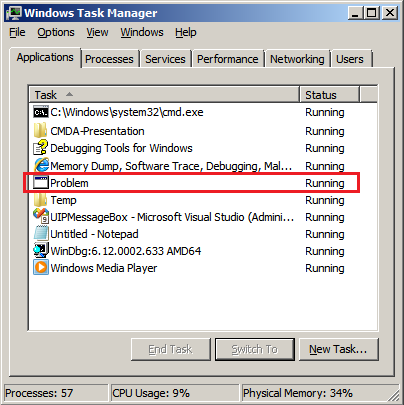
We then launch Task Manager and find the window:
Then we save a crash dump using right-click context menu:
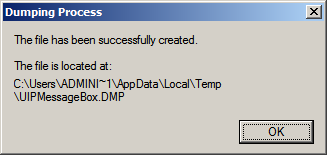
When we open the process memory dump we see this stack trace:
0:000> ~*kL
.  0  Id: d30.71c Suspend: 0 Teb: 000007ff`fffdd000 Unfrozen

Child-SP          RetAddr           Call Site

00000000`002ff1e8 00000000`77837214 user32!ZwUserWaitMessage+0xa

00000000`002ff1f0 00000000`778374a5 user32!DialogBox2+0x274

00000000`002ff280 00000000`778827f0 user32!InternalDialogBox+0x135

00000000`002ff2e0 00000000`77881ae5 user32!SoftModalMessageBox+0x9b4

00000000`002ff410 00000000`7788133b user32!MessageBoxWorker+0x31d

00000000`002ff5d0 00000000`77881232 user32!MessageBoxTimeoutW+0xb3

00000000`002ff6a0 00000001`3ffa101d user32!MessageBoxW+0×4e

00000000`002ff6e0 00000001`3ffa1039 UIPMessageBox!bar+0×1d

00000000`002ff710 00000001`3ffa1052 UIPMessageBox!foo+0×9

00000000`002ff740 00000001`3ffa11ea UIPMessageBox!wmain+0×12

00000000`002ff770 00000000`7770f56d UIPMessageBox!__tmainCRTStartup+0×15a

00000000`002ff7b0 00000000`77942cc1 kernel32!BaseThreadInitThunk+0xd

00000000`002ff7e0 00000000`00000000 ntdll!RtlUserThreadStart+0×1d
We see there that foo function called bar function which displayed the message box. In real scenarios function name could me more meaningful and give a clue for troubleshooting and debugging in addition to message text:
0:000> ub 00000001`3ffa101d

UIPMessageBox!__unguarded_readlc_active+0xfff:

00000001`3ffa0fff add     byte ptr [rax-7Dh],cl

00000001`3ffa1002 in      al,dx

00000001`3ffa1003 sub     byte ptr [rbp+33h],al

00000001`3ffa1006 leave

00000001`3ffa1007 lea     r8,[UIPMessageBox!__mnames+0×28 (00000001`3ffa83c8)]

00000001`3ffa100e lea     rdx,[UIPMessageBox!__mnames+0×38 (00000001`3ffa83d8)]

00000001`3ffa1015 xor     ecx,ecx

00000001`3ffa1017 call    qword ptr [UIPMessageBox!_imp_MessageBoxW (00000001`3ffa71d8)]
0:000> du 00000001`3ffa83c8

00000001`3ffa83c8  “Problem”
0:000> du 00000001`3ffa83d8

00000001`3ffa83d8  “We have a problem!”
- Dmitry Vostokov @ DumpAnalysis.org + TraceAnalysis.org -
Posted in Announcements, Crash Dump Analysis, Crash Dump Patterns, Debugging, Generative Debugging, Pattern Models, Software Behavior Patterns, UI Problem Analysis Patterns, Unified Debugging Patterns, x64 Windows | No Comments »
Wednesday, June 22nd, 2011
As the number of crash dump analysis pattern icons approaches 100 with software trace analysis patterns (and other troubleshooting and debugging pattern categories) on the horizon with every icon as a symbol signifying certain computer memory signs (computer memory semiotics is called memiotics, as a part of memoretics discipline) I found it necessary to name the new form of art. I decided upon the name Memioart. If you have a better name for it please let me know. I also plan to write commentaries on memioicons (semioicons) to explain elements on pattern icons and reasons why I chose them.
- Dmitry Vostokov @ DumpAnalysis.org + TraceAnalysis.org -
Posted in Announcements, Art, Memioart, Memiotics (Memory Semiotics), New Words, Pattern Icons | No Comments »
Thursday, June 16th, 2011
To generate crash dumps for my recent presentation The Old New Crash: Cloud Memory Dump Analysis I created the tool similar to TestWER. It is a .NET worker service role for Windows Azure that does a NULL pointer assignment. Here is a source code from WorkerRole.cs (I left EnableCollection twice just in case :-)):
using System;

using System.Collections.Generic;

using System.Diagnostics;

using System.Linq;

using System.Net;

using System.Threading;

using Microsoft.WindowsAzure;

using Microsoft.WindowsAzure.Diagnostics;

using Microsoft.WindowsAzure.ServiceRuntime;

using Microsoft.WindowsAzure.StorageClient;

using Microsoft.WindowsAzure.Diagnostics.Management;
namespace TestWAERWorker

{

public class WorkerRole : RoleEntryPoint

{

public override void Run()

{

Trace.WriteLine("TestWAERWorker entry point called", "Information");
Thread.Sleep(60000);
            unsafe

{

int* p = null;

*p = 1;

};
            while (true)

{

Thread.Sleep(10000);

Trace.WriteLine("Working", "Information");

}

}
        public override bool OnStart()

{

// Set the maximum number of concurrent connections

ServicePointManager.DefaultConnectionLimit = 12;
CrashDumps.EnableCollection(true);
            DiagnosticMonitorConfiguration config = DiagnosticMonitor.GetDefaultInitialConfiguration();

string conn_str = RoleEnvironment.GetConfigurationSettingValue("Microsoft.WindowsAzure.Plugins. Diagnostics.ConnectionString");

CloudStorageAccount account = CloudStorageAccount.Parse(conn_str);

config.Directories.ScheduledTransferPeriod = TimeSpan.FromMinutes(1);

DiagnosticMonitor diagnosticMonitor = DiagnosticMonitor.Start(account, config);
CrashDumps.EnableCollection(true);
            return base.OnStart();

}

}

}
The following forum discussion really helped me to get things right: http://stackoverflow.com/questions/5727692/azure-crash-dumps-not-appearing. So I’d like to thank Oliver Bock here.
If you want to deploy it to Windows Azure then don’t forget to add your storage account name and its key in the service configuration file. For your development environment you will need to replace the whole value with “UseDevelopmentStorage=true”. The full case study with detailed steps is forthcoming.
You can download the package from here: TestWAER.zip
- Dmitry Vostokov @ DumpAnalysis.org + TraceAnalysis.org -
Posted in .NET Debugging, Announcements, Cloud Memory Dump Analysis, Crash Dump Analysis, Debugging, Memory Dump Analysis Services, Presentations, Software Technical Support, Tools, Webinars, Windows Azure | No Comments »
Tuesday, June 7th, 2011
Committed to Cloud
I’ve been thinking for some time about a service that allows to ”Memory Dump It” easily. Finally my thoughts overflowed me and I memory dumped a solution (name)  Jokes apart, I’m deadly serious and the forthcoming service will allow everyone to memory dump their devices from any location and store memory dumps securely in a cloud.
- Dmitry Vostokov @ DumpAnalysis.org + TraceAnalysis.org -
Posted in Announcements, Cloud Memory Dump Analysis | No Comments »
Thursday, May 26th, 2011
A few years ago when searching for interdisciplinary ideas via metaphorical bijections I found many parallels between memory dump analysis and intelligence. At that time I started reading a book Intelligence Analysis: A Target-Centric Approach, 2nd Edition (currently in the 3rd edition
 ). Now looking at the cover of that book I think it might have later unconsciously influenced the picture of RADII process:


After some break with studying intelligence I now resume it after I found that tapping (trace analysis patterns for general memory traces with extra uncertainty attribute) could be a good basis for intelligence analysis patterns. My recent jump into cyber warfare also contributed to that. As a fictional continuation from MIx line (MI5, MI6 *) I feel the need to create MIA to promote such ideas (it is a well known fact that MI6 initially started as an amateurish organization **).
* MI5 and MI6 both look to me as pool tags GCHQ sounds like related to Garbage Collector
** Strategic Intelligence [5 volumes], Volume 1
- Dmitry Vostokov @ DumpAnalysis.org + TraceAnalysis.org -
Posted in Announcements, Cyber Warfare, Memory Analysis Forensics and Intelligence, Memory Intelligence Agency, Security, Software Trace Analysis | No Comments »
Saturday, May 21st, 2011
Posted in Announcements, Debugging, EasyDbg, Memory Analysis Forensics and Intelligence, New Acronyms, Software Trace Analysis, Software Trace Reading, Tool Objects, Tools, Trace Analysis Patterns | No Comments »
Sunday, May 15th, 2011
Presentation Software Trace and Memory Dump Analysis: Patterns, Tools, Processes and Best Practices from E2E Virtualization Conference (13th of May, 2011) is available for download:
http://www.dumpanalysis.com/STMDA-materials
- Dmitry Vostokov @ DumpAnalysis.org + TraceAnalysis.org -
Posted in Announcements, Debugging, Debugging Methodology, Escalation Engineering, Presentations, Root Cause Analysis, Software Behavior Patterns, Software Technical Support, Software Trace Analysis, Software Trace Reading, Tools, Trace Analysis Patterns, Training and Seminars, Troubleshooting Methodology | No Comments »
Sunday, May 8th, 2011
Learn how to analyze application, service and system crashes and freezes, navigate through memory dump space and diagnose heap corruption, memory leaks, CPU spikes, blocked threads, deadlocks, wait chains, and much more. We use a unique and innovative pattern-driven analysis approach to speed up the learning curve.
Memory Dump Analysis Services organizes a training course.
If you are registered you are allowed to optionally submit your memory dumps before the training. This will allow us in addition to the carefully constructed problems tailor extra examples to the needs of the attendees. All registrants will receive an optional pre-test before the first session and an optional test after each session.
The training consists of 2 four-hour sessions (4 hours on the first day and 4 hours on the next day). When you finish the training you additionally get:
- A full transcript in PDF format (retail price $200)
- 5 volumes of Memory Dump Analysis Anthology in PDF format (retail price $100)
- An attendance certificate (PDF format)
Prerequisites: Basic Windows troubleshooting
Session 1: August 1, 2011 2:00 PM - 6:00 PM BST
Session 2: August 2, 2011 2:00 PM - 6:00 PM BST
Price: 210 USD
Space is limited.
Reserve your remote training seat now.
- Dmitry Vostokov @ DumpAnalysis.org + TraceAnalysis.org -
Posted in Announcements, Crash Dump Analysis, Crash Dump Patterns, Memory Dump Analysis Services, Software Technical Support, Testing, Tools, Training and Seminars, Vista, WinDbg Tips and Tricks, Windows 7, Windows Server 2008, Windows System Administration, x64 Windows | No Comments »
Thursday, May 5th, 2011
This is a forthcoming virtual event to learn analysis of blockages, delays, obstructions, preventions, and stoppages in victimware suffering from software defects and malware. Additional information on how to join will be available soon on the main portal page:
http://www.dumpanalysis.org/stoppages2011
- Dmitry Vostokov @ DumpAnalysis.org + TraceAnalysis.org -
Posted in Announcements, Crash Dump Analysis, Debugging, Malware Analysis, Software Trace Analysis, StopPages Conferences, Victimware | No Comments »