Archive for the ‘Announcements’ Category
Monday, April 23rd, 2012
The cover of the latest Economist issue arrived today picturing a third industrial revolution prompted me to write about Software as means of production that I was thinking for sometime and even created a Software Generalist Party you are welcome to join. Software generalists are the future driving force of society change and I started working on a work comparable to Marx’s Capital called Software, Volume 1 subtitled as A Critical Analysis of Industrial Production (ISBN: 978-1908043375). It will also include an analysis of new emerging commodities such as memories.
Posted in Announcements, Books, Software and Business, Software and Economics, Software and Engineering, Software and Future, Software and History, Software and Industrial Production, Software and Philosophy, Software and Politics, Software and Science, Software and Sociology | No Comments »
Sunday, April 15th, 2012
After 4 years in print this bestselling title needs an update to address minor changes, include extra examples and reference additional research published in Volumes 2, 3, 4, 5 and 6.
- Title: Memory Dump Analysis Anthology, Volume 1
- Author: Dmitry Vostokov
- Publisher: OpenTask (Summer 2012)
- Language: English
- Product Dimensions: 22.86 x 15.24
- Paperback: 800 pages
- ISBN-13: 978-1-908043-35-1
- Hardcover: 800 pages
- ISBN-13: 978-1-908043-36-8
The cover for both paperback and hardcover titles will also have a matte finish. We used A Memory Window artwork for the back cover.

- Dmitry Vostokov @ DumpAnalysis.org + TraceAnalysis.org -
Posted in Aesthetics of Memory Dumps, Announcements, AntiPatterns, Art, Assembly Language, Best Practices, Books, Bugchecks Depicted, C and C++, Complete Memory Dump Analysis, Computer Science, Crash Dump Analysis, Crash Dump Patterns, Crash Dumps for Dummies, Debugging, Debugging Methodology, Dr. Watson, Escalation Engineering, Fun with Crash Dumps, GDB for WinDbg Users, Hardware, Images of Computer Memory, Kernel Development, Mathematics of Debugging, Memiotics (Memory Semiotics), Memoretics, Memory Dump Analysis Methodology, Memory Space Art, Memory Space Music, Memory Visualization, Minidump Analysis, Multithreading, Pattern-Driven Debugging, Pattern-Driven Software Support, Publishing, Reference, Root Cause Analysis, Science of Memory Dump Analysis, Software Architecture, Software Behavior DNA, Software Behavior Patterns, Software Behavioral Genome, Software Diagnostics, Software Engineering, Software Technical Support, Stack Trace Collection, Testing, Tools, Troubleshooting Methodology, Vista, WinDbg Scripts, WinDbg Tips and Tricks, WinDbg for GDB Users, Windows 7, Windows Data Structures, Windows Server 2008, Windows System Administration, x64 Windows | No Comments »
Sunday, April 15th, 2012
In a week this short full color book should appear in online bookstores:
- Title: Software Narratology: An Introduction to the Applied Science of Software Stories
- Authors: Dmitry Vostokov, Memory Dump Analysis Services
- Description: This is a transcript of Memory Dump Analysis Services Webinar about Software Narratology: an exciting new discipline and a field of research founded by DumpAnalysis.org. When software executes it gives us its stories in the form of UI events, software traces and logs. Such stories can be analyzed for their structure and patterns for troubleshooting, debugging and problem resolution purposes. Topics also include software narremes and their types, anticipatory software construction and software diagnostics.
- Publisher: OpenTask (April 2012)
- Language: English
- Product Dimensions: 28.0 x 21.6
- Paperback: 26 pages
- ISBN-13: 978-1908043078

- Dmitry Vostokov @ DumpAnalysis.org + TraceAnalysis.org -
Posted in Announcements, Books, CDF Analysis Tips and Tricks, Code Reading, Computer Science, Debugging, Debugging Methodology, Debugging Trends, Education and Research, Escalation Engineering, Event Tracing for Windows (ETW), Hermeneutics of Memory Dumps and Traces, Ideas, Narralog Programming Language, New Debugging School, Pattern-Driven Debugging, Pattern-Driven Software Support, Presentations, Publishing, Root Cause Analysis, SPDL, Science of Software Tracing, Software Behavior DNA, Software Behavior Patterns, Software Behavioral Genome, Software Diagnostics, Software Engineering, Software Narrative Fiction, Software Narrative Science, Software Narratology, Software Narremes, Software Problem Description Patterns, Software Problem Solving, Software Technical Support, Software Trace Analysis, Software Trace Analysis and History, Software Trace Deconstruction, Software Trace Linguistics, Software Trace Modeling, Software Trace Reading, Software Trace Visualization, Software Tracing Implementation Patterns, Software Troubleshooting Patterns, Structural Trace Patterns, Systems Thinking, Testing, Tools, Trace Analysis Patterns, Training and Seminars, Troubleshooting Methodology, UI Problem Analysis Patterns, Unified Debugging Patterns, Unified Software Diagnostics, Webinars | No Comments »
Monday, April 9th, 2012
Memory Dump Analysis Services organizes a free Webinar on Unified Software Diagnostics (USD) and the new scalable cost-effective software support model called Pattern-Driven Software Support devised to address various shortcomings in existing tiered software support organizations. Examples cover Windows, Mac OS and Linux.

Date: 22nd of June, 2012
Time: 17:00 (BST) 12:00 (EST) 09:00 (PST)
Duration: 60 minutes
Space is limited.
Reserve your Webinar seat now at:
https://www3.gotomeeting.com/register/172771078
- Dmitry Vostokov @ DumpAnalysis.org + TraceAnalysis.org -
Posted in Announcements, Best Practices, Crash Dump Analysis, Crash Dump Patterns, Debugging, Debugging Methodology, Debugging Trends, Economics, Escalation Engineering, Event Tracing for Windows (ETW), JIT Crash Analysis, JIT Memory Space Analysis, Malware Analysis, Malware Patterns, Memoretics, Memory Analysis Forensics and Intelligence, Memory Dump Analysis Methodology, Memory Dump Analysis Services, New Acronyms, New Debugging School, Pattern Prediction, Pattern-Driven Debugging, Pattern-Driven Software Support, Root Cause Analysis, Science of Memory Dump Analysis, Science of Software Tracing, Software Behavior DNA, Software Behavior Patterns, Software Behavioral Genome, Software Diagnostics, Software Engineering, Software Narratology, Software Problem Description Patterns, Software Problem Solving, Software Support Patterns, Software Technical Support, Software Trace Analysis, Software Troubleshooting Patterns, Software Victimology, Software and Economics, Structural Memory Patterns, Structural Trace Patterns, Systems Thinking, Testing, Tools, Trace Analysis Patterns, Training and Seminars, Troubleshooting Methodology, UI Problem Analysis Patterns, Unified Debugging Patterns, Unified Software Diagnostics, Victimware, Webinars, Workaround Patterns | No Comments »
Wednesday, April 4th, 2012
Posted in Announcements, History | 1 Comment »
Sunday, April 1st, 2012
The founder of pattern-driven debugging was invited to HQ a few years ago to join the Corporation and work on what would become the killer of current debuggers and disassemblers.
- Dmitry Vostokov @ DumpAnalysis.org + TraceAnalysis.org -
Posted in Announcements, Debugging, Debugging Industry, Memory Dreams, Pattern-Driven Debugging | No Comments »
Tuesday, March 20th, 2012
The previous definition of software narratology was restricted to software traces and logs (the top left quadrant on a software narrative square, also the part of Memoretics which studies memory snapshots). Now, with the broadening of the domain of software narratology to the whole world of software narrative stories including actor interactions with software in construction requirements use cases and post-construction incidents we give another definition:
Software narrative is a representation of software events and changes of state. Software Narratology is a discipline that studies such software narratives (software narrative science).
- Dmitry Vostokov @ DumpAnalysis.org + TraceAnalysis.org -
Posted in Announcements, Cloud Computing, Code Reading, Computer Forensics, Computer Science, Crash Dump Analysis, Crash Dump Patterns, Debugging, Memoretics, Science of Memory Dump Analysis, Science of Software Tracing, Software Behavior DNA, Software Behavior Patterns, Software Behavioral Genome, Software Engineering, Software Narrative Science, Software Narratology, Software Narremes, Software Problem Description Patterns, Software Problem Solving, Software Technical Support, Software Trace Analysis, Software Trace Deconstruction, Software Trace Modeling, Software Trace Reading, Structural Trace Patterns, Testing, Trace Analysis Patterns | No Comments »
Monday, March 19th, 2012
Not long ago we became the proud owners of Ke* parrot named after OS kernel functions. It didn’t behave as we expected (heavily used Reflection API) so Ki* parrot counterpart was brought into a space. They now behave and communicate happily ever after:

They also inspired a Computicart (Computical Art) composition: What is to be done?
- Dmitry Vostokov @ DumpAnalysis.org + TraceAnalysis.org -
Posted in Announcements, Fun with Debugging | No Comments »
Thursday, March 15th, 2012
This is both a game and serious philosophical and religious tool to guide your life. Basically you need either 32 coin flips to construct a 32-bit pointer (or 64 flips for wide coverage) or 16 flips using a dice where each throw can generate at least 2 bits. Any device can help if you can get a random pointer. Then you use your favourite memory dump and symbol files for interpretation. Double, triple and multiple dereferences from a pointer can also be used to construe a path.
For example, I just played and got:
0:000> ? 0y10010111111000100100011011100111

Evaluate expression: -1746778393 = 97e246e7
0:000> !address 97e246e7

Address 97e246e7 could not be mapped in any available regions
If address is inaccessible switch to another memory dump or continue flips and shift digits to the left. This way I got:
0:000> ? 0y00101111110001001000110111001111

Evaluate expression: 801410511 = 2fc48dcf
0:000> !address 02fc48dcf

Usage:                  Free

Base Address:           1f858000

End Address:            58c30000

Region Size:            393d8000

Type:                   00000000

State:                  00010000 MEM_FREE

Protect:                00000001 PAGE_NOACCESS
Continue flip and shift until you get an output with symbol signs:
0:000> ? 0y01011111100010010001101110011110

Evaluate expression: 1602821022 = 5f891b9e
0:000> dp 5F891B9E

5f891b9e  ???????? ???????? ???????? ????????

5f891bae  ???????? ???????? ???????? ????????

5f891bbe  ???????? ???????? ???????? ????????

5f891bce  ???????? ???????? ???????? ????????

5f891bde  ???????? ???????? ???????? ????????

5f891bee  ???????? ???????? ???????? ????????

5f891bfe  ???????? ???????? ???????? ????????

5f891c0e  ???????? ???????? ???????? ????????
0:000> !address 5F891B9E

Usage:                  Free

Base Address:           5eb8a000

End Address:            60080000

Region Size:            014f6000

Type:                   00000000

State:                  00010000 MEM_FREE

Protect:                00000001 PAGE_NOACCESS
Unloaded modules that overlapped the region in the past:

BaseAddr EndAddr    Size

5ebc0000 5ebcd000     d000 Perfctrs.dll
Dump output for thought: “In the past - perfect control, performance was counted, now - free.”
- Dmitry Vostokov @ DumpAnalysis.org + TraceAnalysis.org -
Posted in Announcements, Fun with Crash Dumps, Fun with Debugging, Games for Debugging, General Memory Analysis, Memory Religion (Memorianity), WinDbg Tips and Tricks | No Comments »
Saturday, March 3rd, 2012

Memory Dump Analysis Services organizes a new training course:
Description: Learn how to analyze app crashes and freezes, navigate through process core memory dump space and diagnose corruption, memory leaks, CPU spikes, blocked threads, deadlocks, wait chains, and much more. We use a unique and innovative pattern-driven analysis approach to speed up the learning curve. The training consists of practical step-by-step exercises using Xcode and GDB environments highlighting various patterns diagnosed in 64-bit process core memory dumps. The training also includes an overview of relevant similarities and differences between Windows and Mac OS X user space memory dump analysis useful for engineers with Wintel background.
If you are registered you are allowed to optionally submit your app core dumps before the training. This will allow us in addition to the carefully constructed problems tailor additional examples to the needs of the attendees.
The training consists of 2 two-hour sessions. When you finish the training you additionally get:
- A full transcript in PDF format (retail price $200)
- 6 volumes of Memory Dump Analysis Anthology in PDF format (retail price $120)
- A personalized attendance certificate with unique CID (PDF format)
- Mac OS X Debugging: Practical Foundations in PDF format (retail price $15)
- Free Dump Analysis World Network membership including updates to full PDF transcript Q&A section
Prerequisites: Basic Mac OS X troubleshooting and debugging
Audience: Software technical support and escalation engineers, system administrators, software developers and quality assurance engineers.
Session 1: October 19, 2012 4:00 PM - 6:00 PM BST
Session 2: October 22, 2012 4:00 PM - 6:00 PM BST
Price: 210 USD
Space is limited.
Reserve your remote training seat now at:
https://student.gototraining.com/r/3803636572165653760
If you are mainly interested in Windows memory dump analysis there is another course available:
Accelerated Windows Memory Dump Analysis
- Dmitry Vostokov @ DumpAnalysis.org + TraceAnalysis.org -
Posted in Announcements, Assembly Language, Crash Dump Analysis, Crash Dump Patterns, Debugging, Escalation Engineering, Mac Crash Corner, Mac OS X, Memory Dump Analysis Services, Software Engineering, Software Technical Support, Testing, Training and Seminars | No Comments »
Monday, February 20th, 2012
I was recently asked by a group of trainees to outline a simple approach to proceed after opening a memory dump. So I came up with these 7 steps:
1. !analyze -v [-hang]
2. Exception (Bugcheck): stack trace analysis with d* and lmv
3. !locks
4. !runaway f (!running)
5. Dump all (processes and) thread stack traces [with 32-bit] ~*kv (!process 0 ff)
6. Search for signs/patterns of abnormal behavior (exceptions, wait chains, message boxes [, from your custom checklist])
7. Narrow analysis down to a specific thread and dump raw stack data if needed [repeat*]
(commands/options in brackets denote kernel/complete dump variation)
[notes in square brackets denote additional options, such as x64 specifics, your product details, etc.]
What are your steps? I would be interested to hear about alternative analysis steps, techniques, etc.
- Dmitry Vostokov @ DumpAnalysis.org + TraceAnalysis.org -
Posted in Announcements, Best Practices, Complete Memory Dump Analysis, Crash Dump Analysis, Crash Dump Patterns, Debugging, Debugging Methodology, Memory Dump Analysis Methodology, Root Cause Analysis, Software Trace Analysis, WinDbg Tips and Tricks, x64 Windows | 1 Comment »
Sunday, February 19th, 2012
Memory Dump Analysis Services (DumpAnalysis.com) organizes a free Webinar about software narratology: an application of ideas from narratology to software narrative stories.

Learn about this exciting new discipline and a field of research. When software executes it gives us its stories in the form of UI events, software traces and logs. Such stories can be analyzed for their structure and patterns for troubleshooting, debugging and problem resolution purposes.
Prerequisites: basic software troubleshooting and ability to read software generated logs.
Audience: anyone can benefit from this new perspective: from software users to software engineers and managers.
Space is limited.
Reserve your Webinar seat now at:
https://www3.gotomeeting.com/register/603136294
- Dmitry Vostokov @ DumpAnalysis.org + TraceAnalysis.org -
Posted in Announcements, Computer Science, Debugging, Escalation Engineering, Intelligence Analysis Patterns, Memory Dump Analysis Services, SPDL, Science of Software Tracing, Security, Software Behavior DNA, Software Behavior Patterns, Software Behavioral Genome, Software Engineering, Software Narrative Fiction, Software Narratology, Software Problem Description Patterns, Software Problem Solving, Software Technical Support, Software Trace Analysis, Software Trace Deconstruction, Software Trace Linguistics, Software Trace Modeling, Software Trace Reading, Software Trace Visualization, Software Tracing Implementation Patterns, Software Tracing for Dummies, Software Troubleshooting Patterns, Software Victimology, Structural Trace Patterns, Testing, Tools, Trace Analysis Patterns, Troubleshooting Methodology, UI Problem Analysis Patterns, Unified Debugging Patterns, Unit Testing, Victimware, Webinars, Windows System Administration | No Comments »
Monday, February 13th, 2012
Any DA+TA source (dump artifact + trace artifact) can be used to generate and validate narrative fiction where memory dump components provide fiction structure and software trace components provide behaviour (plot and story):
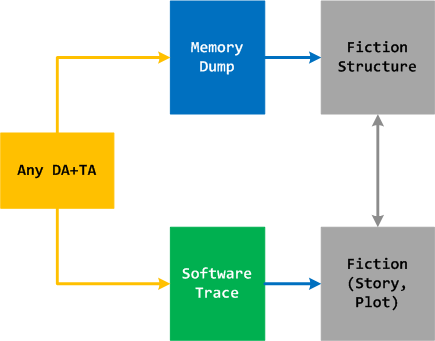
I already use such help in writing fiction books http://www.opentask.com/fiction-titles (”computational” novels) and use trace analysis patterns in validating historical narratives http://www.opentask.com/history-titles (with Excel and software trace viewers as tools). Here fiction is in no way different from software fictions outlined in the article about software stories. Please also note 2 other fields along with software narratology (SN was defined in mid 2009 where the first pattern appeared earlier in 2009) that are under development: software chorology and chorography. Adjoint threads and trace analysis patterns are the major contributions from SN.
Final note: Because we consider memory dumps in a general sense (e.g. philosophy of memoidealism where any data is a memory dump) and software trace narremes as small memory dumps (mid 2009) any data stream potentially can be represented as some fictional or real story. And vice versa, any story can be transformed into corresponding computer memory dumps and software traces (for example, the narralog language is being designed to model software stories).
- Dmitry Vostokov @ DumpAnalysis.org + TraceAnalysis.org -
Posted in Announcements, Fiction, General Memory Analysis, Memory Dump Fiction, Software Narrative Fiction, Software Narratology, Writing | No Comments »
Wednesday, February 1st, 2012
I have plans for a debugging tour to visit famous debugging places around the world. According to Wikipedia I have to start with Harward University where the first bug was found. I’ll keep you informed on the progress of this memorianic pilgrimage.
- Dmitry Vostokov @ DumpAnalysis.org + TraceAnalysis.org -
Posted in Announcements, Debugging, Debugging Tours, Fun with Debugging, Memorianic Pilgrimages, Memory Religion (Memorianity) | No Comments »
Wednesday, February 1st, 2012
Memory Dump Analysis Services plans to introduce Mac OS X memory dump analysis training this year based on the success of its Windows variant. For details and how to register please visit this page:
http://www.dumpanalysis.com/accelerated-mac-os-x-core-dump-analysis
- Dmitry Vostokov @ DumpAnalysis.org + TraceAnalysis.org -
Posted in Announcements, Crash Dump Analysis, Crash Dump Patterns, Debugging, Mac Crash Corner | No Comments »
Tuesday, January 31st, 2012
Memory Dump Analysis Services starts providing debugging training and assistance in addition to (based on) memory dump and software trace analysis. It has recently registered www.debugging.pro domain and is working on extending its courses to cover live debugging and additional OS platforms this year.
- Dmitry Vostokov @ DumpAnalysis.org + TraceAnalysis.org -
Posted in .NET Debugging, Android Crash Corner, Announcements, Crash Dump Analysis, Debugging, Debugging Bureau, Debugging Methodology, Debugging Today, Debugging Trends, Linux Crash Corner, Live Debugging, Mac Crash Corner, Memory Dump Analysis Services, Software Debugging Services, Software Trace Analysis, Training and Seminars | No Comments »
Friday, January 27th, 2012
Advanced training sessions time may not suitable due to different geographic time zones. So I have decided to publish this training in a book format (currently in PDF) and make it available in paperback on Amazon and B&N later. Book details:
- Title: Advanced Windows Memory Dump Analysis with Data Structures: Training Course Transcript and WinDbg Practice Exercises with Notes
- Description: The full transcript of Memory Dump Analysis Services Training with 10 step-by-step exercises, notes, and selected Q&A.
- Authors: Dmitry Vostokov, Memory Dump Analysis Services
- Publisher: OpenTask (January 2012)
- Language: English
- Product Dimensions: 28.0 x 21.6
- Paperback: 180 pages
- ISBN-13: 978-1908043344
Table of Contents
Now available for sale in PDF format from Memory Dump Analysis Services.
- Dmitry Vostokov @ DumpAnalysis.org + TraceAnalysis.org -
Posted in Announcements, Books, Complete Memory Dump Analysis, Crash Dump Analysis, Crash Dump Patterns, Debugging, Escalation Engineering, Kernel Development, Memory Dump Analysis Services, Publishing, Software Technical Support, Training and Seminars, Uses of UML, WinDbg Scripts, WinDbg Tips and Tricks, x64 Windows | No Comments »
Monday, January 23rd, 2012
Memory Dump Analysis Services started working on 2CARE2 system (Crash Analysis Report Environment, 2nd generation) and asked me to design a trademark. My Chemistry background (I like Organic Chemistry most) and imagination led me to represent client and server parts holistically as an aromatic-like compound:

- Dmitry Vostokov @ DumpAnalysis.org + TraceAnalysis.org -
Posted in Announcements, Chemistry, Crash Analysis Report Environment (CARE), Crash Dump Analysis, Memory Dump Analysis Services, Trademarks | No Comments »
Saturday, January 21st, 2012
Here’s what we see from our Google Analytics stats. Top 5 browsers in 2011 used to access our portal and blog:
| Browser |
Visits
|
| Internet Explorer |
82,334
|
| Firefox |
76,880
|
| Chrome |
57,275
|
| Opera |
9,776
|
| Safari |
6,197
|
- Dmitry Vostokov @ DumpAnalysis.org + TraceAnalysis.org -
Posted in Announcements, DumpAnalysis.org Statistics, History | No Comments »
Saturday, January 21st, 2012
Here’s what we see from our Google Analytics stats. Top 25 mobile devices in 2011 used to access our portal and blog:
| Mobile Device Info |
Visits
|
| Apple iPhone |
599
|
| Apple iPad |
467
|
| (not set) |
415
|
| Apple iPod Touch |
41
|
| Samsung GT-I9100 Galaxy S II |
30
|
| HTC Desire HD |
20
|
| Motorola DroidX |
19
|
| SonyEricsson LT15i Xperia Arc |
18
|
| HTC Desire |
16
|
| Motorola Xoom |
12
|
| Verizon Droid |
12
|
| Google Nexus One |
9
|
| HTC EVO 4G |
9
|
| Samsung Nexus S |
8
|
| Nokia E63 |
7
|
| Samsung GT-I9000 Galaxy S |
7
|
| Huawei IDEOS S7 |
6
|
| Samsung SHW-M130L Galaxy U |
6
|
| HTC ADR6300 Incredible |
5
|
| Motorola A953 MILESTONE 2 |
5
|
| Motorola Droid 2 |
5
|
| RIM BlackBerry 8530 Curve |
5
|
| Samsung Galaxy Tab |
5
|
| Samsung GT-P7510 Galaxy Tab 10.1 |
5
|
| Samsung SWH-M110S |
5
|
Top 10 mobile operating systems:
| Operating System |
Visits
|
| iPhone |
1,078
|
| iPad |
827
|
| Android |
628
|
| iPod |
75
|
| BlackBerry |
54
|
| Nokia |
23
|
| SymbianOS |
15
|
| Windows Phone |
13
|
| Windows |
8
|
| Samsung |
4
|
- Dmitry Vostokov @ DumpAnalysis.org + TraceAnalysis.org -
Posted in Announcements, DumpAnalysis.org Statistics, History | No Comments »