Icons for Memory Dump Analysis Patterns (Part 58)
Friday, July 16th, 2010Today we introduce an icon for Local Buffer Overflow pattern:
B/W
![]()
Color
![]()
- Dmitry Vostokov @ DumpAnalysis.org + TraceAnalysis.org -
Today we introduce an icon for Local Buffer Overflow pattern:
B/W
![]()
Color
![]()
- Dmitry Vostokov @ DumpAnalysis.org + TraceAnalysis.org -
Sometimes we have threads that wait for a response from another machine (for example, via RPC) and for most of the time Coupled Processes pattern covers that if we assume that processes in that pattern are not restricted to same machine. However, sometimes we have threads that provide hints for dependency on an another machine through their data and that could also involve additional threads from different processes to accomplish the task. Here we have a need for another pattern that I call Coupled Machines. For example, the following thread on a computer SERVER_A is trying to set the current working directory that resides on a computer SERVER_B:
kd> kv 100

ChildEBP RetAddr  Args to Child

b881c8d4 804e1bf2 89cd9c80 89cd9c10 804e1c3e nt!KiSwapContext+0x2f

b881c8e0 804e1c3e 00000000 89e35b08 89e35b34 nt!KiSwapThread+0x8a

b881c908 f783092e 00000000 00000006 00000000 nt!KeWaitForSingleObject+0x1c2

b881c930 f7830a3b 89e35b08 00000000 f78356d8 Mup!PktPostSystemWork+0x3d

b881c94c f7836712 b881c9b0 b881c9b0 b881c9b8 Mup!PktGetReferral+0xce

b881c980 f783644f b881c9b0 b881c9b8 00000000 Mup!PktCreateDomainEntry+0x224

b881c9d0 f7836018 0000000b 00000000 b881c9f0 Mup!DfsFsctrlIsThisADfsPath+0x2bb

b881ca14 f7835829 89a2e130 899ba350 b881caac Mup!CreateRedirectedFile+0x2cd

b881ca70 804e13eb 89f46ee8 89a2e130 89a2e130 Mup!MupCreate+0x1cb

b881ca80 805794b6 89f46ed0 89df3c44 b881cc18 nt!IopfCallDriver+0x31

b881cb60 8056d03b 89f46ee8 00000000 89df3ba0 nt!IopParseDevice+0xa12

b881cbd8 805701e7 00000000 b881cc18 00000042 nt!ObpLookupObjectName+0x53c

b881cc2c 80579b12 00000000 00000000 00003801 nt!ObOpenObjectByName+0xea

b881cca8 80579be1 00cff67c 00100020 00cff620 nt!IopCreateFile+0x407

b881cd04 80579d18 00cff67c 00100020 00cff620 nt!IoCreateFile+0x8e

b881cd44 804dd99f 00cff67c 00100020 00cff620 nt!NtOpenFile+0x27

b881cd44 7c90e514 00cff67c 00100020 00cff620 nt!KiFastCallEntry+0xfc

00cff5f0 7c90d5aa 7c91e8dd 00cff67c 00100020 ntdll!KiFastSystemCallRet

00cff5f4 7c91e8dd 00cff67c 00100020 00cff620 ntdll!ZwOpenFile+0xc

00cff69c 7c831e58 00cff6a8 00460044 0078894a ntdll!RtlSetCurrentDirectory_U+0x169

00cff6b0 7731889e 0078894a 00000000 00000001 kernel32!SetCurrentDirectoryW+0×2b

00cffb84 7730ffbb 00788450 00788b38 00cffbe0 schedsvc!CSchedWorker::RunNTJob+0×221

00cffe34 7730c03a 01ea9108 8ed032d4 00787df8 schedsvc!CSchedWorker::RunJobs+0×304

00cffe74 77310e4d 7c80a749 00000000 00000000 schedsvc!CSchedWorker::RunNextJobs+0×129

00cfff28 77310efc 7730b592 00000000 000ba4bc schedsvc!CSchedWorker::MainServiceLoop+0×6d9

00cfff2c 7730b592 00000000 000ba4bc 0009a2bc schedsvc!SchedMain+0xb

00cfff5c 7730b69f 00000001 000ba4b8 00cfffa0 schedsvc!SchedStart+0×266

00cfff6c 010011cc 00000001 000ba4b8 00000000 schedsvc!SchedServiceMain+0×33

00cfffa0 77df354b 00000001 000ba4b8 0007e898 svchost!ServiceStarter+0×9e

00cfffb4 7c80b729 000ba4b0 00000000 0007e898 ADVAPI32!ScSvcctrlThreadA+0×12

00cfffec 00000000 77df3539 000ba4b0 00000000 kernel32!BaseThreadStart+0×37
kd> du /c 90 0078894a

0078894a  “\\SERVER_B\Share_X$\Folder_Q”
The next post will discuss a pattern cooperation case study including this pattern in more detail.
- Dmitry Vostokov @ DumpAnalysis.org + TraceAnalysis.org -
I knew it was my destiny! ![]()
kd> !analyze -vostokov
[...]
MANUALLY_INITIATED_CRASH (e2)

The user manually initiated this crash dump.

Arguments:

Arg1: 00000000

Arg2: 00000000

Arg3: 00000000

Arg4: 00000000
Debugging Details:

------------------
[...]
- Dmitry Vostokov @ DumpAnalysis.org + TraceAnalysis.org -
While reading evolution books ranging from popular like Darwin’s Dangerous Idea to specialized like Evolution: The First Four Billion Years and Encyclopedia of Evolution I felt the need to read Darwin’s biography. My first encounter with Darwin was even before a primary school when I was looking at illustrations to his voyages in a library. Later, during my school years in Soviet Union, I saw a movie about him. I vividly remember a Wilberforce and FitzRoy scene. So you might imaging that I was very keen to read 680 page book (not counting notes and bibliography). Unfortunately I found it a bit boring and written in a difficult language compared to other biographies I read in English. May be the language was chosen deliberately to emulate Victorian epoch?
Almost in the middle of reading this book I stumbled across another book: The Darwin Conspiracy: Origins of a Scientific Crime and reading the latter (it’s like a thriller and you can download the free PDF from www.darwin-conspiracy.co.uk) gave me an impulse to continue reading Darwin’s biography with a critical eye. Looking at the same facts your can always interpret them differently and the conspiracy book reminded me to read behind the lines more carefully and remember about politics in science and class issues in society. I’m very interested in memetic engineering Darwin used to delicately arrange and propagate his ideas. The biography mentions Wallace in passing a few times but there is no discussion about the priority and the crucial Linnean Society meeting is not in the focus and doesn’t grab any attention.
One fact I didn’t know before reading this biography is that Darwin was always sick. Now “tormented evolutionist” phrase acquires the new meaning to me. I also got the feeling that Darwin’s hesitation to publish his ideas (if he had any to publish) was caused by sickness as well. Actually the sickness was the main focus of the book. However I really wonder how could such a sick man (as described) could write that huge amount of correspondence, do research and write many books.
One quote I found at the end of the book says that Darwin would not approve anti-religious stance of Dawkins and Co.:
“Moreover though I am a strong advocate for free thought on all subjects, yet it appears to me (whether rightly or wrongly) that direct arguments against christianity & theism produce hardly any effect on the public; & freedom of thought is best promoted by the gradual illumination of men’s minds, which follows from the advance of science. It has, therefore, been always my object to avoid writing on religion, & I have confined myself to science. I may, however, have been unduly biassed by the pain which it would give some members of my family, if I aided in any way direct attacks on religion.”
The quote got my attention probably because I recently read another book: The Selfish Genius.
Darwin: The Life of a Tormented Evolutionist

- Dmitry Vostokov @ LiterateScientist.com -
Have you heard about the new method of visual notepad debugging? You don’t even need a debugger, just a notepad. If not, here’s a recipe:
1. Open a buggy application executable file or a DLL file you suspect in notepad.exe
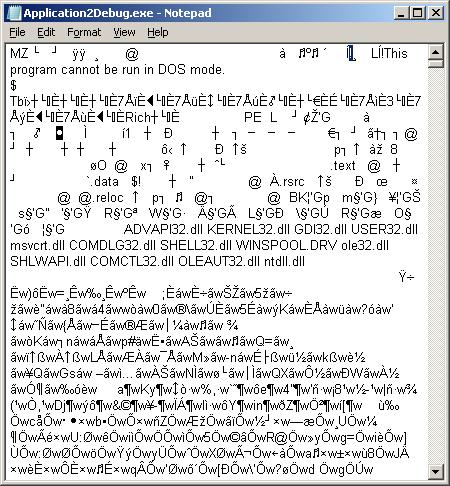
2. Change the font to Webdings
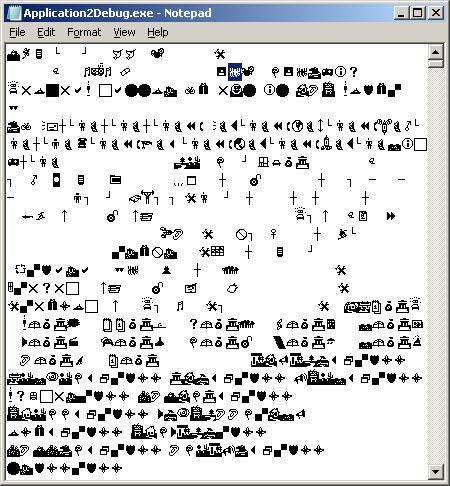
3. Search for a bang: ‘!’ (a bug in Webdings font)
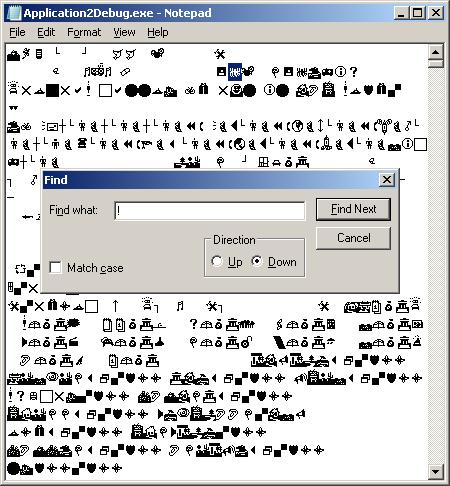
4. Remove the bug and repeat the search
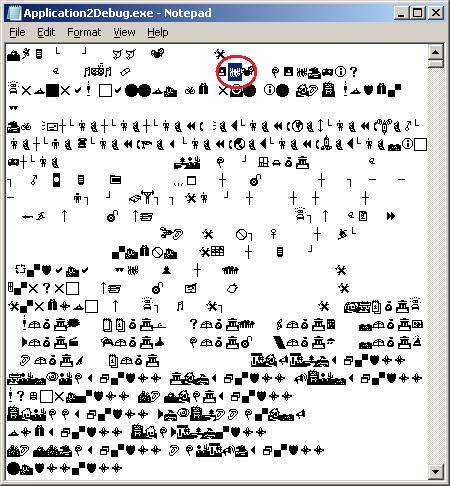
5. Remove that bug too
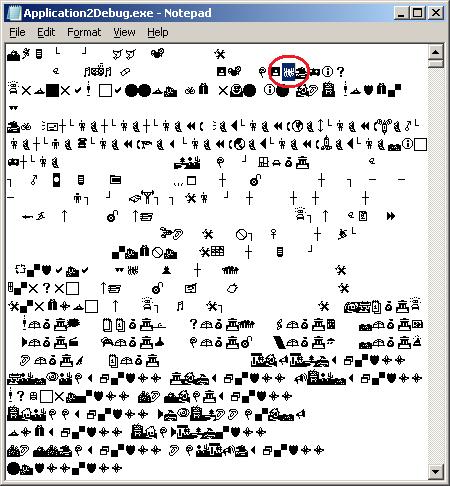
6. Find another bug and remove it too
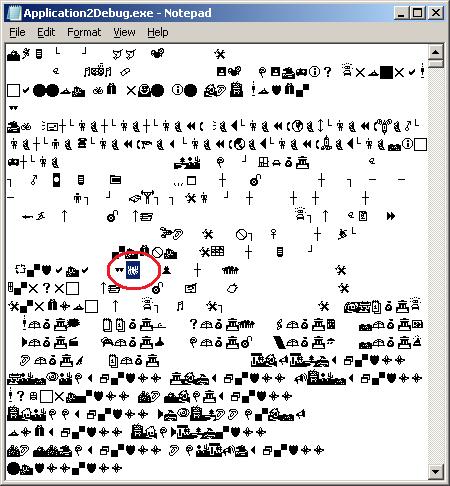
7. You might consider “Replace All” if there are too many bugs in your application
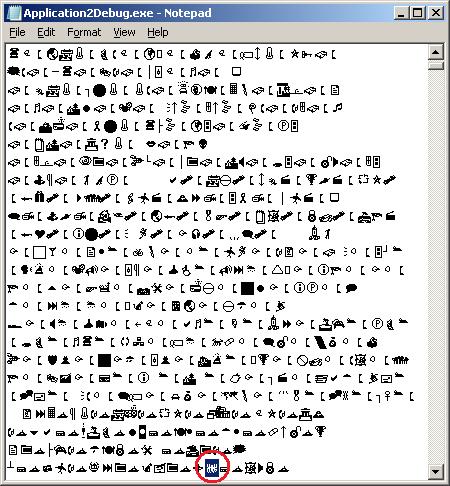
8. Save the debugged file
9. Run it - if it crashes do a postmortem analysis - may be you overfixed your bugs. Or you might see a transmutation, in my case the 32-bit Win32 Application2Debug.exe became an MS-DOS application silently terminating after the launch:
0:000> kL

ChildEBP RetAddr

011ef874 76e45500 ntdll!KiFastSystemCallRet

011ef878 76e1b518 ntdll!ZwTerminateProcess+0xc

011ef888 76be41ec ntdll!RtlExitUserProcess+0x7a

011ef89c 0e75c85f kernel32!ExitProcess+0x12

011ef8a4 0e79b07f ntvdm!host_terminate+0x23

011ef8b0 0e781db6 ntvdm!terminate+0x78

011efbfc 0e78094b ntvdm!cmdGetNextCmd+0x294

011efc04 0e769d94 ntvdm!CmdDispatch+0xf

011efc10 0e771882 ntvdm!MS_bop_4+0x2f

011efc14 0e77278a ntvdm!EventVdmBop+0x29

011efc2c 0e73510b ntvdm!cpu_simulate+0x17a

011efc38 0e735086 ntvdm!host_main+0x5f

011efc74 0e7352bd ntvdm!main+0x3a

011efd54 76bed0e9 ntvdm!host_main+0x211

011efd60 76e219bb kernel32!BaseThreadInitThunk+0xe

011efda0 76e2198e ntdll!__RtlUserThreadStart+0x23

011efdb8 00000000 ntdll!_RtlUserThreadStart+0x1b
- Dmitry Vostokov @ DumpAnalysis.org + TraceAnalysis.org -
This is a specialization of Blocked Thread pattern where a thread is waiting for a hardware I/O response. For example, a frozen system initialization thread is waiting for a response from one of ACPI general register ports:
kd> kL 100

ChildEBP RetAddr

f7a010bc f74c5a57 hal!READ_PORT_UCHAR+0×7

f7a010c8 f74c5ba4 ACPI!DefReadAcpiRegister+0xa1

f7a010d8 f74b4d78 ACPI!ACPIReadGpeStatusRegister+0×10

f7a010e4 f74b6334 ACPI!ACPIGpeIsEvent+0×14

f7a01100 8054157d ACPI!ACPIInterruptServiceRoutine+0×16

f7a01100 806d687d nt!KiInterruptDispatch+0×3d

f7a01194 804f9487 hal!HalEnableSystemInterrupt+0×79

f7a011d8 8056aac4 nt!KeConnectInterrupt+0×95

f7a011fc f74c987c nt!IoConnectInterrupt+0xf2

f7a0123c f74d13f0 ACPI!OSInterruptVector+0×76

f7a01250 f74b5781 ACPI!ACPIInitialize+0×154

f7a01284 f74cf824 ACPI!ACPIInitStartACPI+0×71

f7a012b0 f74b1e12 ACPI!ACPIRootIrpStartDevice+0xc0

f7a012e0 804ee129 ACPI!ACPIDispatchIrp+0×15a

f7a012f0 8058803b nt!IopfCallDriver+0×31

f7a0131c 805880b9 nt!IopSynchronousCall+0xb7

f7a01360 804f515c nt!IopStartDevice+0×4d

f7a0137c 80587769 nt!PipProcessStartPhase1+0×4e

f7a015d4 804f5823 nt!PipProcessDevNodeTree+0×1db

f7a01618 804f5ab3 nt!PipDeviceActionWorker+0xa3

f7a01630 8068afc6 nt!PipRequestDeviceAction+0×107

f7a01694 80687e48 nt!IopInitializeBootDrivers+0×376

f7a0183c 806862dd nt!IoInitSystem+0×712

f7a01dac 805c61e0 nt!Phase1Initialization+0×9b5

f7a01ddc 80541e02 nt!PspSystemThreadStartup+0×34

00000000 00000000 nt!KiThreadStartup+0×16
kd> r

eax=00000000 ebx=00000000 ecx=00000002 edx=0000100c esi=00000000 edi=867d8008

eip=806d664b esp=f7a010c0 ebp=f7a010c8 iopl=1         nv up ei pl zr na pe nc

cs=0008  ss=0010  ds=0023  es=0023  fs=0030  gs=0000             efl=00001246

hal!READ_PORT_UCHAR+0x7:

806d664b c20400          ret     4
kd> ub eip

hal!KdRestore+0x9:

806d663f cc              int     3

806d6640 cc              int     3

806d6641 cc              int     3

806d6642 cc              int     3

806d6643 cc              int     3

hal!READ_PORT_UCHAR:

806d6644 33c0            xor     eax,eax

806d6646 8b542404        mov     edx,dword ptr [esp+4]

806d664a ec              in      al,dx
kd> version

[...]

System Uptime: 0 days 0:03:42.140

[...]
kd> !thread

THREAD 867c63e8  Cid 0004.0008  Teb: 00000000 Win32Thread: 00000000 RUNNING on processor 0

IRP List:

    867df008: (0006,0190) Flags: 00000000  Mdl: 00000000

Not impersonating

DeviceMap                 e1005460

Owning Process            0       Image:         <Unknown>

Attached Process          867c6660       Image:         System

Wait Start TickCount      39             Ticks: 1839 (0:00:00:18.416)

Context Switch Count      4

UserTime                  00:00:00.000

KernelTime                00:00:00.911

Start Address nt!Phase1Initialization (0x80685928)

Stack Init f7a02000 Current f7a014a4 Base f7a02000 Limit f79ff000 Call 0

Priority 31 BasePriority 8 PriorityDecrement 0 DecrementCount 0

[...]
- Dmitry Vostokov @ DumpAnalysis.org + TraceAnalysis.org -
Today we introduce an icon for IRP Distribution Anomaly pattern:
B/W
![]()
Color
![]()
- Dmitry Vostokov @ DumpAnalysis.org + TraceAnalysis.org -
Here we model Message Hooks pattern using MessageHistory tool. It uses window message hooking mechanism to intercept window messages. Download the tool and run either MessageHistory.exe or MessageHistory64.exe and push its Start button. Whenever any process becomes active after that either mhhooks.dll or mhhooks64.dll gets injected into the process virtual address space. Then we run WinDbg x86 or WinDbg x64, run notepad.exe and attach the debugger noninvasively to it:
*** wait with pending attach

Symbol search path is: srv*

Executable search path is:

WARNING: Process 2932 is not attached as a debuggee

         The process can be examined but debug events will not be received

(b74.f44): Wake debugger - code 80000007 (first chance)

USER32!NtUserGetMessage+0xa:

00000000`76f9c92a c3              ret
0:000> .symfix
0:000> .reload
0:000> k

Child-SP          RetAddr           Call Site

00000000`0028f908 00000000`76f9c95e USER32!NtUserGetMessage+0xa

00000000`0028f910 00000000`ff511064 USER32!GetMessageW+0x34

00000000`0028f940 00000000`ff51133c notepad!WinMain+0x182

00000000`0028f9c0 00000000`76e7f56d notepad!DisplayNonGenuineDlgWorker+0x2da

00000000`0028fa80 00000000`770b3281 kernel32!BaseThreadInitThunk+0xd

00000000`0028fab0 00000000`00000000 ntdll!RtlUserThreadStart+0x1d
If we don’t select “Noninvasive” in “Attach to Process” dialog box we need to switch from the debugger injected thread to our main notepad application thread:
0:001> .symfix
0:001> .reload
0:001> k

Child-SP          RetAddr           Call Site

00000000`024bfe18 00000000`77178638 ntdll!DbgBreakPoint

00000000`024bfe20 00000000`76e7f56d ntdll!DbgUiRemoteBreakin+0x38

00000000`024bfe50 00000000`770b3281 kernel32!BaseThreadInitThunk+0xd

00000000`024bfe80 00000000`00000000 ntdll!RtlUserThreadStart+0x1d
0:001> ~0s

USER32!NtUserGetMessage+0xa:

00000000`76f9c92a c3              ret
0:000> k

Child-SP          RetAddr           Call Site

00000000`000af9e8 00000000`76f9c95e USER32!NtUserGetMessage+0xa

00000000`000af9f0 00000000`ff511064 USER32!GetMessageW+0x34

00000000`000afa20 00000000`ff51133c notepad!WinMain+0x182

00000000`000afaa0 00000000`76e7f56d notepad!DisplayNonGenuineDlgWorker+0x2da

00000000`000afb60 00000000`770b3281 kernel32!BaseThreadInitThunk+0xd

00000000`000afb90 00000000`00000000 ntdll!RtlUserThreadStart+0x1d
We then inspect the raw stack data to see any execution residue and find a few related function calls:
0:000> !teb

TEB at 000007fffffdd000

    ExceptionList:        0000000000000000

    StackBase:            0000000000290000

    StackLimit:           000000000027f000

    SubSystemTib:         0000000000000000

    FiberData:            0000000000001e00

    ArbitraryUserPointer: 0000000000000000

    Self:                 000007fffffdd000

    EnvironmentPointer:   0000000000000000

    ClientId:             0000000000000b74 . 0000000000000f44

    RpcHandle:            0000000000000000

    Tls Storage:          000007fffffdd058

    PEB Address:          000007fffffdf000

    LastErrorValue:       0

    LastStatusValue:      c0000034

    Count Owned Locks:    0

    HardErrorMode:        0
0:000> dps 000000000027f000 0000000000290000

[...]

00000000`0028e388  00000000`008bd8e0

00000000`0028e390  00000000`00000000

00000000`0028e398  00000000`00000001

00000000`0028e3a0  00000000`00000282

00000000`0028e3a8  00000000`76f966b2 USER32!SendMessageToUI+0x6a

00000000`0028e3b0  00000000`001406b0

00000000`0028e3b8  00000000`004000f8

00000000`0028e3c0  00000000`00000001

00000000`0028e3c8  00000001`800014b8 mhhooks64!CallWndProc+0×2d8

00000000`0028e3d0  00000000`00000000

00000000`0028e3d8  00000000`002f0664

00000000`0028e3e0  00000000`00000001

00000000`0028e3e8  00000000`76f96a72 USER32!ImeNotifyHandler+0xb4

00000000`0028e3f0  00000000`00000000

00000000`0028e3f8  00000000`004000f8

00000000`0028e400  00000000`00000001

00000000`0028e408  000007fe`ff1213b4 IMM32!CtfImmDispatchDefImeMessage+0×60

00000000`0028e410  00000000`00000000

00000000`0028e418  00000000`002f0664

00000000`0028e420  00000000`00000000

00000000`0028e428  00000000`002f0664

00000000`0028e430  00000000`008bd8e0

00000000`0028e438  00000000`76f96a06 USER32!ImeWndProcWorker+0×3af

00000000`0028e440  00000000`00000282

00000000`0028e448  00000000`00000000

00000000`0028e450  00000000`00000001

00000000`0028e458  00000000`004000f8

00000000`0028e460  00000000`00000000

00000000`0028e468  00000000`00000001

00000000`0028e470  00000000`00000000

00000000`0028e478  00000000`00000000

00000000`0028e480  00000000`00000000

00000000`0028e488  00000000`76f9a078 USER32!_fnDWORD+0×44

00000000`0028e490  00000000`00000000

[…]

00000000`0028f770  00000000`001406b0

00000000`0028f778  000007ff`fffdd000

00000000`0028f780  00000000`0028f8c8

00000000`0028f788  00000000`008bd8e0

00000000`0028f790  00000000`00000018

00000000`0028f798  00000000`76f885a0 USER32!DispatchHookW+0×2c

00000000`0028f7a0  000022b2`00000000

00000000`0028f7a8  00000000`00000001

00000000`0028f7b0  000007fe`ff2d2560 MSCTF!IMCLock::`vftable’

00000000`0028f7b8  00000000`00407c50

00000000`0028f7c0  00000000`000c0e51

00000000`0028f7c8  00000000`00000000

00000000`0028f7d0  00000000`00000000

00000000`0028f7d8  00000000`00000113

00000000`0028f7e0  00000000`00000113

00000000`0028f7e8  00000000`00000001

00000000`0028f7f0  00000000`00000000

00000000`0028f7f8  00000000`76f9c3df USER32!UserCallWinProcCheckWow+0×1cb

00000000`0028f800  00000000`ff510000 notepad!CFileDialogEvents_QueryInterface <PERF> (notepad+0×0)

00000000`0028f808  00000000`00000000

00000000`0028f810  00000000`00000000

00000000`0028f818  00000000`00000000

00000000`0028f820  00000000`00000000

00000000`0028f828  00000000`00000038

00000000`0028f830  00000000`00000000

00000000`0028f838  00000000`00000000

00000000`0028f840  00000000`00000000

00000000`0028f848  00000000`770cfdf5 ntdll!KiUserCallbackDispatcherContinue

00000000`0028f850  00000000`00000048

00000000`0028f858  00000000`00000001

00000000`0028f860  00000000`00000000

[…]
We also see a 3rd-party module in proximity having “hook” in its module name: mhhooks64. We disassemble its address to see yet another message hooking evidence:
0:000> .asm no_code_bytes

Assembly options: no_code_bytes
0:000> ub 00000001`800014b8

mhhooks64!CallWndProc+0×2ae:

00000001`8000148e imul    rcx,rcx,30h

00000001`80001492 lea     rdx,[mhhooks64!sendMessages (00000001`80021030)]

00000001`80001499 mov     dword ptr [rdx+rcx+28h],eax

00000001`8000149d mov     r9,qword ptr [rsp+50h]

00000001`800014a2 mov     r8,qword ptr [rsp+48h]

00000001`800014a7 mov     edx,dword ptr [rsp+40h]

00000001`800014ab mov     rcx,qword ptr [mhhooks64!hCallWndHook (00000001`80021028)]

00000001`800014b2 call    qword ptr [mhhooks64!_imp_CallNextHookEx (00000001`80017280)]
- Dmitry Vostokov @ DumpAnalysis.org + TraceAnalysis.org -
After the previous announcement of WinDbg.org 3rd ranging place I see it moved to the 2nd first level ranking leaving Wikipedia behind. I think it would be impossible to go ahead of WHDC so I calm down and continue to monitor ranking from time to time only :-)
- Dmitry Vostokov @ DumpAnalysis.org + TraceAnalysis.org -
Comments in italics are mine and express my own views, thoughts and opinions
Windows Internals by M. Russinovich, D. Solomon and A. Ionescu:
File and registry virtualization is for 32-bit apps only (p. 522)
Files (as locations) with executable extensions are excluded from virtualization (p. 524)
luafv.sys - filesystem virtualization driver (pp. 524 - 525)
\Users\<user>\AppData\Local\VirtualStore\Windows\*.* (p. 525)
Admin Approval Mode, over-the-shoulder and consent elevations (p. 529)
appinfo.dll -> consent.exe (p. 529)
Process reparenting (p. 531)
Running regedt32.exe to get virtualized registry view (p. 533)
Typical I/O request flow (pp. 540 - 541) - here is a stack trace example from x64 Windows for a remote file request that reaches network drivers (some irrelevant 3rd-party filter drivers like antivirus were skipped):
Child-SP          RetAddr           Call Site

fffffadf`25d92ff0 fffffadf`28ec5b97 NetworkCardVendor!send_packet+0x33c

fffffadf`25d93250 fffffadf`28ec5903 NDIS!ndisMProcessSGList+0x8e

fffffadf`25d932e0 fffffadf`28e85618 NDIS!ndisMAllocSGList+0x17c

fffffadf`25d933a0 fffffadf`26ab57c4 NDIS!ndisMSendX+0x21e

fffffadf`25d934d0 fffffadf`26ab5999 tcpip!ARPSendData+0x23a

fffffadf`25d93540 fffffadf`26ab20ea tcpip!ARPTransmit+0x151

fffffadf`25d935d0 fffffadf`26aaecad tcpip!IPTransmit+0xaf5

fffffadf`25d93850 fffffadf`26aa94c6 tcpip!TCPSend+0x8d5

fffffadf`25d93930 fffffadf`26aafa8c tcpip!TdiSend+0x344

fffffadf`25d939a0 fffffadf`26a4085c tcpip!TCPSendData+0xee

fffffadf`25d93a00 fffffadf`26a4845b netbt!NTSend+0x227

fffffadf`25d93ac0 fffffadf`269a546d netbt!NbtDispatchInternalCtrl+0x38

fffffadf`25d93c50 fffffadf`269cea18 rdbss!RxTdiSend+0x1a2

fffffadf`25d93cf0 fffffadf`2693efcf rdbss!RxCeSend+0x98

fffffadf`25d93d80 fffffadf`268d82fd mrxsmb!VctTranceive+0xa6

fffffadf`25d93de0 fffffadf`2693fea9 mrxsmb!SmbCeTranceive+0x483

fffffadf`25d93e70 fffffadf`2693e94b mrxsmb!SmbTransactExchangeStart+0x558

fffffadf`25d93f20 fffffadf`26940abf mrxsmb!SmbCeInitiateExchange+0x2fd

fffffadf`25d93f70 fffffadf`26940c5b mrxsmb!SmbCeSubmitTransactionRequest+0x148

fffffadf`25d93fe0 fffffadf`269412e0 mrxsmb!_SmbCeTransact+0x1a1

fffffadf`25d940c0 fffffadf`26941625 mrxsmb!MRxSmbQueryFileInformation+0x811

fffffadf`25d94220 fffffadf`26941dfa mrxsmb!MRxSmbQueryFileInformationFromPseudoOpen+0x116

fffffadf`25d94260 fffffadf`2693e94b mrxsmb!SmbPseExchangeStart_Create+0x2da

fffffadf`25d94300 fffffadf`2693f50c mrxsmb!SmbCeInitiateExchange+0x2fd

fffffadf`25d94350 fffffadf`269cc4c1 mrxsmb!MRxSmbCreate+0x5d6

fffffadf`25d94430 fffffadf`269cc730 rdbss!RxCollapseOrCreateSrvOpen+0x154

fffffadf`25d944d0 fffffadf`269c7a92 rdbss!RxCreateFromNetRoot+0x399

fffffadf`25d94570 fffffadf`269a2a77 rdbss!RxCommonCreate+0x49a

fffffadf`25d94680 fffffadf`269343e8 rdbss!RxFsdCommonDispatch+0x51c

fffffadf`25d94780 fffffadf`290bfdb3 mrxsmb!MRxSmbFsdDispatch+0x211

fffffadf`25d947d0 fffffadf`290bfdb3 fltmgr!FltpCreate+0x353

[...]

fffffadf`25d98460 fffff800`012840b4 nt!IopParseDevice+0x1088

fffffadf`25d98610 fffff800`012887d7 nt!ObpLookupObjectName+0x931

fffffadf`25d98720 fffff800`01295dad nt!ObOpenObjectByName+0x180

fffffadf`25d98910 fffff800`0129cd87 nt!IopCreateFile+0x630

fffffadf`25d98aa0 fffff800`012987f9 nt!IoCreateFile+0x12f

fffffadf`25d98b80 fffff800`0102e5fd nt!NtOpenFile+0x49

fffffadf`25d98c00 00000000`77ef0d1a nt!KiSystemServiceCopyEnd+0x3

00000000`000ac568 00000000`77d6f7c9 ntdll!NtCreateFile+0xa

00000000`000ac570 000007ff`7fd535c3 kernel32!CreateFileW+0x511
Our future sponsor has been registered in Ireland and has its own independent website and logo: DumpAnalysis.com

More information will be available later this month.
- Dmitry Vostokov @ DumpAnalysis.org + TraceAnalysis.org -
Twitter epoch gives an additional aesthetic dimension to this artwork.
- Dmitry Vostokov @ DumpAnalysis.org + TraceAnalysis.org -
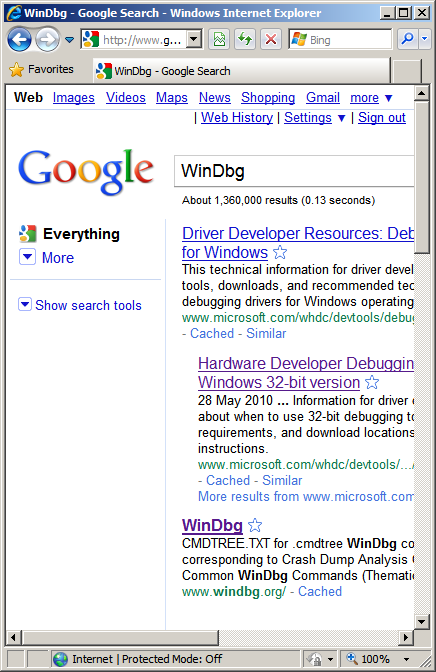
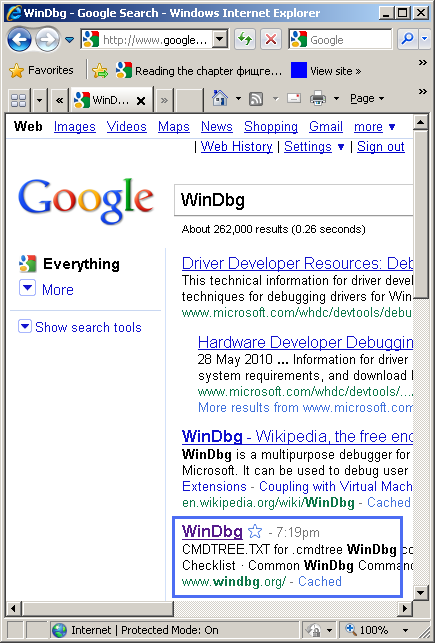
More than 2 years ago I set up WinDbg.org domain to test how quickly I could move up in Google ranking if I search for “WinDbg”. Today I noticed the great progress despite the fact that it is difficult to beat Microsoft and Wikipedia in search ranking ![]() As you can see from the screenshot below it achieved the 3rd position in the 1st level ranking:
As you can see from the screenshot below it achieved the 3rd position in the 1st level ranking:
- Dmitry Vostokov @ DumpAnalysis.org + TraceAnalysis.org -
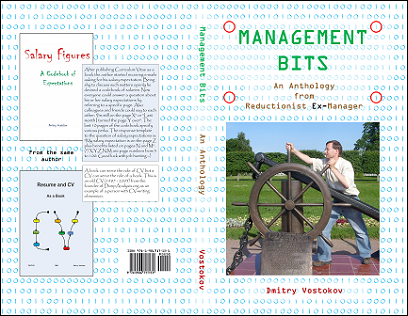
Being a software engineer, the author penetrated a software technical support department of a major software company rising to a management position. There he started collecting various management bits and tips promising everyone to write a management book. After moving back to engineering he became a director of several software research, education, publishing and software behavior analysis consultancy institutions including a museum. This book is an anthology of selected and edited blog posts from his Management Bits and Tips blog.
What this book has to do with the crash dump analysis then? Considering metaphorically an organization as a software machine, teams as processes and individuals as threads the author had applied his unique knowledge of software crashes and hangs to organizational project failures.
- Dmitry Vostokov @ DumpAnalysis.org + TraceAnalysis.org -
Today we introduce an icon for Historical Information pattern:
B/W
![]()
Color
![]()
The icon motivated the following debugging slang: BCE
- Dmitry Vostokov @ DumpAnalysis.org + TraceAnalysis.org -
BCE - Before Crash Era. BC - Before Crash. Analog of Before Common Era. CE - Crash Era. Analog of Common Era.
Examples: I see BCE traces on the raw stack.
Note: See how it is related to the history of our Universe: EPOCH
- Dmitry Vostokov @ DumpAnalysis.org + TraceAnalysis.org -
Today we introduce an icon for Busy System pattern:
B/W
![]()
Color
![]()
- Dmitry Vostokov @ DumpAnalysis.org + TraceAnalysis.org -
The process was reported consuming CPU and its user memory dump was saved. The main thread was a spiking thread indeed:
0:000> !runaway f

 User Mode Time

  Thread       Time

   0:4b8       0 days 0:00:16.078

   2:fec       0 days 0:00:00.000

   1:630       0 days 0:00:00.000

 Kernel Mode Time

  Thread       Time

   0:4b8       0 days 0:00:44.218

   2:fec       0 days 0:00:00.000

   1:630       0 days 0:00:00.000

 Elapsed Time

  Thread       Time

   0:4b8       0 days 0:08:23.342

   1:630       0 days 0:08:21.844

   2:fec       0 days 0:02:46.425
0:000> kL

ChildEBP RetAddr

0012fc80 7e43e1ad ntdll!KiFastSystemCallRet

0012fca8 74730844 user32!NtUserCallNextHookEx+0xc

0012fcec 7e431923 DllA!ThreadKeyboardProc+0×77

0012fd20 7e42b317 user32!DispatchHookA+0×101

0012fd5c 7e430238 user32!CallHookWithSEH+0×21

0012fd80 7c90e473 user32!__fnHkINDWORD+0×24

0012fda4 7e4193e9 ntdll!KiUserCallbackDispatcher+0×13

0012fdd0 7e419402 user32!NtUserPeekMessage+0xc

0012fdfc 747528ee user32!PeekMessageW+0xbc

[…]

0012ffc0 7c817077 ApplicationA+0×10f1

0012fff0 00000000 kernel32!BaseProcessStart+0×23
We see the presence of a peek message loop (that can be the source of CPU consumption) but we also see a message hook function implemented in DllA. To see if there are any other hooks including patched API we look at the raw stack:
0:000> !teb

TEB at 7ffde000

    ExceptionList:        0012fcdc

    StackBase:            00130000

    StackLimit:           0011b000

    SubSystemTib:         00000000

    FiberData:            00001e00

    ArbitraryUserPointer: 00000000

    Self:                 7ffde000

    EnvironmentPointer:   00000000

    ClientId:             0000050c . 000004b8

    RpcHandle:            00000000

    Tls Storage:          00000000

    PEB Address:          7ffdf000

    LastErrorValue:       0

    LastStatusValue:      c0000034

    Count Owned Locks:    0

    HardErrorMode:        0
0:000> dps 0011b000 00130000

[...]

0012e8f0  11201000 DllBHooks+0×1000

[…]

0012fb9c  00000003

0012fba0  001d0001

0012fba4  0012fbc8

0012fba8  1120146b DllBHooks+0×146b

0012fbac  00000000

0012fbb0  00000003

0012fbb4  00000011

0012fbb8  001d0001

0012fbbc  00000003

0012fbc0  00020003

0012fbc4  001d0001

0012fbc8  0012fbfc

0012fbcc  7e431923 user32!DispatchHookA+0×101

0012fbd0  00000003

0012fbd4  00000011

0012fbd8  001d0001

0012fbdc  00020001

0012fbe0  7ffde000

0012fbe4  00000001

0012fbe8  7ffde000

0012fbec  00020001

0012fbf0  00000000

0012fbf4  00000003

0012fbf8  00000001

0012fbfc  0012fc38

0012fc00  7e42b317 user32!CallHookWithSEH+0×21

0012fc04  00020003

0012fc08  00000011

0012fc0c  00000000

0012fc10  7e42b326 user32!CallHookWithSEH+0×44

0012fc14  00020001

0012fc18  7ffde000

0012fc1c  00000001

0012fc20  0012fc14

0012fc24  00000001

0012fc28  0012fcdc

0012fc2c  7e44048f user32!_except_handler3

0012fc30  7e42b330 user32!`string’+0×6

0012fc34  ffffffff

0012fc38  7e42b326 user32!CallHookWithSEH+0×44

0012fc3c  7e430238 user32!__fnHkINDWORD+0×24

0012fc40  0012fc6c

0012fc44  001d0001

0012fc48  7e430248 user32!__fnHkINDWORD+0×34

0012fc4c  00000000

0012fc50  00000000

0012fc54  00000004

0012fc58  0012fc7c

0012fc5c  0012fca8

0012fc60  7c90e473 ntdll!KiUserCallbackDispatcher+0×13

0012fc64  0012fc6c

0012fc68  00000018

0012fc6c  00020003

0012fc70  00000011

0012fc74  112013c0 DllBHooks+0×13c0

0012fc78  7e4318d1 user32!DispatchHookA

0012fc7c  0012fcb8

0012fc80  7472467f DllA!GetThread+0×1d

0012fc84  7e43e1ad user32!NtUserCallNextHookEx+0xc

0012fc88  7e43e18a user32!CallNextHookEx+0×6f

0012fc8c  00000003

0012fc90  00000011

[…]
We find a few references to DllBHooks module and initially 11201000 (DllBHooks+0×1000) looks like coincidental symbolic information and it is not a meaningful code indeed:
0:000> ub 11201000

DllBHooks+0xff0:

11200ff0 0000            add     byte ptr [eax],al

11200ff2 0000            add     byte ptr [eax],al

11200ff4 0000            add     byte ptr [eax],al

11200ff6 0000            add     byte ptr [eax],al

11200ff8 0000            add     byte ptr [eax],al

11200ffa 0000            add     byte ptr [eax],al

11200ffc 0000            add     byte ptr [eax],al

11200ffe 0000            add     byte ptr [eax],al
However further module references look valid:
0:000> ub 112013c0

DllBHooks+0×13af:

112013af 68ff000000      push    0FFh

112013b4 ff152c202011    call    dword ptr [DllBHooks!HookKeyboard+0xbac (1120202c)]

112013ba 5e              pop     esi

112013bb 90              nop

112013bc 90              nop

112013bd 90              nop

112013be 90              nop

112013bf 90              nop
0:000> u 112013c0

DllBHooks+0×13c0:

112013c0 55              push    ebp

112013c1 8bec            mov     ebp,esp

112013c3 53              push    ebx

112013c4 8b5d10          mov     ebx,dword ptr [ebp+10h]

112013c7 56              push    esi

112013c8 8b7508          mov     esi,dword ptr [ebp+8]

112013cb 57              push    edi

112013cc 8b7d0c          mov     edi,dword ptr [ebp+0Ch]
0:000> ub 1120146b

DllBHooks+0×1453:

11201453 ff1558202011    call    dword ptr [DllBHooks!HookKeyboard+0xbd8 (11202058)]

11201459 8b0dd4302011    mov     ecx,dword ptr [DllBHooks!HookKeyboard+0×1c54 (112030d4)]

1120145f 53              push    ebx

11201460 57              push    edi

11201461 56              push    esi

11201462 8b11            mov     edx,dword ptr [ecx]

11201464 52              push    edx

11201465 ff155c202011    call    dword ptr [DllBHooks!HookKeyboard+0xbdc (1120205c)]
0:000> u 1120146b

DllBHooks+0×146b:

1120146b 5f              pop     edi

1120146c 5e              pop     esi

1120146d 5b              pop     ebx

1120146e 5d              pop     ebp

1120146f c20c00          ret     0Ch

11201472 90              nop

11201473 90              nop

11201474 90              nop
Using lmv command we discover that DllA and DllBHooks modules belong to different vendors but share the same “keyboard” related functionality. So we don’t have an instance of semantic split pattern here and both module versions need to be checked and also removed for testing purposes if necessary.
Continue scanning the raw stack we also find another hooking module that surfaces in !chkimg command as well:
[...]

0012a22c  00000000

0012a230  00205558

0012a234  0012a24c

0012a238  00913ae6 DllCHook!DllUnregisterServer+0×1b06

0012a23c  00000020

0012a240  00000000

0012a244  00205558

0012a248  00205558

0012a24c  0012a25c

0012a250  00913d73 DllCHook!DllUnregisterServer+0×1d93

0012a254  00205558

0012a258  00000038

[…]
0:000> ub 00913ae6

DllCHook!DllUnregisterServer+0×1af2:

00913ad2 7412            je      DllCHook!DllUnregisterServer+0×1b06 (00913ae6)

00913ad4 85f6            test    esi,esi

00913ad6 740e            je      DllCHook!DllUnregisterServer+0×1b06 (00913ae6)

00913ad8 a180e49800      mov     eax,dword ptr [DllCHook+0×232d0 (0098e480)]

00913add 56              push    esi

00913ade 6a00            push    0

00913ae0 50              push    eax

00913ae1 e88a920000      call    DllCHook!DllUnregisterServer+0xad90 (0091cd70)
0:000> ub 00913d73

DllCHook!DllUnregisterServer+0×1d7d:

00913d5d 8b4604          mov     eax,dword ptr [esi+4]

00913d60 85c0            test    eax,eax

00913d62 7409            je      DllCHook!DllUnregisterServer+0×1d8d (00913d6d)

00913d64 50              push    eax

00913d65 e826fdffff      call    DllCHook!DllUnregisterServer+0×1ab0 (00913a90)

00913d6a 83c404          add     esp,4

00913d6d 56              push    esi

00913d6e e81dfdffff      call    DllCHook!DllUnregisterServer+0×1ab0 (00913a90)
0:000> !chkimg -lo 50 -d !kernel32 -v

Searching for module with expression: !kernel32

Will apply relocation fixups to file used for comparison

Will ignore NOP/LOCK errors

Will ignore patched instructions

Image specific ignores will be applied

Comparison image path: c:\mss\kernel32.dll\49C4F482f6000\kernel32.dll

No range specified
Scanning section:    .text

Size: 537065

Range to scan: 7c801000-7c8841e9

    7c801af5-7c801af9  5 bytes - kernel32!LoadLibraryExW

 [ 6a 34 68 f8 e0:e9 06 e5 58 03 ]

[…]
0:000> u 7c801af5

kernel32!LoadLibraryExW:

7c801af5 e906e55803 jmp 7fd90000

7c801afa 807ce8d509 cmp byte ptr [eax+ebp*8-2Bh],9

7c801aff 0000 add byte ptr [eax],al

7c801b01 33ff xor edi,edi

7c801b03 897dd8 mov dword ptr [ebp-28h],edi

7c801b06 897dd4 mov dword ptr [ebp-2Ch],edi

7c801b09 897de0 mov dword ptr [ebp-20h],edi

7c801b0c 897de4 mov dword ptr [ebp-1Ch],edi
0:000> u 7fd90000

7fd90000 e93b5eb880 jmp DllCHook!DllUnregisterServer+0×3e60 (00915e40)

7fd90005 6a34 push 34h

7fd90007 68f8e0807c push offset kernel32!`string’+0xc (7c80e0f8)

7fd9000c e9eb1aa7fc jmp kernel32!LoadLibraryExW+0×7 (7c801afc)

7fd90011 0000 add byte ptr [eax],al

7fd90013 0000 add byte ptr [eax],al

7fd90015 0000 add byte ptr [eax],al

7fd90017 0000 add byte ptr [eax],al
0:000> !chkimg -lo 50 -d !user32 -v

Searching for module with expression: !user32

Will apply relocation fixups to file used for comparison

Will ignore NOP/LOCK errors

Will ignore patched instructions

Image specific ignores will be applied

Comparison image path: c:\mss\user32.dll\4802A11B91000\user32.dll

No range specified
Scanning section:    .text

Size: 389763

Range to scan: 7e411000-7e470283

    7e45a275-7e45a279  5 bytes - user32!ExitWindowsEx

 [ 8b ff 55 8b ec:e9 86 5d 87 01 ]

[…]
0:000> u 7e45a275

user32!ExitWindowsEx:

7e45a275 e9865d8701 jmp 7fcd0000

7e45a27a 83ec18 sub esp,18h

7e45a27d 53 push ebx

7e45a27e 8b5d08 mov ebx,dword ptr [ebp+8]

7e45a281 56 push esi

7e45a282 8bf3 mov esi,ebx

7e45a284 81e60b580000 and esi,580Bh

7e45a28a f7de neg esi
0:000> u 7fcd0000

7fcd0000 e9cba0c580 jmp DllCHook+0×65d0 (0092a0d0)

7fcd0005 8bff mov edi,edi

7fcd0007 55 push ebp

7fcd0008 8bec mov ebp,esp

7fcd000a e96ba278fe jmp user32!ExitWindowsEx+0×5 (7e45a27a)

7fcd000f 0000 add byte ptr [eax],al

7fcd0011 0000 add byte ptr [eax],al

7fcd0013 0000 add byte ptr [eax],al
0:000> !chkimg -lo 50 -d !advapi32 -v

Searching for module with expression: !advapi32

Will apply relocation fixups to file used for comparison

Will ignore NOP/LOCK errors

Will ignore patched instructions

Image specific ignores will be applied

Comparison image path: c:\mss\advapi32.dll\49901D489b000\advapi32.dll

No range specified
Scanning section:    .text

Size: 476617

Range to scan: 77dd1000-77e455c9

    77e34ce5-77e34ce9  5 bytes - advapi32!InitiateSystemShutdownExW

 [ 8b ff 55 8b ec:e9 16 b3 e8 07 ]

[…]
0:000> u 77e34ce5

advapi32!InitiateSystemShutdownExW:

77e34ce5 e916b3e807      jmp     7fcc0000

77e34cea 83ec14          sub     esp,14h

77e34ced 53              push    ebx

77e34cee 56              push    esi

77e34cef 33db            xor     ebx,ebx

77e34cf1 57              push    edi

77e34cf2 8b7d08          mov     edi,dword ptr [ebp+8]

77e34cf5 43              inc     ebx
0:000> u 7fcc0000

7fcc0000 e99ba1c680      jmp     DllCHook+0×66a0 (0092a1a0)

7fcc0005 8bff            mov     edi,edi

7fcc0007 55              push    ebp

7fcc0008 8bec            mov     ebp,esp

7fcc000a e9db4c17f8      jmp     advapi32!InitiateSystemShutdownExW+0×5 (77e34cea)

7fcc000f 0000            add     byte ptr [eax],al

7fcc0011 0000            add     byte ptr [eax],al

7fcc0013 0000            add     byte ptr [eax],al
However we know from other sources that DllCHook module doesn’t have any relation to “keyboard”.
We also find another module DllDHook on the raw stack but it looks like a pure coincidence (UNICODE-style addresses):
[...]

00129f10  016000ca

00129f14  00aa0004 DllDHook+0×3e414

00129f18  000100ca

00129f1c  00aa00ca DllDHook+0×3e4da

00129f20  00cf0001

[…]
0:000> ub 00aa0004

DllDHook+0×3e402:

00a9fff2 0000            add     byte ptr [eax],al

00a9fff4 0000            add     byte ptr [eax],al

00a9fff6 0000            add     byte ptr [eax],al

00a9fff8 0000            add     byte ptr [eax],al

00a9fffa 0000            add     byte ptr [eax],al

00a9fffc a00f0000a0      mov     al,byte ptr ds:[A000000Fh]

00aa0001 57              push    edi

00aa0002 1b00            sbb     eax,dword ptr [eax]
0:000> u 00aa0004

DllDHook+0×3e414:

00aa0004 ff              ???

00aa0005 ff              ???

00aa0006 ff              ???

00aa0007 ff00            inc     dword ptr [eax]

00aa0009 0000            add     byte ptr [eax],al

00aa000b 0000            add     byte ptr [eax],al

00aa000d 0000            add     byte ptr [eax],al

00aa000f 0000            add     byte ptr [eax],al
0:000> ub 00aa00ca

DllDHook+0×3e4ca:

00aa00ba 0000            add     byte ptr [eax],al

00aa00bc 0000            add     byte ptr [eax],al

00aa00be 0000            add     byte ptr [eax],al

00aa00c0 0000            add     byte ptr [eax],al

00aa00c2 0000            add     byte ptr [eax],al

00aa00c4 0000            add     byte ptr [eax],al

00aa00c6 0000            add     byte ptr [eax],al

00aa00c8 0000            add     byte ptr [eax],al
0:000> u 00aa00ca

DllDHook+0×3e4da:

00aa00ca 0000            add     byte ptr [eax],al

00aa00cc 0000            add     byte ptr [eax],al

00aa00ce 0000            add     byte ptr [eax],al

00aa00d0 0000            add     byte ptr [eax],al

00aa00d2 0000            add     byte ptr [eax],al

00aa00d4 0000            add     byte ptr [eax],al

00aa00d6 0000            add     byte ptr [eax],al

00aa00d8 0000            add     byte ptr [eax],al
- Dmitry Vostokov @ DumpAnalysis.org + TraceAnalysis.org -

- Dmitry Vostokov @ DumpAnalysis.org + TraceAnalysis.org -
The rules of the previously announced competition have been changed. You can now also nominate someone by sending a debugging story link. Please send your story or a nomination using this page: http://www.dumpanalysis.org/contact or dmitry dot vostokov at dumpanalysis dot org (if a story is with pictures).

- Dmitry Vostokov @ DumpAnalysis.org + TraceAnalysis.org -