Colorimetric Computer Memory Dating (Part 1)
Similar to radiometric dating using isotopes we can use memory visualization techniques to see distribution of allocated buffers and their retention over time. The key is to allocate colored memory. For example, to append a red buffer that contains RGBA values 0xFF000000 to specific allocations. I call these colored memory marks isomemotopes.
We can either inject a different isomemotope for a different data or change the isomemotope over time to mark specific allocation times. I created a test program that allocates buffers marked by a different amount of different isomemotopes every time:
#include "stdafx.h"

#include <stdlib.h>

#include <memory.h>

#include <windows.h>
typedef unsigned int ISOMEMOTOPE;
void *alloc_and_mark_with_isomemotope(size_t size,

                                     ISOMEMOTOPE color,

                                     size_t amount)

{

  char *p = (char *)malloc(size+amount);
  for (char *isop = p+size;

       p && isop  < p+size+amount;

       isop+=sizeof(ISOMEMOTOPE))

  {

    *(ISOMEMOTOPE *)isop=color;

  }
  return p;

}
int _tmain(int argc, _TCHAR* argv[])

{

  alloc_and_mark_with_isomemotope(0x1000,

                                 0xFF000000, // red

                                 0x10000);

  alloc_and_mark_with_isomemotope(0x1000,

                                 0x00FF0000, // green

                                 0x20000);

  alloc_and_mark_with_isomemotope(0x1000,

                                 0x0000FF00, // blue

                                 0x30000);

  alloc_and_mark_with_isomemotope(0x1000,

                                 0xFFFFFF00, // white

                                 0x40000);

  alloc_and_mark_with_isomemotope(0x1000,

                                 0xFFFF0000, // yellow

                                 0x50000);
DebugBreak();
  return 0;

}
Corresponding Dump2Picture image is this (0×00000000 address is at the bottom):
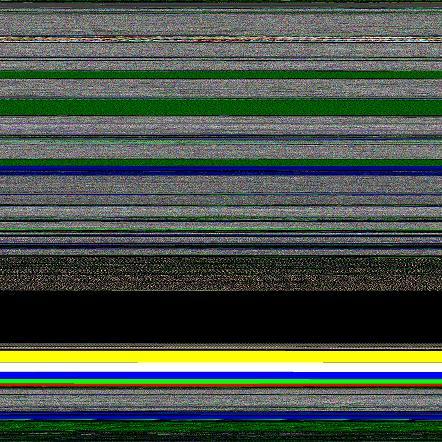
![]()
- Dmitry Vostokov @ DumpAnalysis.org -
August 12th, 2008 at 8:05 pm
[…] cover features visualized virtual process memory generated from a memory dump of colometric computer memory dating sample using […]
January 16th, 2009 at 12:30 am
[…] Data structure instrumentation (pp. 54-55) - I devised a visual method called Colometric Computer Memory Dating http://www.dumpanalysis.org/blog/index.php/2008/04/16/computer-colometric-memory-dating-part-1/ […]